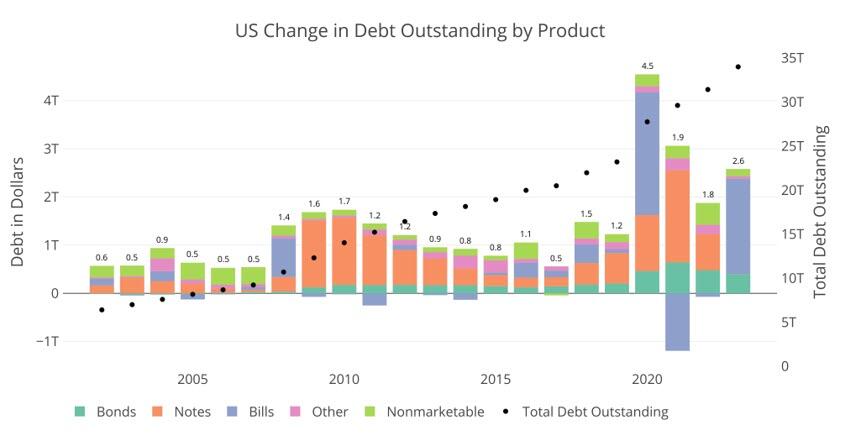
The only other times Bills were used as a primary funding source was in 2008 during the Great Financial Crisis and 2020 during Covid. Neither year came close to 77% of total new debt issuance. These were also emergency times, and specifically in 2021, almost half the short-term debt was retired in favor of Notes and Bonds to undo the 2020 Bill issuance.
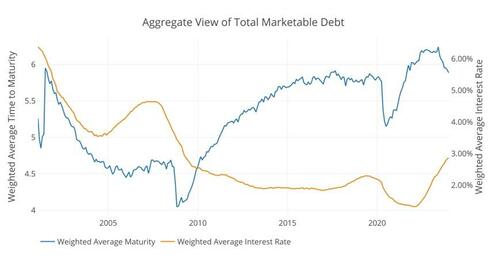
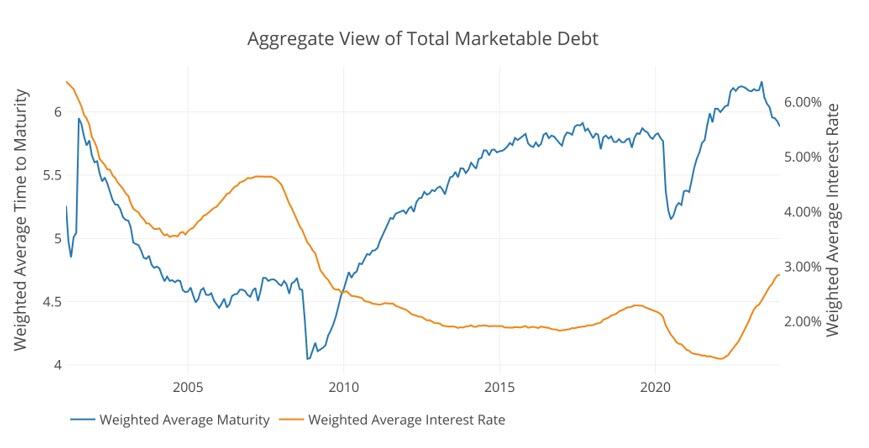
The Treasury has spent nearly two decades trying to extend the maturity of the debt. This can be seen in the blue line below that shows the average debt maturity. When the short term debt is issued in such a way, it drives down the average maturity, which causes the Treasury to have to roll-over more debt in shorter time periods. So why has the Treasury all of a sudden gone entirely to short-term debt in non-emergency times? The answer lies in the orange line, so let’s dig in.
Figure: 2 Weighted Averages
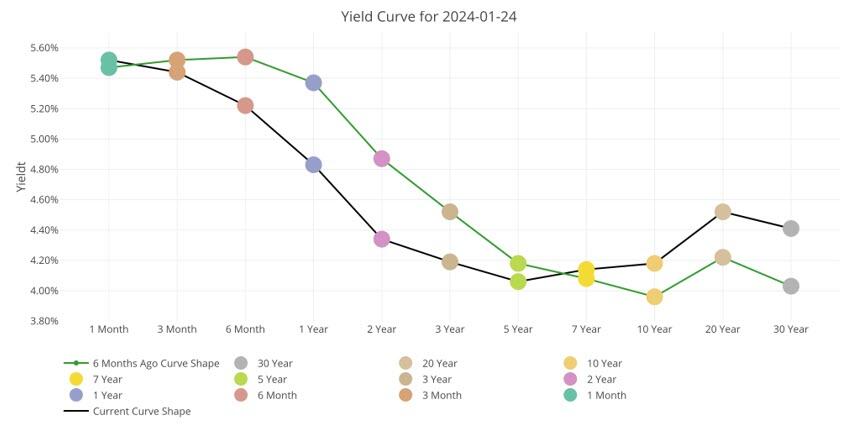
First, it is important to understand the interest rates the Treasury is facing. The chart below shows the current yield curve as it stands today and 6 months ago. As you can see, short-term rates are a full 1%-1.5% higher than medium-term. What?!? Didn’t we just see that the Treasury has specifically targeted short-term debt?
Why are they paying more than they have to? Had the Treasury financed the $2T with Notes, they would have saved $30B in interest this year alone!
Figure: 3 Tracking Yield Curve Inversion
So, why have they done this? Well, there are two potential possibilities.
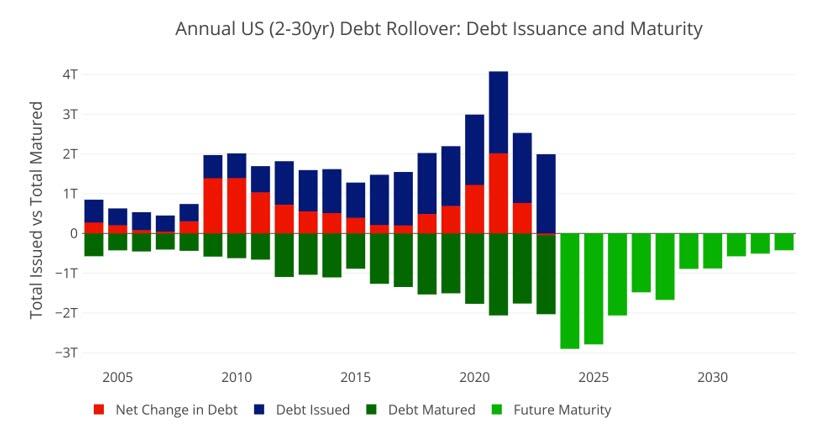
First, they may be nervous about the market’s ability to handle so much medium-term debt. The market typically digests short-term debt very easily, but it can become saturated with medium-term debt. The chart below shows the amount of medium-term debt that rolled over last year. This is not new issuance; this is debt maturing that needs to be rolled over.
As shown, nearly $2T rolled over last year. This means, had the Treasury issued Notes instead of Bills, the Market would have had to absorb a whopping $4T in new medium-term debt like they did in 2020. The difference this year is that back in 2020 the Fed bought nearly all of that debt, putting a floor under the market.
Compounding this problem further is that this year is set to be a record year in terms of debt rollover. Nearly $2.9T in Notes need to be rolled over.
Figure: 4 Treasury Rollover
Still, even with that massive amount of debt issuance, there must be more to the story. Why would Yellen specifically pay $30B more in interest just because she is concerned the about the volume of debt issuance. As Figure 1 above shows, this has never been a concern in the past except in emergency situations. Furthermore, why not issue at least some new debt as medium-term.
This lends to a second, and more probable conclusion. Long-term rates are set to fall in the very near term. The Treasury did not want to lock in for 2-7 years at 4% if it knows rates will fall. It will pay a premium ($30B this year), if it means it can lock in lower rates for longer and save the money on the back end.
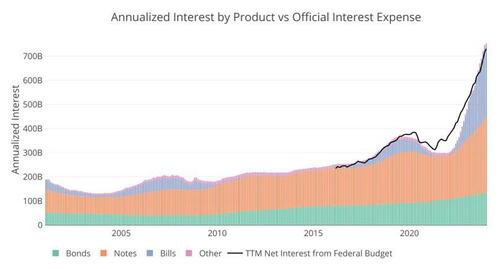
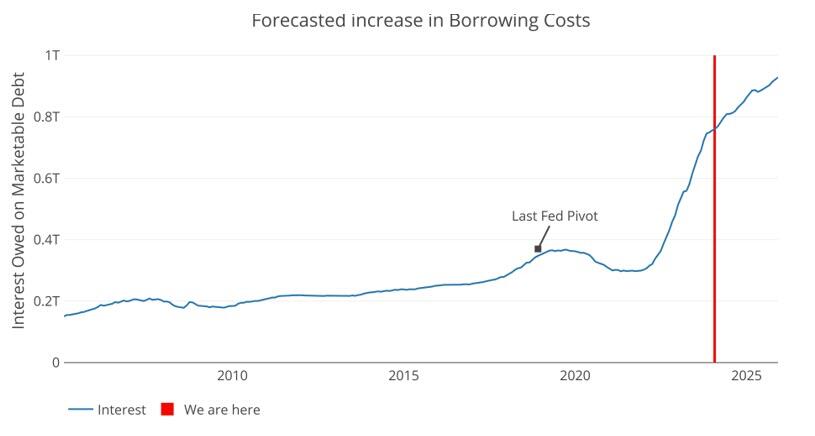
So, why are long-term rates, going to fall? Because they have to… the chart below shows the current interest owed on the national debt annualized. It’s not a pretty picture, and you can see how the interest from Bills has absolutely ballooned.
Figure: 5 Net Interest Expense
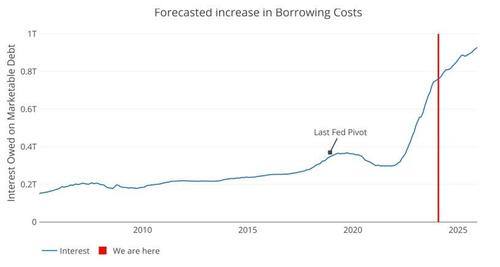
The Fed has come out with their dot plot that shows a calm glide path down. Well, we can take the debt maturity and push it forward at the projected rate of the Fed. Even given the current proposed 6 rate cuts, and getting back to 3.5% by early 2025, the trajectory for interest expense is not looking good.
Given current projections by the Fed, the Treasury will owe over $900B on interest by 2025. That is a debt death spiral. The Fed had to pivot back in 2018 when interest expense neared $400B. Next year, the cost will be more than double that!
Figure: 6 Projected Net Interest Expense
There is a potential third option. It’s an election year. Maybe Yellen is doing everything and anything to keep the financial system running smoothly. She has decided that the Treasury market must remain 100% stable and wants to take no chances. Thus, she issues tons of short-term debt, costing the tax payer an extra $30B this year and decides it’s a problem to be fixed at a later date.
While this would be wildly irresponsible and corrupt, the real argument against possibility 3 is the same as possibility 1, the market should be able to ingest at least some medium-term debt. This means the only logical conclusion is that she knows rates are coming down hard and fast. How does she know? Well, she used to be the head of the Fed.
There is no doubt, everyone in Washington can do the simple math above and recognize the Fed cannot take a glide path down. The only option is for rates to come down. Yellen just bet $2T on that outcome.
Joe, are you kidding about the sizzling economy? Karine Jean Pierre is also guilty of comedy or gross propaganda.
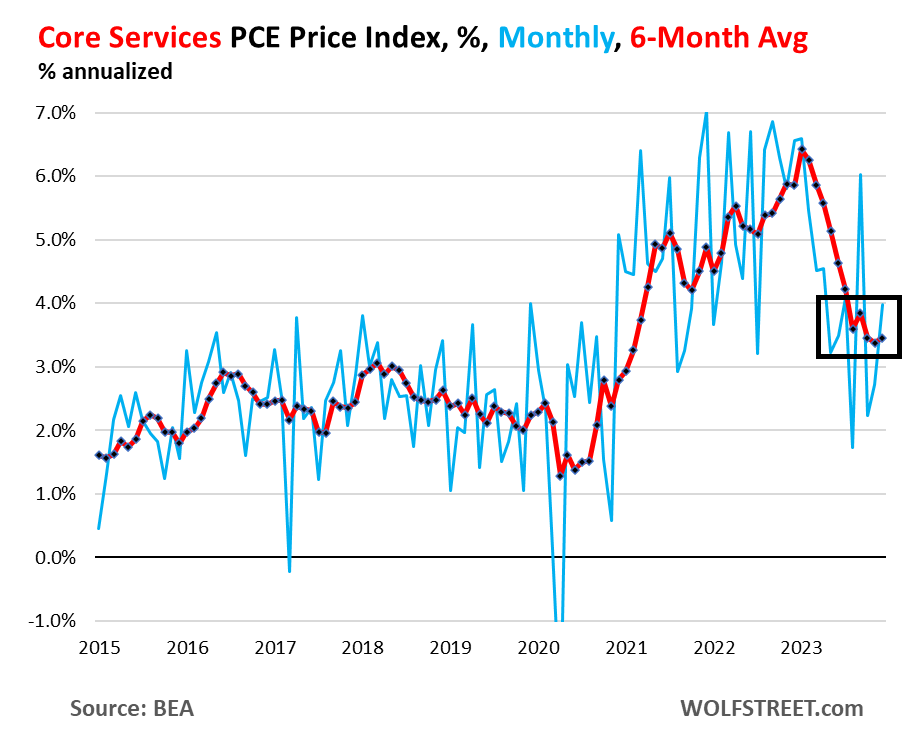
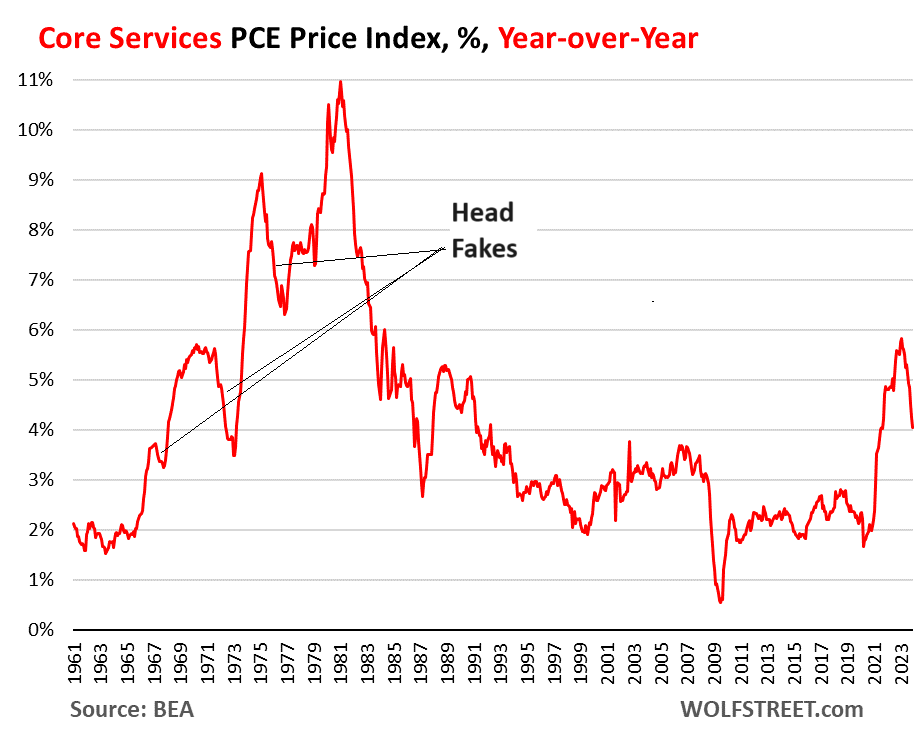
So right up front – and the Fed has been talking about this, though no one listens: The “core services” PCE price index has gotten stuck at 3.5% over the past six months annualized, and accelerated to 4.0% month-to-month annualized in December, with housing inflation stuck at about 6.7% over the past six months annualized, and with other core services components still red-hot.
The core services PCE price index rose by 0.33% in December from November, the second acceleration in a row, according to data from the Bureau of Economic Analysis today. This amounts to an increase of 4.0% annualized (blue).
The six-month moving average, which irons out the huge ups and downs of the month-to-month data, accelerated to 3.5%, and has been in this range since August, after the sharp deceleration in early 2023 (red).
Core services is where consumers spend the majority of their money, and they matter. Which is why Fed governors have said in near unison that they’re in no hurry to cut rates, but have taken a wait-and-see approach, with an eye on core services. And if it goes away, fine.
But on the surface, the PCE price index looks encouraging, and this has been the trend for months, with the overall PCE price index at +2.6% year-over-year in December, the lowest since March 2021; and with the core PCE price index at +2.9% year-over-year, also the lowest since March 2021, and aiming for the Fed’s 2% target.
The factors for the year-over-year cooling in these inflation measures have been the same for months: plunging energy prices, sharply dropping prices of durable goods after the huge spike in 2020 and 2021, cooling food inflation (with prices still rising from very high levels, but slowly), and favorable “base effects” when compared to a year ago.
But energy prices don’t plunge forever, so that will go away; durable goods prices don’t drop sharply forever either, though they can drop for a while longer to unwind some more of the price spike they’d been through in 2020 and 2021; and the base effects are going to get timed out this year, when the base of the year-over-year comparisons become the lower inflation figures of 2023.
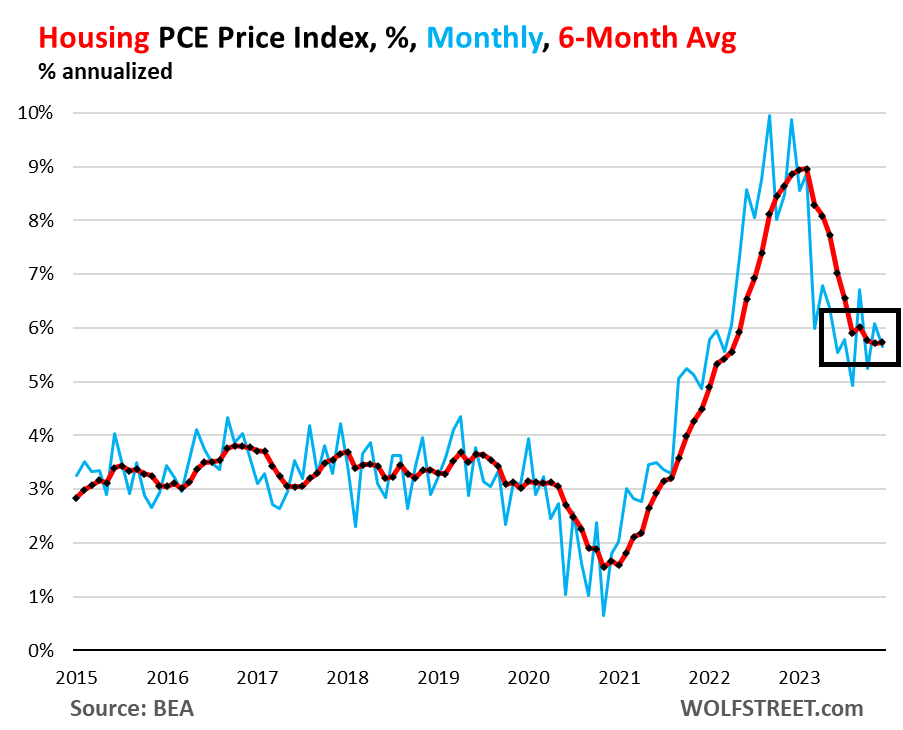
Housing inflation, still red hot and not cooling anymore. The PCE price index for housing rose by 0.46% in December from November and has been in this range since March, after the sharp slowdown early in 2023. This amounts to 5.7% annualized (blue in the chart below).
The housing index is broad-based and includes factors for rent in tenant-occupied dwellings; imputed rent for owner-occupied housing, group housing, and rental value of farm dwellings. It’s the largest component of core services.
The six-month moving average annualized, which shows the more recent trends, also rose by 5.7% in December, and has been in the same range since August (red).
So it looks like the PCE price index for housing has gotten stuck at 5.7%. This stubborn inflation in housing is a blow to theories trotted out for 18 months that housing was lagging, and that we know it will go away as an issue, etc., etc. The increases are less hot than they had been, but remain hot and have become persistent.
The major categories of core services in the PCE price index, as a six-month average of month-to-month changes, annualized:
Core services, major categories, 6-month average, annualized
Housing
5.7%
Description and chart above
Non-energy utilities
2.5%
Water, sewer, trash
Health care
2.5%
Physicians, outpatient, hospital, nursing care, dental, etc.
Transportation services
6.1%
Auto repair & maintenance, auto leasing & rentals, public transportation, airfares, etc.
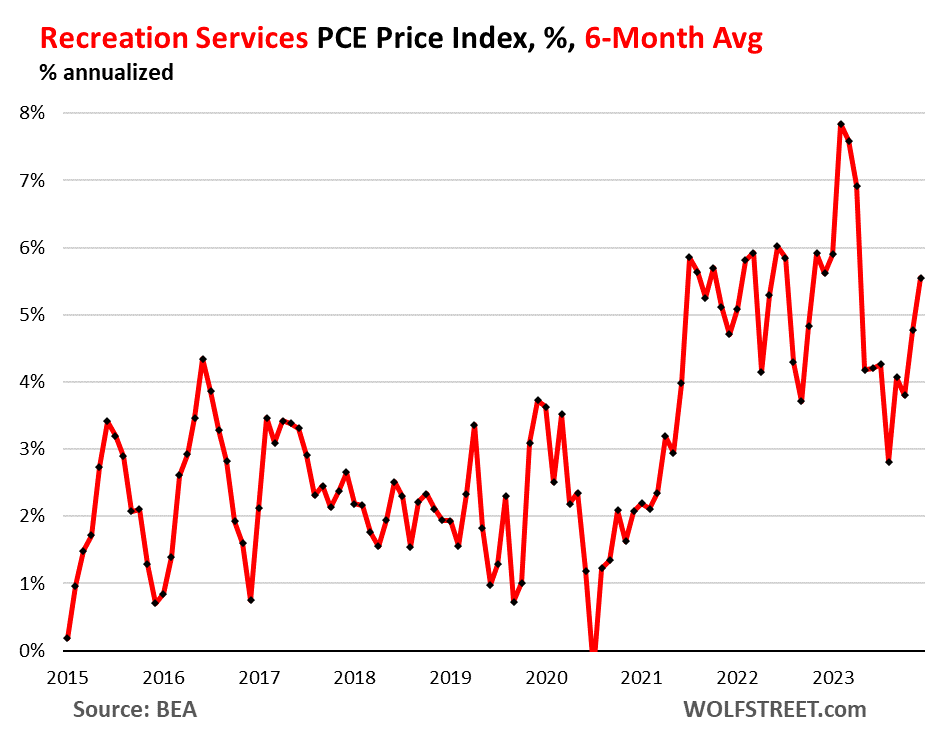
Recreation services
5.6%
Concerts, sports, movies, gambling, streaming, vet services, package tours, etc.
Food services, accommodation
2.8%
Meals & drinks at restaurants, bars, schools, cafeterias, etc.; accommodation at hotels, motels, schools, etc.
Financial services
3.5%
Fees & commissions at banks, brokers, funds, portfolio management, etc.
Insurance
2.8%
Insurance of all kinds, including health insurance
Other services
0.1%
Collection of other services
Inflation in Transportation services and Recreation services is accelerating on the basis of the 6-month moving average, with the PCE price index for Transportation services rising by 6.1%, and the index for Recreation services rising by 5.6%:
The head-fakes last time.
Inflation in services turns out to be tough to beat, and it can dish up big head-fakes. Last time we had this type of surge of inflation, so that was in the 1970s and 1980s, we thought repeatedly that we had inflation licked, only to find out that we’d fallen for an inflation head-fake. There were three head-fakes in core services on the way to the peak of 11% in 1981:
But Democrats are desperate to stay in power and rake in billons of dollars. Their strategy? Nobody But Joe. Well, except maybe Mike Obama.
Americans are addicted to gov. And government is addicted to spending (and creating more debt).
Let’s look at wage growth for government apparatchiks relative to private sector workers. While wage growth overall was modest, it is government wage growth that is driving it – now at a record high!
Source: Bloomberg
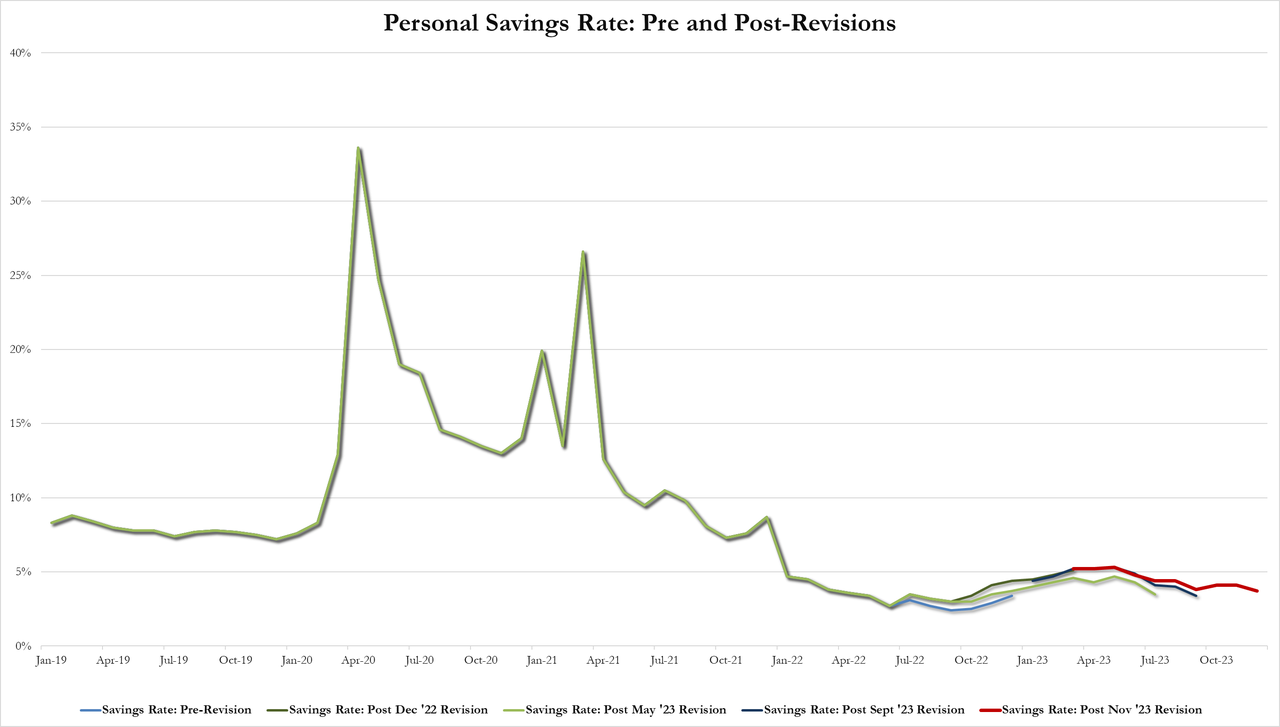
And on the back of that, the savings rate tumbled from 4.1% of DPI to 3.7%…
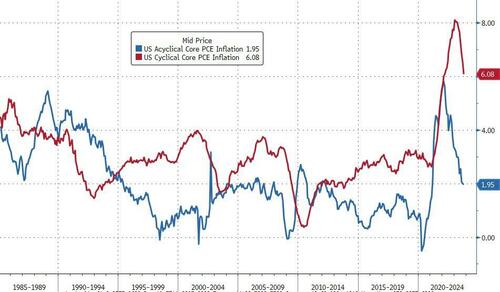
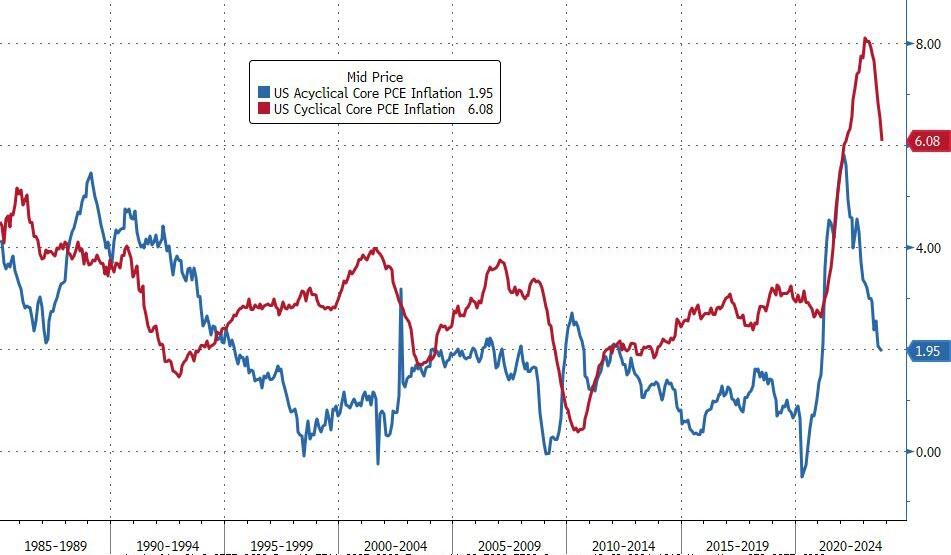
The vast majority of the reduction in inflation has been ‘cyclical’. Acyclical Core PCE inflation remains extremely high, although it has fallen from its highs.
Isn’t it wonderful to be 81 years old like Biden and a have a credit card with seemingly no credit limit? And partner with other octogenarians like Pelosi and McConnell to bankrupt the US? Free-spending US Senate Demagogue Democrat Chuck Schumer is only 73. But all these elderly politicians are heaping debt on to backs of younger Americans.
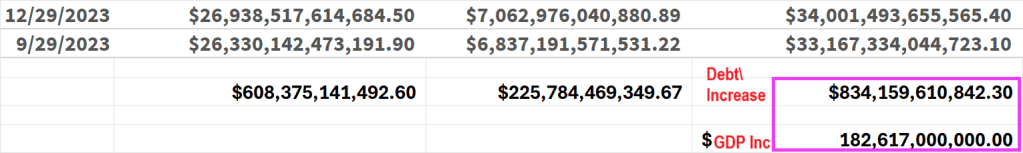
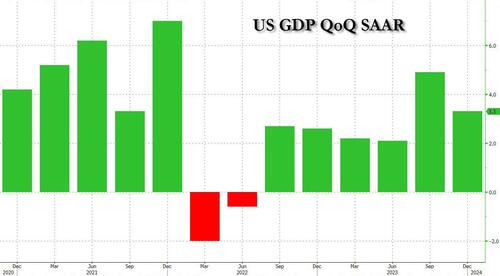
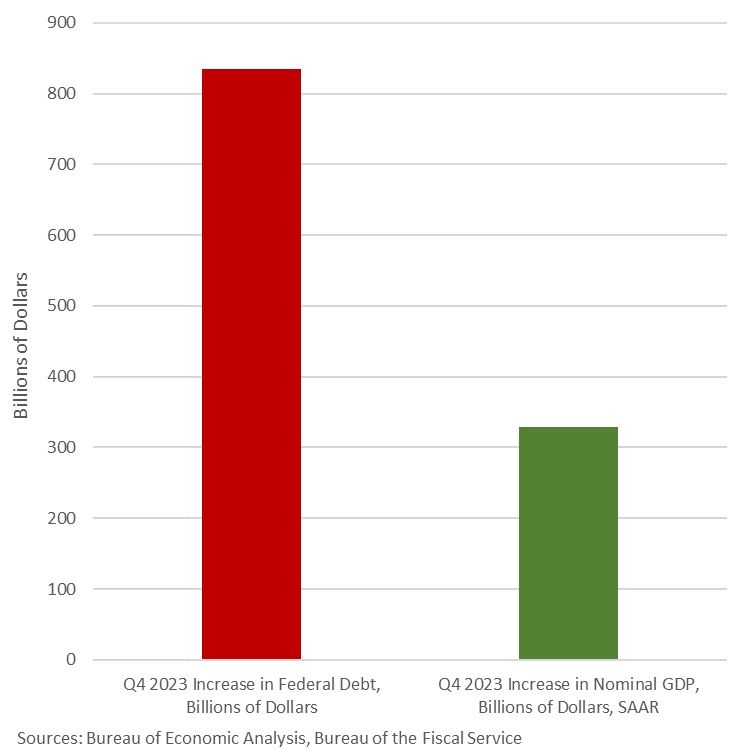
The “surprise” Q4 GDP report showed GDP rising by $182.6 billion. Unfortunately, Biden had to borrow $834 billion to get $182.6 in GDP.
Graphically, we can Biden’s folly where Q4 public debt grew almost 5 times faster than real GDP.
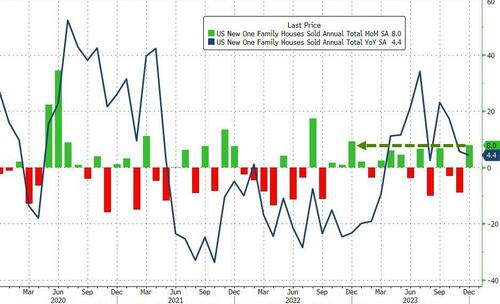
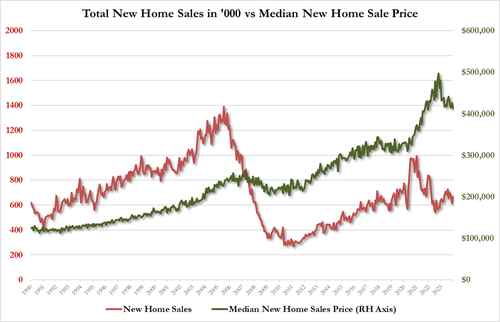
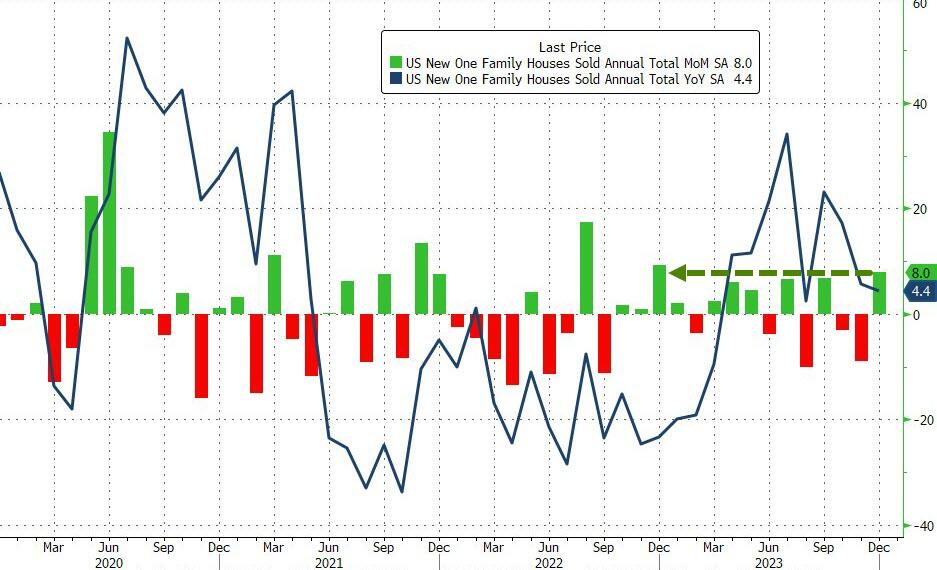
New home sales disappointed in December, rising just 8% MoM (vs 10% exp) but that is still the biggest MoM jump since last December.
Source: Bloomberg
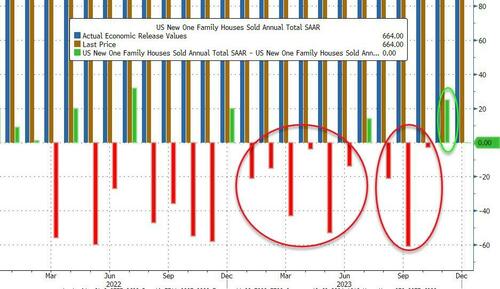
Of course, having pointed out the dramatic series of downward revisions to this data series this year, November’s 12.2% plunge was revised up to a 8.0% drop
Source: Bloomberg
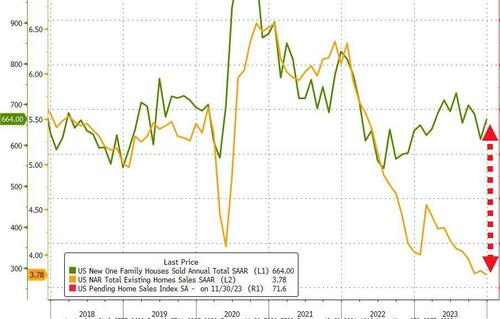
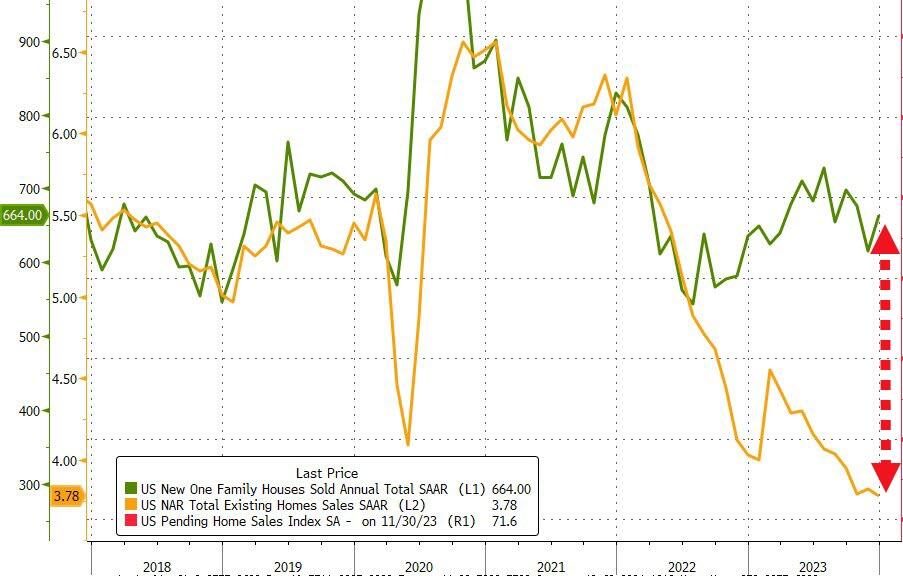
On a SAAR basis, new home sales ended at 664k (pre-COVID-lockdown levels), completely decoupled from existing home sales…
Source: Bloomberg
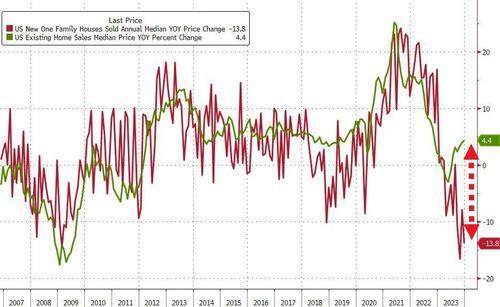
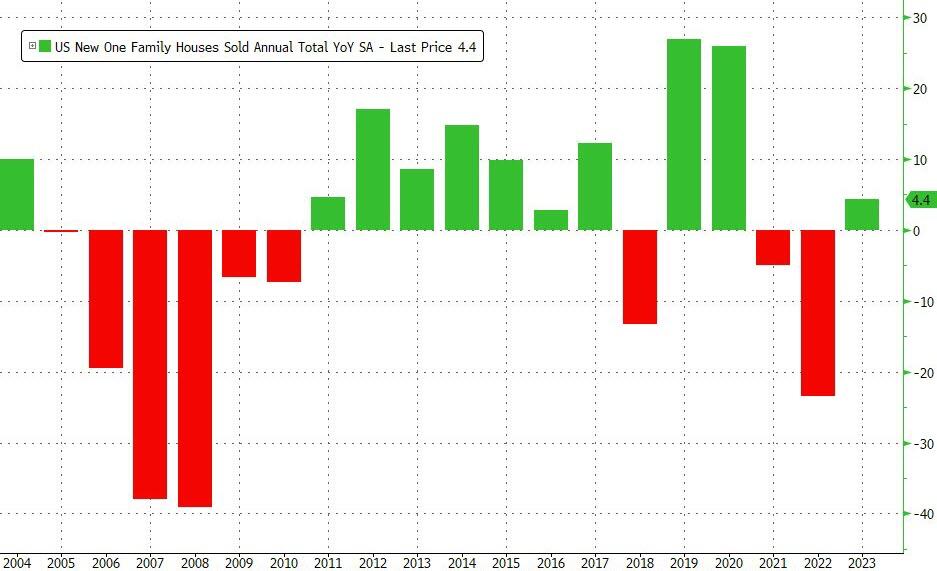
This left new home sales up 4.4% YoY…
Source: Bloomberg
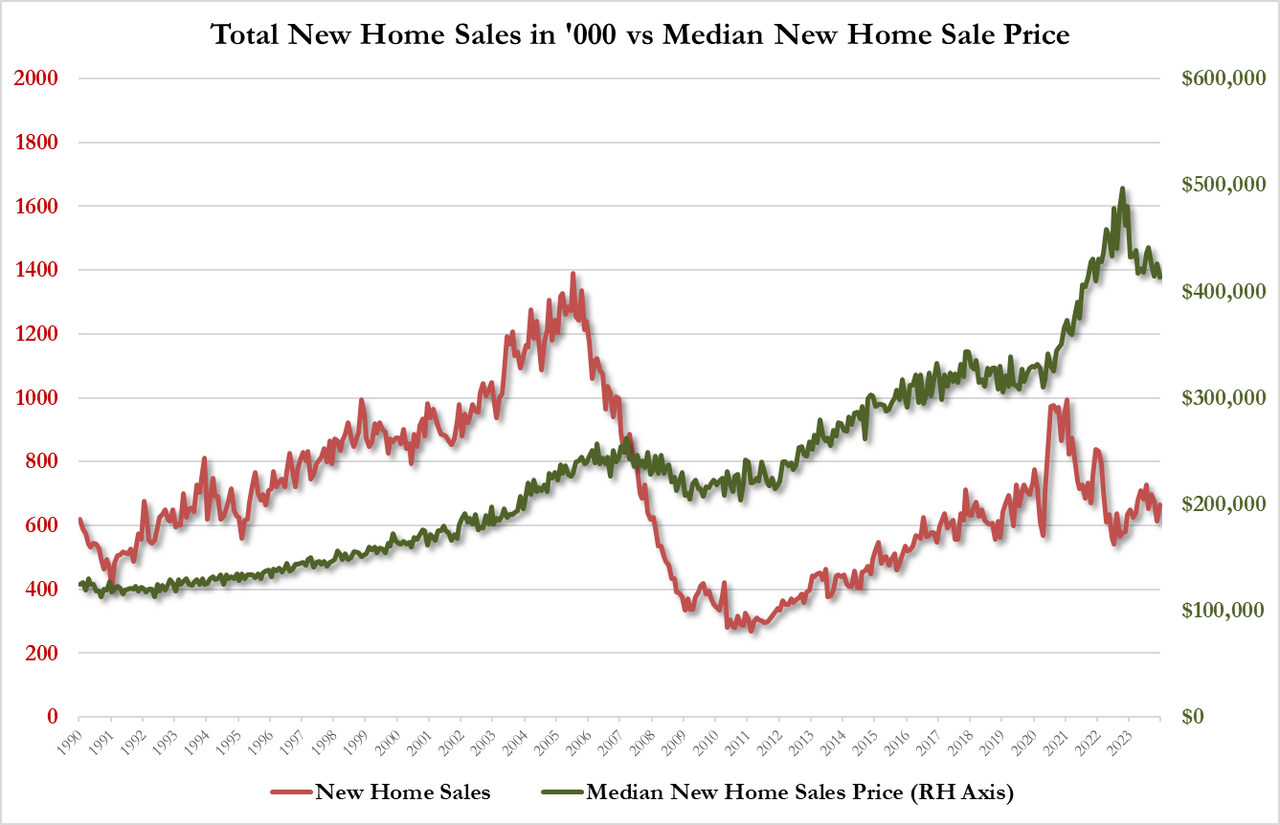
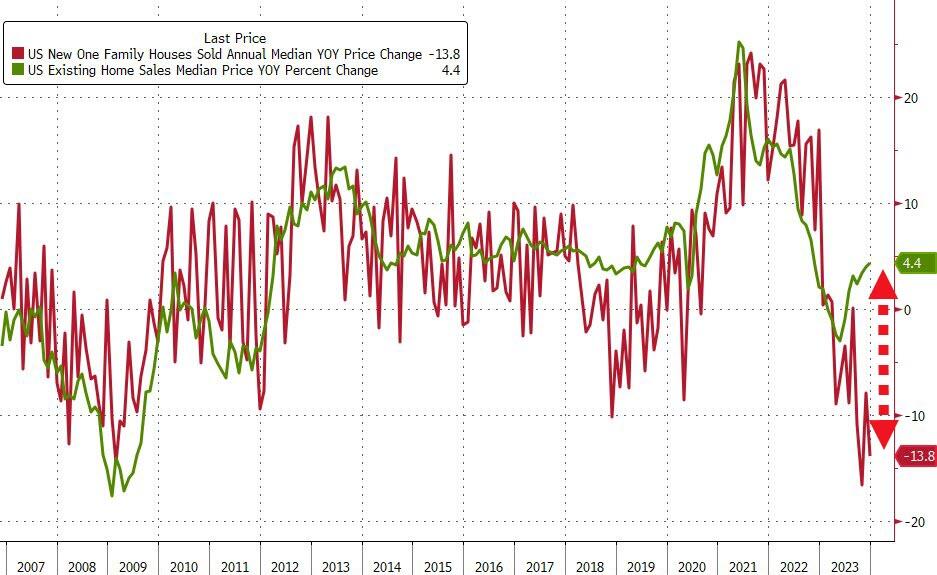
The median new home price fell 13.8% YoY to $413,200
Source: Bloomberg
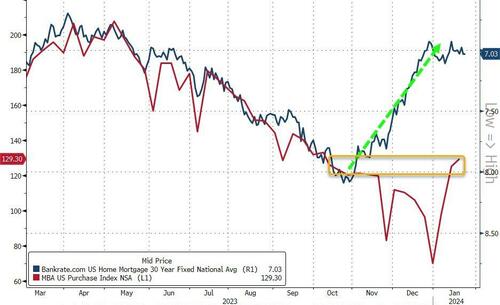
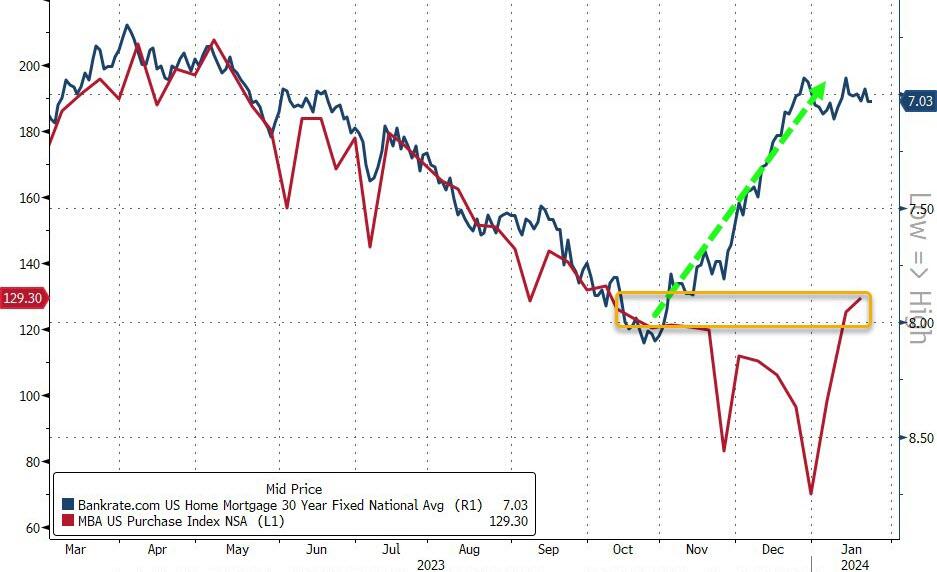
Trouble is, even as mortgage rates have plunged recently, applications for home purchases have only rebounded modestly…
Source: Bloomberg
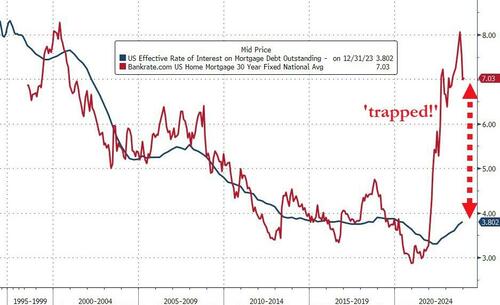
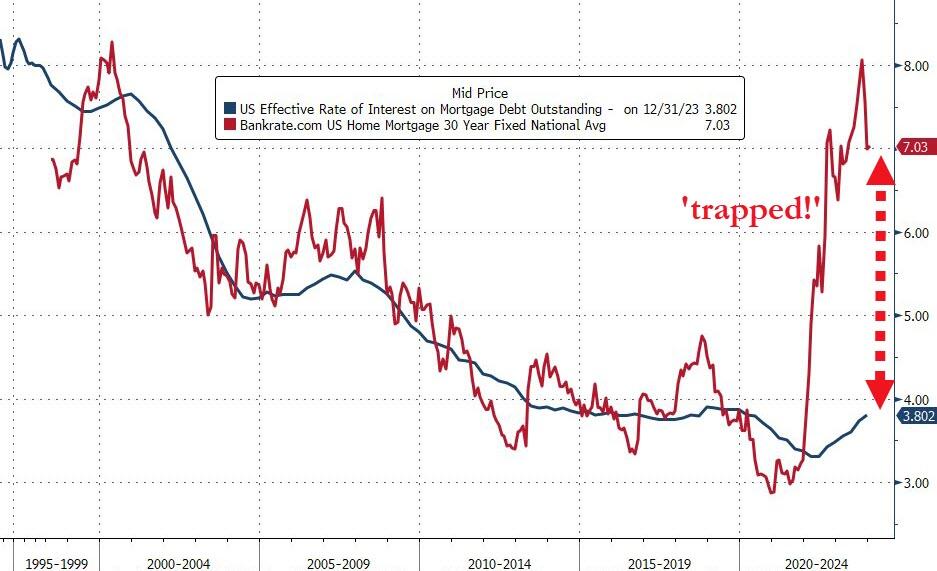
And while mortgage rates have declined (rapidly), they remain massively high relative to the effective mortgage rate for all Americans. That difference is the ‘subsidy‘ that homebuilders have to fill to enable buyers – and it’s still yuuuge!
Source: Bloomberg
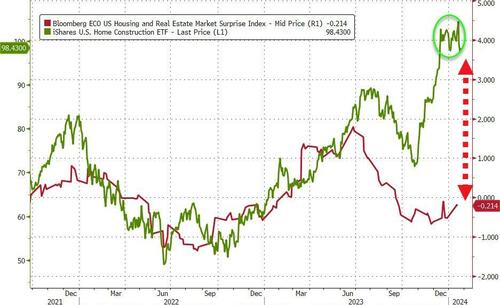
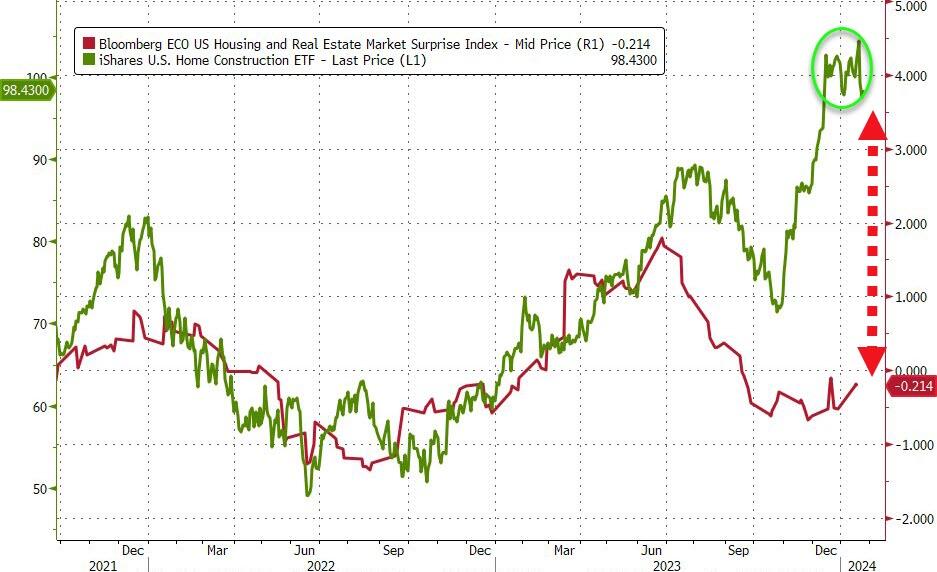
Of course, investors don’t care about actual fundamentals, rates are down so ‘buy buy buy’ the builders…
Source: Bloomberg
Finally, we note that supply shrank from 8.8 months to 8.2 months in December – so don’t expect new home prices to keep falling (they’ll be rising like the supply-constrained existing homes market)…
…and don’t expect The Fed cuts to prompt an excess-supply-driven decline in prices – it’s start your engines time on the next bubble.
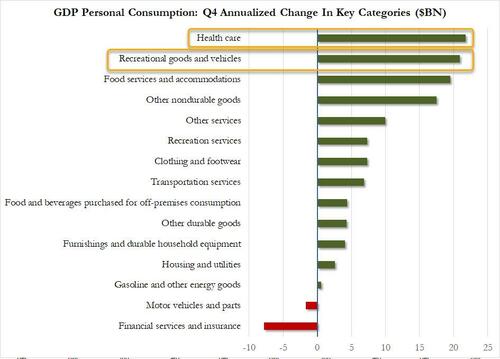
To quote Cousin Eddie from Christmas Vacation, “That there’s an RV.” Recreational goods and vehicles (aka, RVs) were second in Personal Consumption spending after America’s overpriced healthcare.
Spending on RVs makes sense since housing has become unaffordable for millions of households under Bidenomics.
Note that GDP growth was better under Trump (pre-Covid).
The increase in consumer spending reflected increases in both services and goods. Within services, the leading contributors were food services and accommodations as well as health care. Within goods, the leading contributors to the increase were other nondurable goods (led by pharmaceutical products) and recreational goods and vehicles (led by computer software). Within exports, both goods (led by petroleum) and services (led by financial services) increased. The increase in state and local government spending primarily reflected increases in compensation of state and local government employees and investment in structures. The increase in nonresidential fixed investment reflected increases in intellectual property products, structures, and equipment. Within federal government spending, the increase was led by nondefense spending. The increase in inventory investment was led by wholesale trade industries. Within residential fixed investment, the increase reflected an increase in new residential structures that was partly offset by a decrease in brokers’ commissions. Within imports, the increase primarily reflected an increase in services (led by travel).
Compared to the third quarter of 2023, the deceleration in real GDP in the fourth quarter primarily reflected slowdowns in private inventory investment, federal government spending, residential fixed investment, and consumer spending. Imports decelerated.
Current‑dollar GDP increased 4.8 percent at an annual rate, or $328.7 billion, in the fourth quarter to a level of $27.94 trillion. In the third quarter, GDP increased 8.3 percent, or $547.1 billion (tables 1 and 3).
The price index for gross domestic purchases increased 1.9 percent in the fourth quarter, compared with an increase of 2.9 percent in the third quarter (table 4). The personal consumption expenditures (PCE) price index increased 1.7 percent, compared with an increase of 2.6 percent. Excluding food and energy prices, the PCE price index increased 2.0 percent, the same change as the third quarter.
Personal Income
Current-dollar personal income increased $224.8 billion in the fourth quarter, compared with an increase of $196.2 billion in the third quarter. The increase primarily reflected increases in compensation, personal income receipts on assets, and proprietors’ income that were partly offset by a decrease in personal current transfer receipts (table 8).
Disposable personal income increased $211.7 billion, or 4.2 percent, in the fourth quarter, compared with an increase of $143.5 billion, or 2.9 percent, in the third quarter. Real disposable personal income increased 2.5 percent, compared with an increase of 0.3 percent.
Personal saving was $818.9 billion in the fourth quarter, compared with $851.2 billion in the third quarter. The personal saving rate—personal saving as a percentage of disposable personal income—was 4.0 percent in the fourth quarter, compared with 4.2 percent in the third quarter.
GDP for 2023
Real GDP increased 2.5 percent in 2023 (from the 2022 annual level to the 2023 annual level), compared with an increase of 1.9 percent in 2022 (table 1). The increase in real GDP in 2023 primarily reflected increases in consumer spending, nonresidential fixed investment, state and local government spending, exports, and federal government spending that were partly offset by decreases in residential fixed investment and inventory investment. Imports decreased (table 2).
The increase in consumer spending reflected increases in services (led by health care) and goods (led by recreational goods and vehicles). The increase in nonresidential fixed investment reflected increases in structures and intellectual property products. The increase in state and local government spending reflected increases in gross investment in structures and in compensation of state and local government employees. The increase in exports reflected increases in both goods and services. The increase in federal government spending reflected increases in both nondefense and defense spending.
The decrease in residential fixed investment mainly reflected a decrease in new single-family construction as well as brokers’ commissions. The decrease in private inventory investment primarily reflected a decrease in wholesale trade industries. Within imports, the decrease primarily reflected a decrease in goods.
Current-dollar GDP increased 6.3 percent, or $1.61 trillion, in 2023 to a level of $27.36 trillion, compared with an increase of 9.1 percent, or $2.15 trillion, in 2022 (tables 1 and 3).
The price index for gross domestic purchases increased 3.4 percent in 2023, compared with an increase of 6.8 percent in 2022 (table 4). The PCE price index increased 3.7 percent, compared with an increase of 6.5 percent. Excluding food and energy prices, the PCE price index increased 4.1 percent, compared with an increase of 5.2 percent.
Measured from the fourth quarter of 2022 to the fourth quarter of 2023, real GDP increased 3.1 percent during the period (table 6), compared with an increase of 0.7 percent from the fourth quarter of 2021 to the fourth quarter of 2022.
The price index for gross domestic purchases, as measured from the fourth quarter of 2022 to the fourth quarter of 2023, increased 2.4 percent, compared with an increase of 6.2 percent from the fourth quarter of 2021 to the fourth quarter of 2022. The PCE price index increased 2.7 percent, compared with an increase of 5.9 percent. Excluding food and energy, the PCE price index increased 3.2 percent, compared with 5.1 percent.
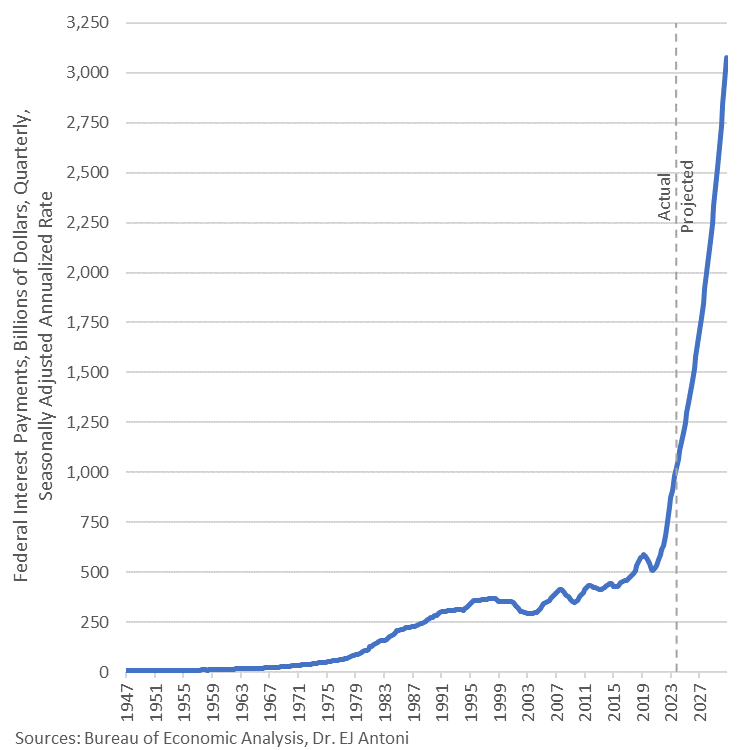
Annualized interest on the federal debt now exceeds $1 trillion and is projected to breach $3 trillion, annualized rate, by Q4 2030.
What can you get for an $834-billion increase in federal debt? Only a $328-billion increase in GDP. This economic “growth” in Q4 ’23 was fueled by gov’t expenditures and gov’t transfers, which in turn are fueled by deficits – sound sustainable?
This is Cousin Eddie’s RV. Cheaper than a house under Bidenomics!
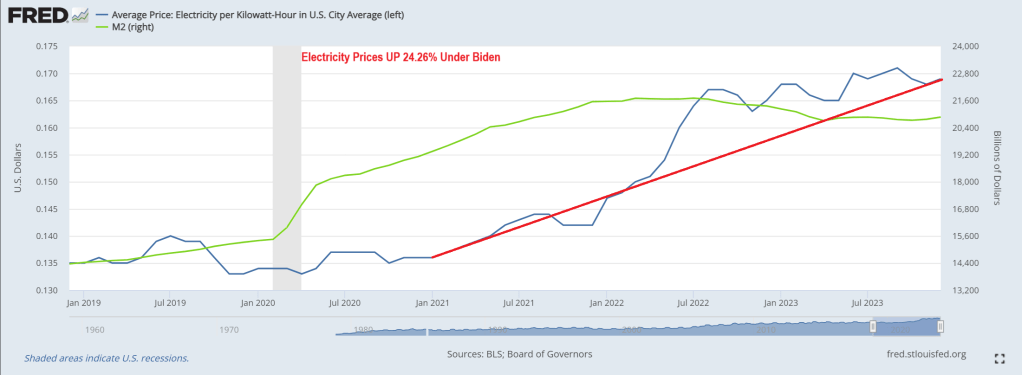
The average price of electricity has risen a whopping 24.25% under Biden and Bidenomics. Brrr!!
No wonder Biden only wants to talk about unlimited abortion and NOT the immigration (Fentanyl, child trafficing, crime, etc) fiasco at the border and continually rising prices. Or Biden’s growing wars.
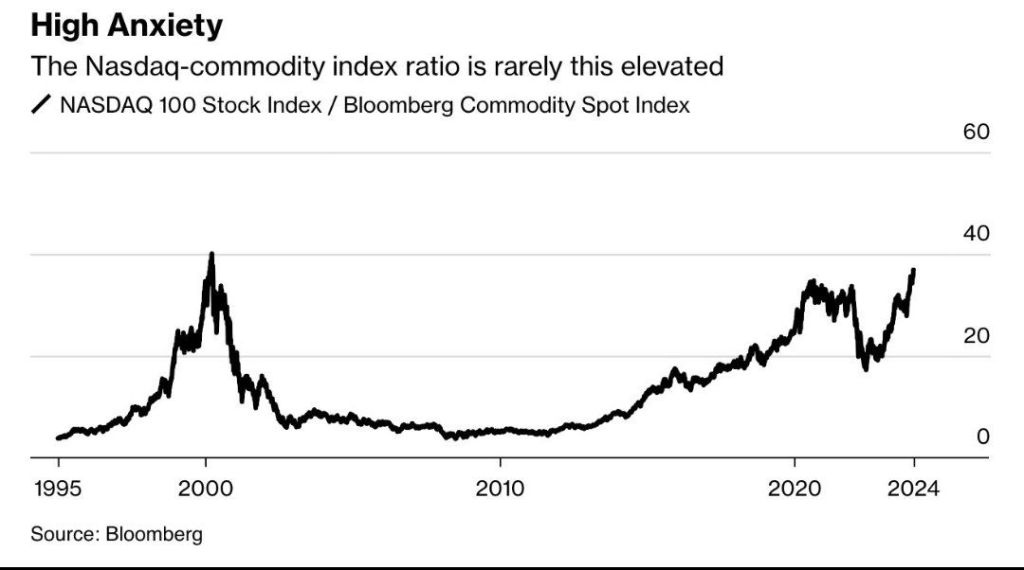
The NASDAQ commodity index RATIO is getting back to dot.com era bubble levels.
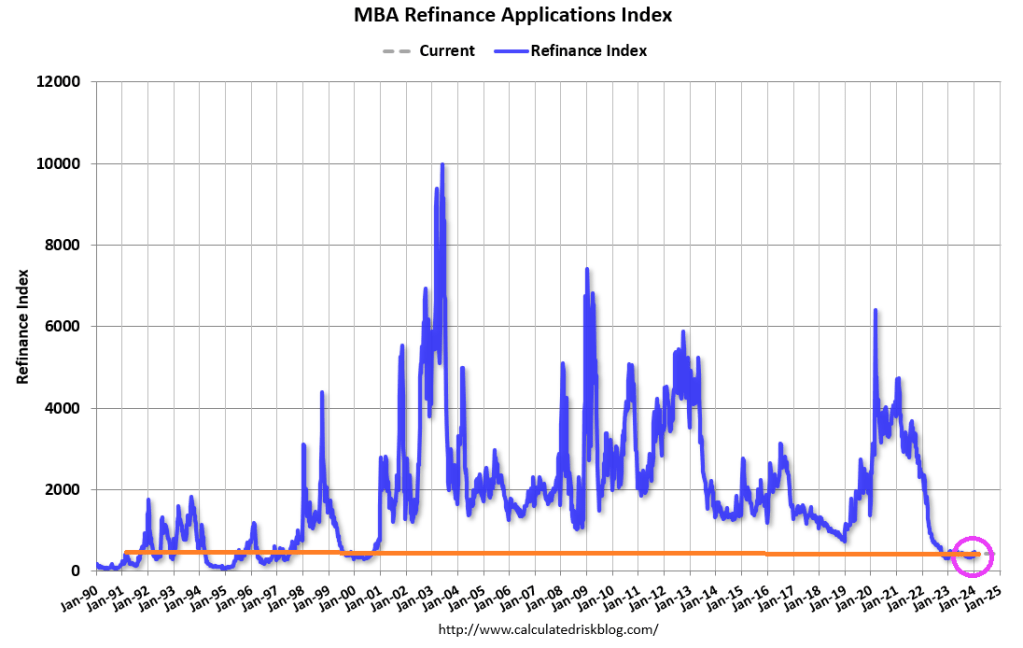
Biden’s green energy mandates, a boondoggle for China and lodestone for Americans, is leaking over to the mortgage market. That’s Bidenomics!
Mortgage applications increased 3.7 percent from one week earlier, according to data from the Mortgage Bankers Association’s (MBA) Weekly Mortgage Applications Survey for the week ending January 19, 2024. The results include an adjustment to account for the MLK holiday.
The Market Composite Index, a measure of mortgage loan application volume, increased 3.7 percent on a seasonally adjusted basis from one week earlier. On an unadjusted basis, the Index decreased 4 percent compared with the previous week. The holiday adjusted Refinance Index decreased 7 percent from the previous week and was 8 percent lower than the same week one year ago. The seasonally adjusted Purchase Index increased 8 percent from one week earlier. The unadjusted Purchase Index increased 3 percent compared with the previous week and was 18 percent lower than the same week one year ago.
The unadjusted Refinance Index decreased 16 percent from the previous week and was 8 percent lower than the same week one year ago.
And, as Nomura’s Charlie McElligott highlights this morning, we are also seeing new upside being bot in SOFR Options for “dovish outcome”-hedging again, with Core PCE looming later this week.The market has had bunches of March SOFR Downside structures trading over the past few weeks to play for “Fed cut overshoot,” which has been the right trade YTD, as the implied probability distribution shows March Fed cuts now having been slashed by over half the the past week and a half (~80% priced to now just ~40%), and accordingly now we’ve witnessed some monetization of tactical Downside in recent days…
And we see the swaption surface getting mushed…
As he notes, the “dovish-trifecta” right-tail repricing has gotten us to ~4900… and, he says, the actual “realization” could then certainly push us through 5000:It’s my expectations that we could very well see:1) “March Fed cut” to pick-up Delta again after what is expected to be a “light” core PCE print this Friday…and taking back pricing following the past week’s Fed speak pushback and “too resilient” Labor- and Consumer- data, which has driven March Fed meeting “cut” probabilities being sliced in half over the past one week (~80% on 1/12/24 to today’s ~40%)The next potential dovish catalyst is 2) the QRA est / announcement end of Jan / start Feb, with “binary risk” implications on the direction of Duration and Risk-Assets, as the market generally anticipates resumption of larger Coupon issuance from the US Treasury ahead—but what if there is one final announcement where Bills stay high, Coupon increases but isn’t as large as most anticipate, AND Yellen signals that this is the final expected Coupon increase?!
While we’re at it and relate to the Treasury’s QRA discussion, let’s not forget the “other” market- and economic- backstop being applied by the Biden Administration (and aided by what looks to be Janet Yellen’s “politically activist” US Treasury with TBAC sign-off) – which is the continued willingness to run large fiscal deficits in an attempt to “run the economy hot” in this election year, with much of it being “paid for” via Bills (so to prevent long-end Rates from pushing higher, which would tighten US financial conditions)……this is Green build, CHIPS Act, and even fresh “election surprises” like Biden announcement Friday on “forgiveness” of a fresh $5B of student loans, now making the total loan forgiveness approved by the Biden admin $136.6B
And finally as a derivative of the above mention, another hypothetical Treasury QRA where we’d see “Bill issuance remaining high, yet with Coupon increases not as large as most anticipate” would then mechnically see MMF’s continuing pulling from RRP to buy Bills, which will further accelerate the RRP drain…and as outlined in recent weeks, “low” RRP levels will act as “a” key input to Fed reaction function on determining LCLoR……which will ultimately mean 3) a pulling-forward on the market’s expected timing on the “end of QT”
This “dovish-trifecta” is the macro catalyst behind the “right-tail” scenario which has appropriately been repriced higher by the market over the course of the past month, and we’ve seen clients allocate some protection spend to this “crash-UP” scenarioAnd again, IF the above were to realize… without negative catalysts (Earnings fine, no further Rates selloff / Fed repricing, continued disinflationary trajectory rebuilds “Fed cut” implied probability) around that upcoming Feb VIXpery with all that Dealer “short VIX Calls” positioning being hedged… there is absolutely potential for an Equities slingshot if there are no issues and those customer “Long VIX Calls” bleed-out, which will mean Dealers puke out their UX1 Longs (as hedges) back into the market for a potential “kicker” to goose Spot Equities even higher…For now, no-one is worried about downside based on VVIX being back near post-COVID lows…
So what then is the largest DOWNSIDE RISK to Equities?
Outside of “Mag 7” guidance disappointments, I believe the next worst-case scenario for current positioning in Stocks would be an “Animal Spirits” US data reacceleration which forces the above “dovish trifecta” off-course and blows-out the recently calming “Fed Rates path” distribution again:Why would resumption of better US growth data negatively impact US Equities consensus thematic / singles positioning?Because after the 4Q23 de-grossing of short books and forced “Net-up” to stop the bleed and chase (massive squeeze & cover in low quality / cyclical value / leveraged balance sheet / high short interest “junk”)….2024 YTD has instead seen the market reset the prior “Momentum” regime of “Long Quality / Size / Secular Growth” i.e. MegaCap Tech, while re-shorting that economically-sensitive “low quality / junk” stuff againIn a world of slowing but positive growth to 2% GDP and now with 3m inflation annualizing sub 2% target…you go back to that “QE of old” 2010s -decade playbook of “long stuff that can grow earnings and profits without needing a hot economic cycle”…i.e. long quality, size (liquid) & secular growth / short leverage & cyclical valueBut IF we see the “animal spirits” data reacceleration off the back of the massive FCI easing that the Fed and Treasury have facilitated, plus the persistent wage growth and still too strong labor meaning consumption remains robust, along with ongoing govt fiscal stim / spending…
.
..we risk a chance of inflation pivoting away from the current disinflationary trajectory(God-forbid actual “reflation”) which would could see that “long secular growth / short econ sensitive / cyclical value’ trade get a shock reversal…
…as long-end Yields and accordingly then, financial conditions, re-tighten and smash the “high valuation” Quality / Secular Growth stuff, while the heavily hated / shorted Cyclicals would painfully squeeze higher.Don’t forget, we’ve seen that happen before (yes we know the magnitudes of the inflationary impulse are different, but the timing of the human-emotion/monetary-policy-over-confidence double-rip in inflation is unquestionable)…
So, be careful what you wish for from higher and higher all-time-highs for stocks – the stronger they look (on the back of dovish expectations), the more likely The Fed is to hold back the actual dovish actions so much hope is founded on.


You must be logged in to post a comment.