1. Everybuddy: 100% of workforce 2. Wisense: 100% of workforce 3. CodeSee: 100% of workforce 4. Twig: 100% of workforce 5. Twitch: 35% of workforce 6. Roomba: 31% of workforce 7. Bumble: 30% of workforce 8. Farfetch: 25% of workforce 9. Away: 25% of workforce 10. Hasbro: 20% of workforce 11. LA Times: 20% of workforce 12. Wint Wealth: 20% of workforce 13. Finder: 17% of workforce 14. Spotify: 17% of workforce 15. Buzzfeed: 16% of workforce 16. Levi’s: 15% of workforce 17. Xerox: 15% of workforce 18. Qualtrics: 14% of workforce 19. Wayfair: 13% of workforce 20. Duolingo: 10% of workforce 21. Rivian: 10% of workforce 22. Washington Post: 10% of workforce 23. Snap: 10% of workforce 24. eBay: 9% of workforce 25. Sony Interactive: 8% of workforce 26. Expedia: 8% of workforce 27. Business Insider: 8% of workforce 28. Instacart: 7% of workforce 29. Paypal: 7% of workforce 30. Okta: 7% of workforce 31. Charles Schwab: 6% of workforce 32. Docusign: 6% of workforce 33. Riskified: 6% of workforce 34. EA: 5% of workforce 35. Motional: 5% of workforce 36. Mozilla: 5% of workforce 37. Vacasa: 5% of workforce 38. CISCO: 5% of workforce 39. UPS: 2% of workforce 40. Nike: 2% of workforce 41. Blackrock: 3% of workforce 42. Paramount: 3% of workforce 43. Citigroup: 20,000 employees 44. ThyssenKrupp: 5,000 employees 45. Best Buy: 3,500 employees 46. Barry Callebaut: 2,500 employees 47. Outback Steakhouse: 1,000 48. Northrop Grumman: 1,000 employees 49. Pixar: 1,300 employees 50. Perrigo: 500 employees
But, according to the government-supplied data…
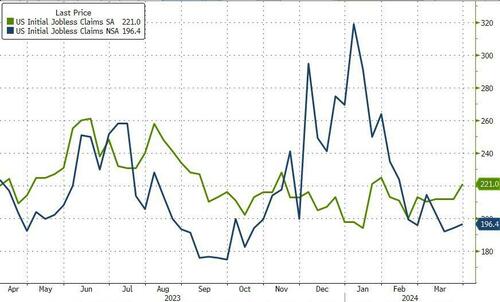
The number of Americans filing for jobless benefits for the first time last week rose from 212k to 221k (SA) to its highest since Jan, and claims ticked modestly higher on an NSA basis…
Source: Bloomberg
Continuing claims remain glued around 1.8mm Americans – where they have been for nine months…
Source: Bloomberg
But, here’s the thing… WARNs are soaring… and Challenger-Grey just announced that March saw the most job cuts (90,309) since January 2023…but government-supplied data on initial jobless claims continues to smoothly tick along near record lows…
Source: Bloomberg
The WARN data is very disturbing.
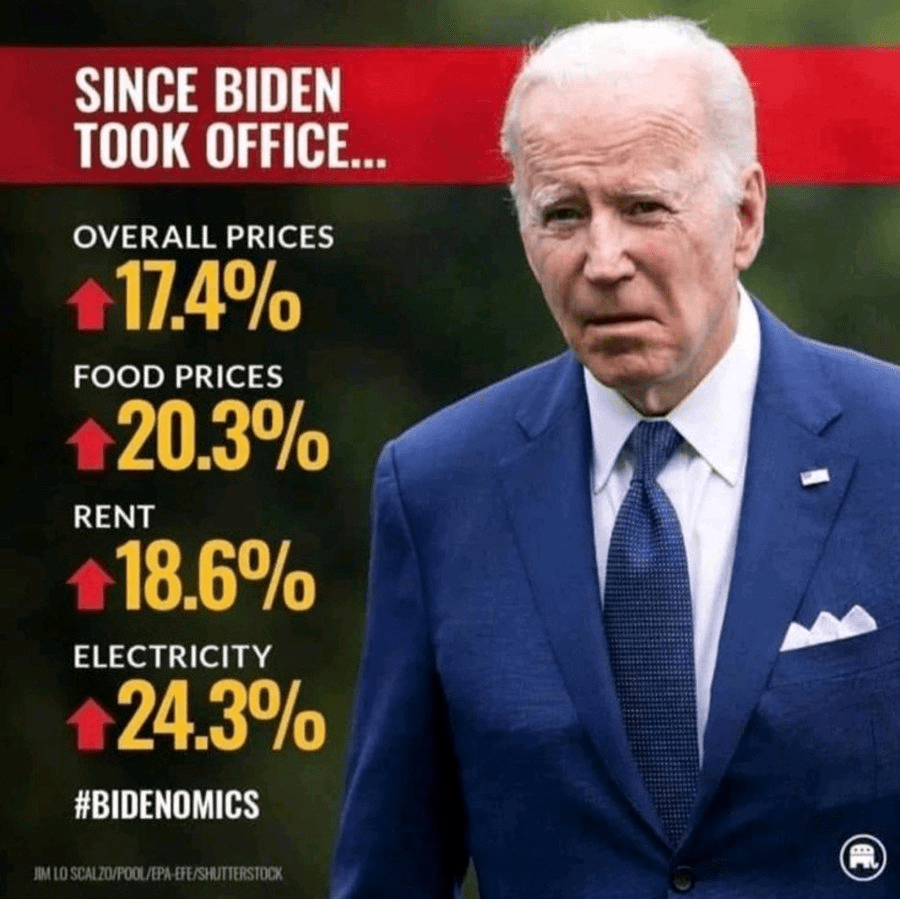
Ah, Bidenomics!!
If Trump wins in November, will all this data suddenly be ‘allowed’ to reflect reality?
But the feral pigs are already here in Washington DC as elected representative and non-elected bureaucrats.
Bidenomics is really about insane money printing after Covid and the installation of Biden as President. Biden and The Federal Reserve are both pushin’ too hard. Biden to fundamentally change the US and The Fed trying to cope with the inflation reaction. With Covid and then Biden’s selection as President, Federal outlays exploded (blue line) and remain elevated under Biden. To help finance the (outrageous) spending The Federal Reserve massively increased the M2 Money supply (green line). Now, The Fed has withdrawn some of the excessive monetary stimulus, but there is a staggering amount monetary stimulus still swimming around the economy like a Great White Shark.
The problem with Federal policies (energy, government spending, government debt) is that there are unpredictable factors that undo the best laid plans of mice and men. And rats such as crop blights and changes in consumer habits.
A good example is the Strategic Petroleum Reserve, which can be drained if craven politicians want to manage oil and gasoline prices for political purposes. Unfortunately, the promise of replenishment is made difficult by rising crude oil prices. The Biden admin cancels plan to refill emergency oil reserve amid high prices (some caused by factors such as war, often caused by government).
In fact, spot crude is up 73% under Biden. Partly, because of Biden’s promised war on fossil fuels and international disasters like war, blights, etc. This is why I cringe when I hear politicians and “economists” discuss why inflation will fall.
On the food side, we have cocoa prices rising 136% under Biden. Again, not predictable when policies were being made. Combine crop blights were rising transportation costs and DC, we have a problem! But this is one reason why The Fed, etc, focus on core inflation (excluding energy and food prices).
There are many examples of rising prices and how they hurt consumers, particularly middle-class and low wage workers.
How did The Federal Reserve react to the inflation Biden helped create? They raised The Fed Funds Target Rate (Upper Bound) by 2,100% to combat Bidenflation. Freddie Mac’s 30-year mortgage rate is up 156% helping to crush homeownership aspiration for younger households.
And then we have Congress/Biden shoveling more than $10 billion in subsidies to Intel, even though Intel has an incentive to develop chips using borrowed funds and Intel retained earnings. But why put your shareholders at risk in case the chip gamble doesn’t payoff. Just shift the risk to US taxpayers!
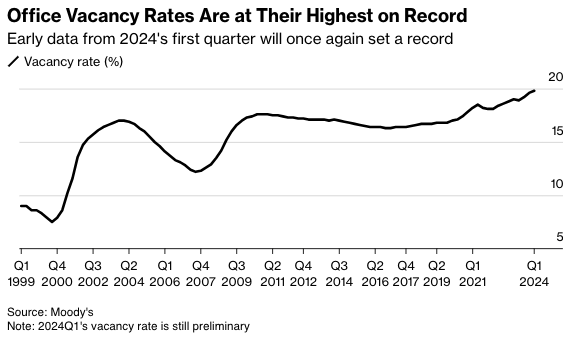
The rising supply of office space is due to a combination of surging remote and hybrid work that forces companies to reduce corporate footprints. Also, companies are exiting imploding progressive cities and high-taxed blue states for red ones while downsizing space. In the report, office tower vacancies rose to a record 19.8%, up from 19.6% in the fourth quarter of 2023.
Even with the increase, there is an eerily calm across the commercial real estate sector. This comes as the Federal Reserve’s interest rate hiking cycle is higher for longer, indicating that the pain train is nearing (perhaps after the presidential election).
“The office stress isn’t quite done yet,” Thomas LaSalvia, Moody’s head of commercial real estate economics and one of the authors of the report, told Bloomberg in an interview. He noted recent positive economic indicators stave off a “perfect storm in the office sector.”
“There are spots of light and there are spots of extreme darkness,” LaSalvia said, adding, “This is part of a longer-term evolution where we are seeing obsolete buildings in obsolete neighborhoods.”
The high office vacancy rate continues to be terrible news for landlords and developers eager to fill their buildings, and the Fed’s hiking cycle has made refinancing very challenging.
Viswanathan said there have been no major fireworks in CRE tower debt because the debt is being “extended and modified rather than refinanced,” which “mitigates a default wave and a sharp pick-up in losses on CRE loan portfolios.”
Yes, both residential and commercial real estate are thunderstruck under Bidenomics.
Mortgage applications decreased 0.6 percent from one week earlier, according to data from the Mortgage Bankers Association’s (MBA) Weekly Mortgage Applications Survey for the week ending March 29, 2024.
The Market Composite Index, a measure of mortgage loan application volume, decreased 0.6 percent on a seasonally adjusted basis from one week earlier. On an unadjusted basis, the Index decreased 0.1 percent compared with the previous week. The seasonally adjusted Purchase Index decreased 0.1 percent from one week earlier. The unadjusted Purchase Index increased 1 percent compared with the previous week and was 13 percent lower than the same week one year ago.
The Refinance Index decreased 2 percent from the previous week and was 5 percent lower than the same week one year ago.
What a mess! With M2 Money up 8.4% under Biden (green line), home prices are up a staggering 39.2% under Sheriff Joe and his deputy Fed chair Jerome Powell.
And conforming mortgage rates (30Y) are up 148% under Biden’s Reign of Error.
Thanks O’Biden! Although Biden is the figurehead, Obama and his team are still running The White House. Regardess of whether it is Biden or Obama (or Soros/World Economic Forum) calling the shots, the US housing market is on a highway to hell.
Bidenomics “helping” the middle class and low wage workers.
The staggering amount of Fed money printing combined with insane, reckless spending by The Federal government (hereafter called The Feral Government) has caused massive distortion in the US economy.
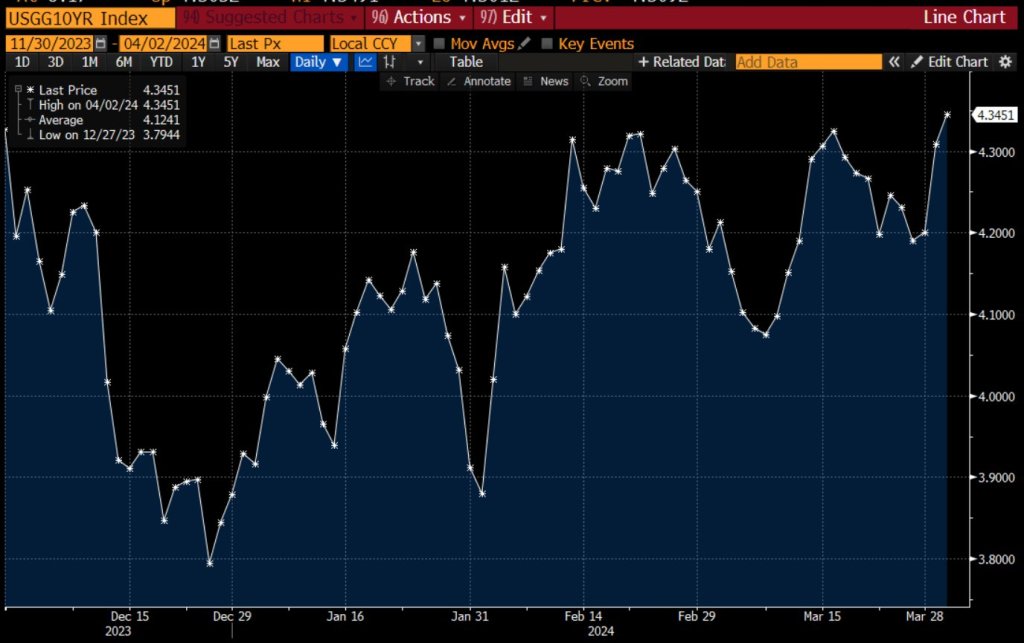
Second, the US Treasury 10-year yield is up tp 4.35%, the highest in 2024.
Third, with the 10-year Treasury rising towards 5%, watch for the 30-year mortgage rate to rise AGAIN making housing even more unaffordable. Or as Robert Palmer almost sang, Simply Unaffordable. Today, the 30-year mortgage rate is 7.567%. Look for it to climb to over 8% very soon.
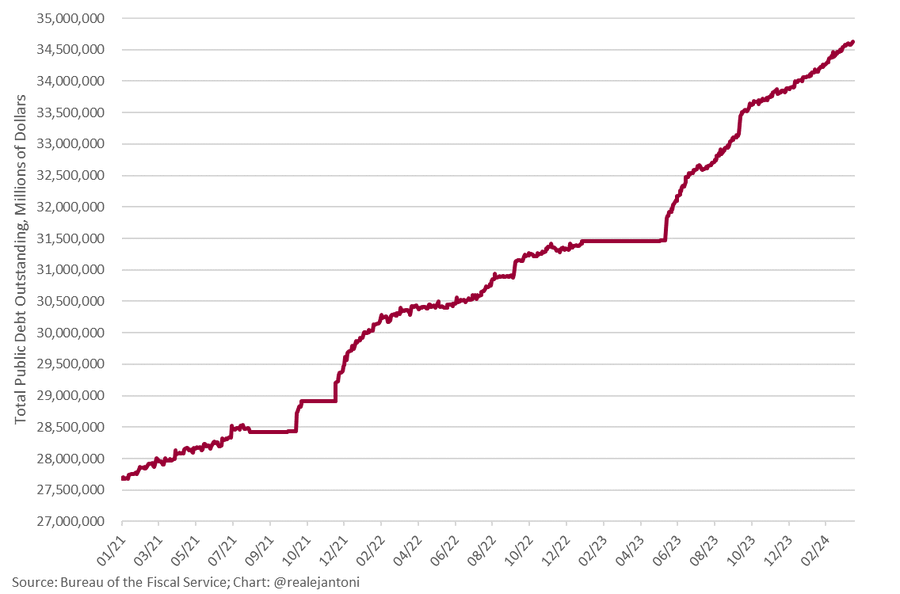
Fourth, BOOM: federal debt explodes $41 billion higher yesterday, breaching $34.6 trillion for first time ever; we’re on track to borrow $2.9 trillion this fiscal year – how long before the bond vigilantes have to remind everyone just how much power they have?
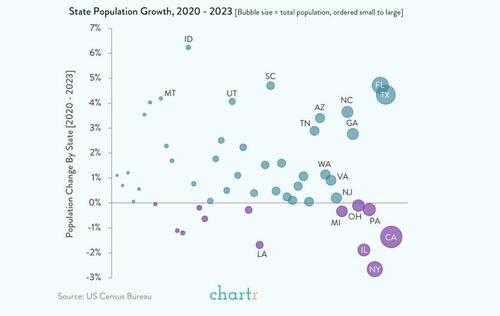
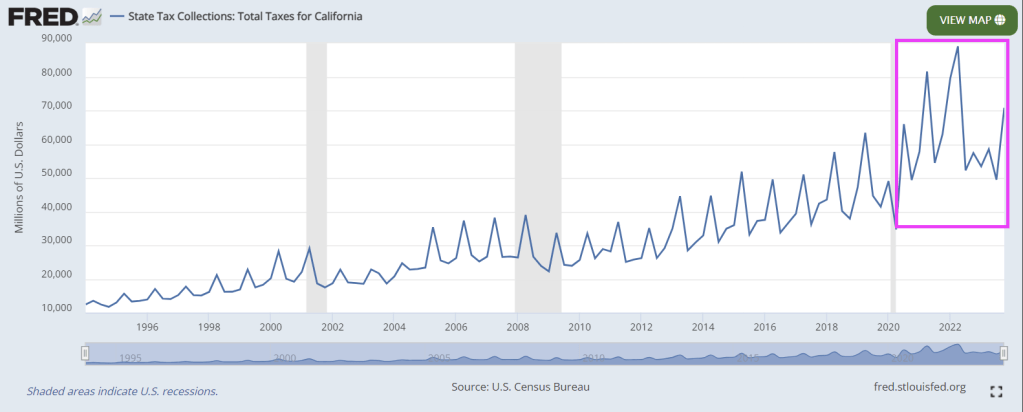
There is gold in them thar hills in California. And politicians like Gavin Newsom (aka, Pond Scum) not only spend all their cash available from (ruinous) taxes, but also spend like drunken miners and run up massive deficits and debts.
Governor Gavin Newsom bragged of a surplus, but California is seriously underwater. The next recession will hit the state extremely hard.
California’s total state and local government debt now stands at almost $1.6 trillion, or about half the state’s GDP.
That isn’t an alarming ratio when compared to the national debt, which has now soared to 128 percent of U.S. GDP with no end in sight. But Californians carry this $1.6 trillion state and local debt ($40,000 per capita) in addition to their share of the national debt (about $90,000 per capita).
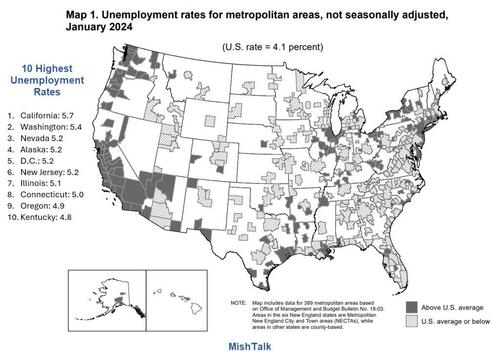
Unsurprisingly, California has the highest unemployment rate in the nation at 5.7 percent vs. 4.1 percent nationally.
A Booming Economy?
California has massive problems although the stock market is at a record high and the economy is allegedly booming. The next recession will hit California exceptionally hard, and it’s not too far off.
But thanks to Newsom’s Presidential ambitions (God help us!), along with virtually psychopathic state legislators, California has been tax crazy (particularly in 2022). This has helped to drive a demoralized middle class to Arizona, Texas, Nevada and other lower tax states.
And then we have California’s fast food minumum wage disaster, causing closing of small, family-owned restaurants. And causing massive layoffs in the fast food industry and probably leading to an AI takeover of corporate resturants (I remember taking my poor wife to Olive Garden and I refused to use to electronic ordering system and demanded a real waiter to serve us. The waiter told us that nobody liked the electronic ordering system).
While not the only guilty party, Newsom is a leader … in bankrupting California with his budgetary fantasies and Presidential aspirations.
I am surprised that Newsom hasn’t used the themesong from Jim Bowie as his themesong.
Happy Easter! I mean Happy TRADITIONAL Easter, not a Biden weird trans celebration.
Biden and Congress (Schumer, Johnson, McConnell, etc) spend and borrow like its cottage cheese.
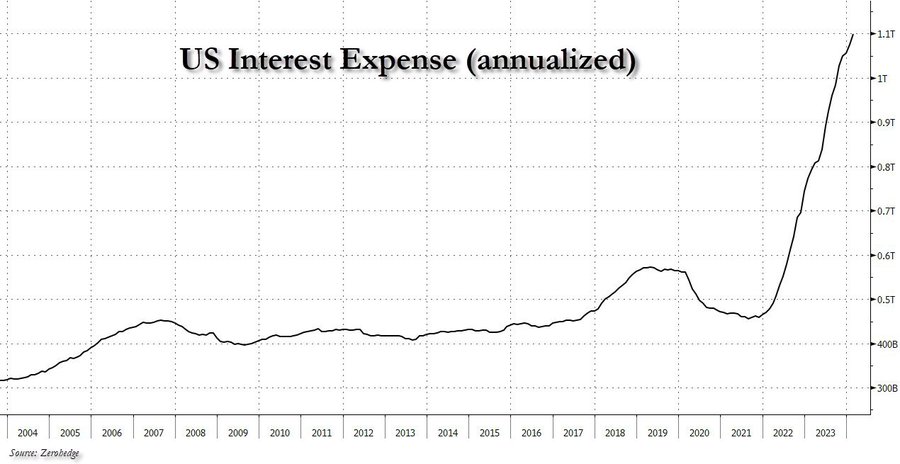
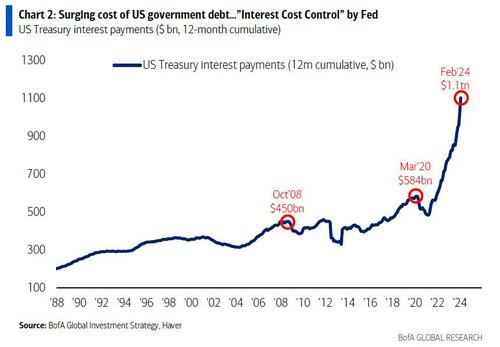
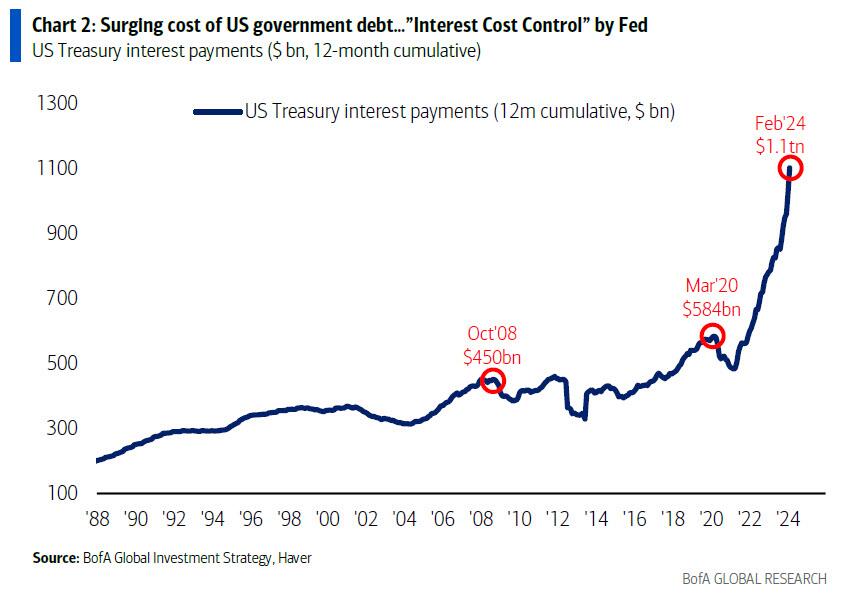
After hitting $1 trillion in late 2023, interest expense on US debt rose to a record $1.1 trillion in late March, and ii) while US debt is now rising at a pace of $1 trillion every 3 months, US interest expense is rising at a just as torrid $100 billion every 4 months (this interval will also shrink to three months very soon).
he Biggest Picture: $1.1tn in interest payments on US government debt past 12 months, doubled since COVID (Chart 2); trend in govt spending (up 9% YoY) & debt (up $1.0tn every 100 days)…big motivation for Fed to cut rates to constrain surge in interest costs (“ICC” or Interest Cost Control policy)… bear in bonds (if no recession), steeper yield curve, weaker US$, higher commodities/gold/crypto & TINA for stocks.
Of course, since Hartnett is one of those good strategists where one fact opens up a cascade of downstream observations, that’s precisely what happened this time and he fills out the balance of his latest report (available to pro subscribers in the usual place) with his tongue-in-cheek notes on why the US is on a doomsday date with a debtdisaster, starting with why being a “dove means never having to say you’re sorry”:
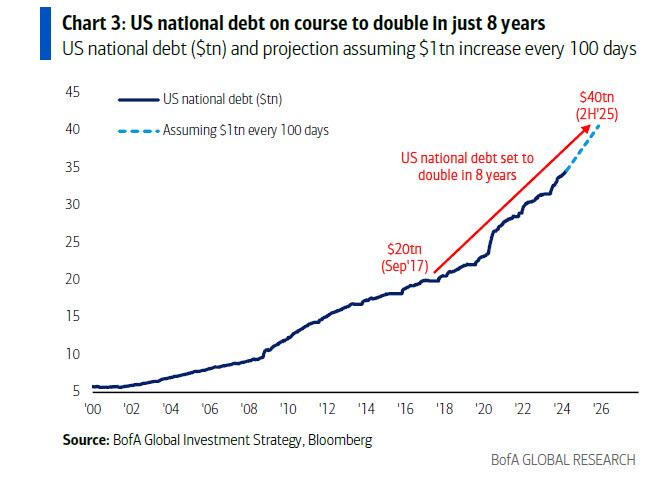
US government spending past 5 months = $2.7tn, up 9% YoY… on course for $6.7tn in FY24; US national debt rising $1tn every 100 days…set to hit $35tn in May’24, $37tn by US election, $40tn in H2’25 (doubling in 8 years); spending up, deficits up (9% of GDP average past 4 years), debt up -> interest payments up = $1.1tn in past 12 months & set to rise by $150bn in next 100 days[ZH: this sounds familiar]
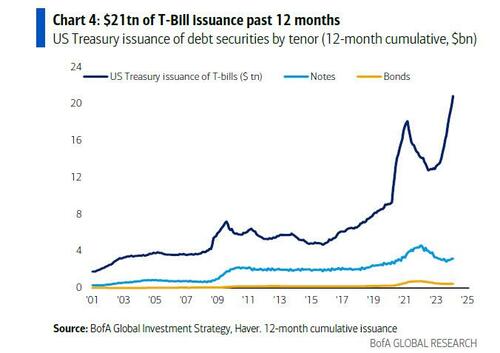
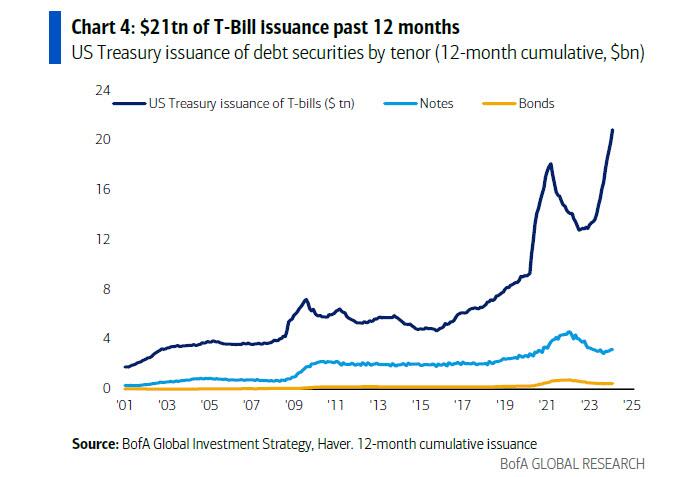
US Treasury has aggressively shifted refunding toward <1-year T-Bills ($21tn issuance past 12 months), lowering maturity of debt to ≈5 years, increasing sensitivity to short rates, incentivizing Fed to cut rates;
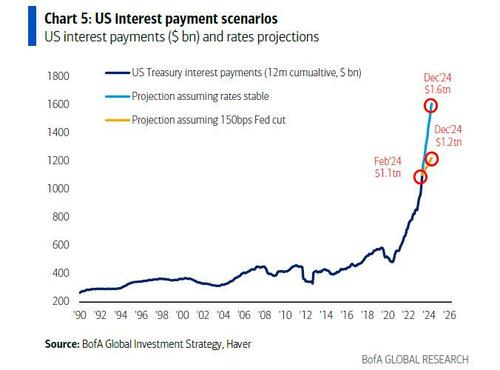
And the punchline: Hartnett takes our observations, and expands them to their logical, if absurd, extreme (which ironically takes places in just 9 months) to find that US annual interest costs are set to jump from $1.1 trillion to $1.6 trillion, which is a big deal…
Unchanged rates/yields & debt trend next 12 months & US refinancing rate is 4.4% & annual interest costs jump from $1.1tn to $1.6tn (Chart 5); in contrast 150bps of Fed cuts next 12 months and average refi rate is 3.2%, stabilizing/constraining interest payments to $1.2-1.3tn over next 2 years; call it “ICC”/Interest Cost Control but Fed must placate fiscal excess coming quarters…bear in bonds (if no recession), steeper yield curve, weaker US$, higher commodities/gold/crypto & TINA for stocks.
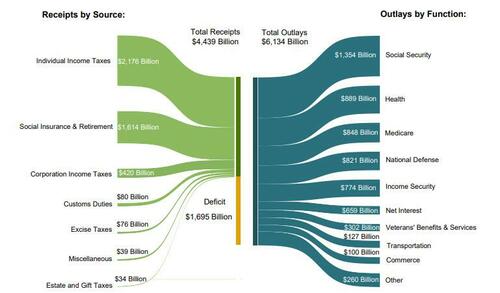
… because if the Fed does not cut rate by 150bps (as it may in an “ICC” scenario) should inflation prove to be sticky (something which Putin clearly has figured out realizing the fate of Biden’s re-election is in his oily hands), and total interest does rise to $1.6 trillion by year-end, that it will become the single biggest US government outlay by the end of the fiscal year; as a reminder, in fiscal 2023, Social Security spending was $1.354 trillion, Health was $889 billion, Medicare $848 and national defense, a paltry (by comparison) $821 billion.
Stepping briefly away from the looming US debt disaster, Hartnett makes three more observations on the current state of the market:
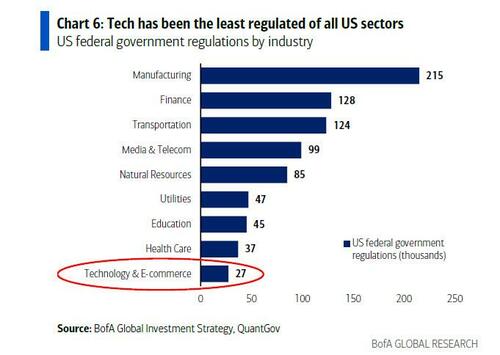
Tech regulation getting noisier: DoJ vs Apple antitrust lawsuit, FTC vs Amazon antitrust lawsuit, FTC inquiry into AI deals of Amazon, Google, Microsoft; EU investigation into Apple, Meta, Google breach of Digital Markets Act; EU $2bn Apple antitrust fine, Japan FTC Apple & Google antitrust complaint et al…
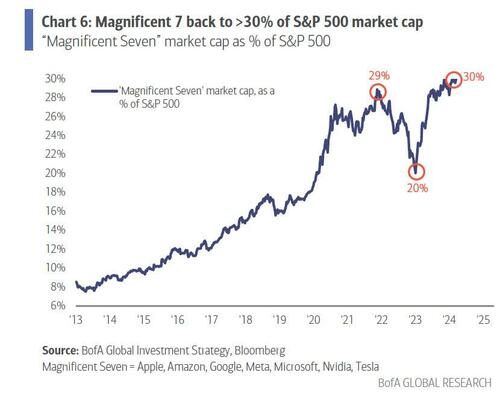
“Magnificent 7” = 30% of SPX index & 60% of SPX gains past 12 months…investors love big tech “moats”, monopolistic ability to protect margins, market share, pricing power, finance & control AI arms race; but ≈$2tn of Magnificent 7 revenues past 12 months tempting target for regulators/governments struggling to pay bills;
Note tech historically the least regulated of sectors (the chart below uses data from 2017) and in past 12 months average tax rate of “Magnificent 7” was 15% vs 21% for rest of S&P 500… and regulation & rates the historic way sector bulls & bubbles end.
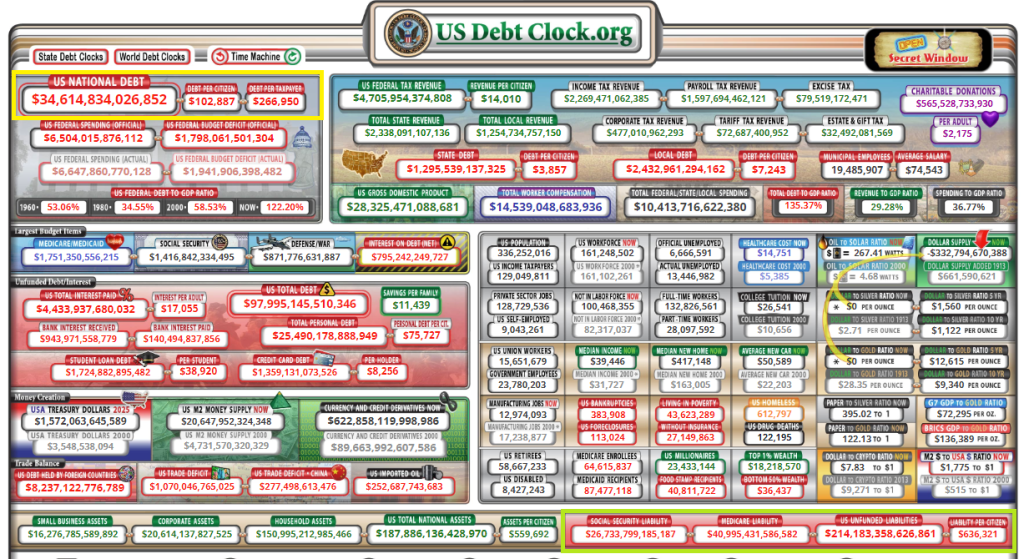
Now for the REALLY bad news. Unfunded liabilities (entitlements) have hit $214+ TRILLION. Given how voters hate paying more in taxes, look for the growing entitlements to add AT LEAST $214 trillion in NEW DEBT which will result in record high interest payments.
Hey big spender! How about NOT spending trilliions while pocketing 10% from foreign enemies?
Congress and The Biden Regime should select the now defunct British beer Watney’s Red Barrell (a truly awful beer) to symbolize their committment (or lack thereof) to fiscal responsibilty.
Jerome Powell and The Federal Reserve have to make a decision about tightening monetary policy or loosening it. It’s a Presidential election year and The Fed will probably do what is necessary to support The Biden Administration’s re-election. But let’s look at the various conflicting economic indicators that are causing confusion at The Fed.
First, the Federal Reserve’s preferred gauge of inflation wasn’t hotter than expected in February, which could keep a mid year interest rate cut on the table.
The year-over-year change in the so-called “core” Personal Consumption Expenditures index — which excludes volatile food and energy prices — clocked in at 2.8% for the month of February.
That was in line with economist expectations and down from 2.9% in January. Core prices rose 0.3% from January to February, which was also in line with expectations and down from 0.5% in the previous month.
The new PCE reading could be an encouraging development to some Fed officials who raised questions in recent months about the persistence of inflation after some hotter-than-expected numbers at the start of 2024.
“Core services inflation is slowing and will likely continue throughout the year,” Jeffrey Roach, chief economist for LPL Financial, said in a note.
“By the time the Fed meets in June, the data should be convincing enough for them to commence its rate normalization process. But where we sit today, markets need to have the same patience the Fed is exhibiting.”
Some Fed officials have been cautioning investors to be patient about the pace of rate cuts.
Fourth, on the housing front, the 30-year mortgage rate is up 156% under Biden’s Reign of Error. Rate cuts would be helpful for reducing mortgage rates.
Fifth, commercial real estate. The NBER states that approximately 44% of office loans may have negative equity. They estimate that a 10% to 20% default rate on commercial real estate (CRE) loans, similar to levels seen during the Great Recession, could result in additional bank losses of $80 to $160 billion. They emphasize the impact of interest rates, noting that none of these loans would default if rates returned to early 2022 levels. With around $1 trillion in maturing CRE loans this year, higher interest rates could lead to challenges in refinancing, especially for office spaces facing high vacancy rates and declining valuations.
Finally, we have Citi’s economic surprise index (blue line) which is positive at 30.70 despite The Fed already having raised their target to the highest level since 2000 before the Iraq War/9-11 recession.
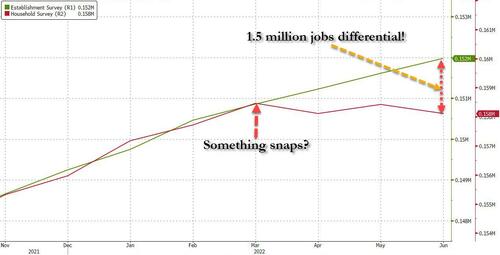
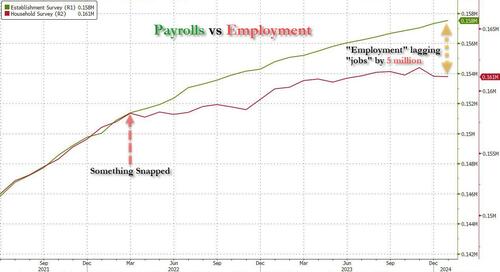
Something has snapped in the labor market: that’s when a staggering discrepancy emerged between the number of Payrolls (as measured by the BLS’ Establishment Survey, a far more crude and imprecise, yet much more market-moving data series), and the number of actual Employed Workers (as measured by the BLS’ far more accurate Household Survey). As we showed at the time, after the two series had tracked each other tick for tick, a gap opened in March 2022 which quickly grew to 1.5 million jobs in just 3 months…
… and has since exploded to a whopping gap of 5 million “jobs” that apparently do not exist.
And while some of this discrepancy could be explained with the record surge in multiple jobholders, which increased by 1 million since March 2022 to an all time high of 8.6 million at the end of 2023 (as a reminder, the Establishment Survey counts 1 worker have 2 or 3 (or more) multiple jobs as, well, 2 or 3 (or more) separate jobs, even if it is just one worker trying to make ends meet under the roaring inflation of Bidenomics), most of the gap remained unexplained.
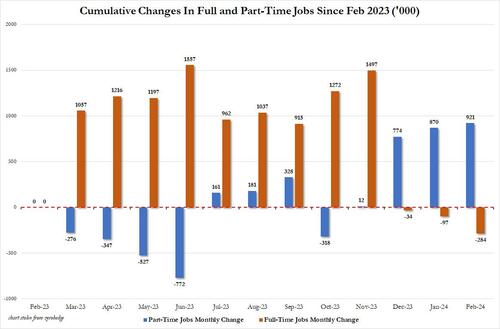
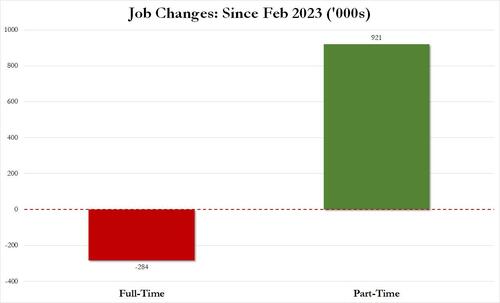
There was more: it was around the summer of 2022 that the Biden labor department – in its zeal to show job growth no matter the cost, or quality of jobs – also started fooling around with the composition of the labor market, with most of the monthly gains going to part-time workers, even as full-time workers stagnated or declined. The culmination, as we reported earlier this month, is that in February 2024, the US had 132.9 million full-time jobs and 27.9 million part-time jobs. Which is great… until you look back one year and find that in February 2023 the US had 133.2 million full-time jobs, or more than it does one year later! And yes, all the job growth since then has been in part-time jobs, which have increased by 921K since February 2023 (from 27.020 million to 27.941 million).
In other words, starting in 2022 and accelerating to present days, less and less full-time jobs were added, until we got to the absurd situation that all the new jobs in the past year have been part-time jobs!
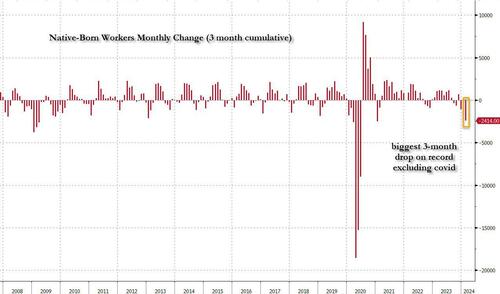
And then there was, of course, the great jobs replacement theory, only as we first showed well over a year ago, it wasn’t a theory but practice, and following countless months in which native-born workers lost their jobs, including a near-record 3-month plunge to start 2024…
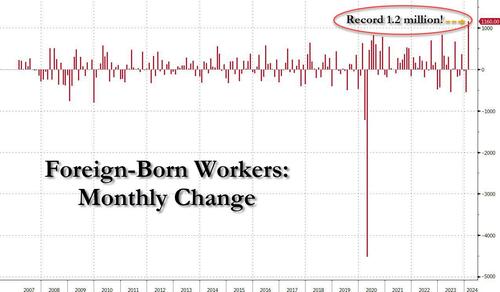
… offset by a record 1.2 million foreign-born (read immigrants, both legal and illegal but mostly illegal) workers added in February…
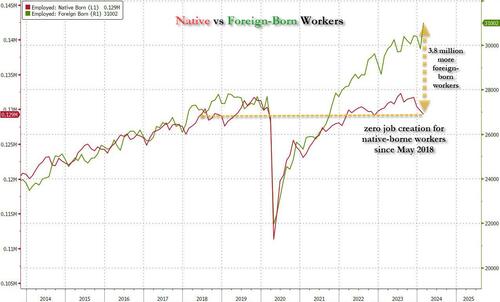
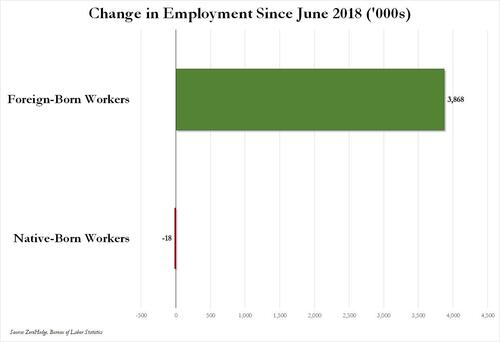
Or, as we first pointed out several months ago, not only has all job creation in the past 6 years – since May 2018 – has been exclusively for foreign-born workers…
… but there has been zero job-creation for native born workers since June 2018!
Ok fine, but all of the above are really just example of the Biden admin Labor Department playing around with statistics and trying (and succeeding) to fool the greatest number of people. There is really nothing about outright data rigging and fabrication… and also while we realize that the Household survey shows a far uglier labor market – one where part-time jobs, illegal immigrants, and multiple jobholders dominate – what about the Establishment survey, which is behind the actual payrolls number, the only number that matters as far as the market is concerned?
All good points, and to address them, we first have to go back to December 2022, when it reported something shocking: as part of its data analysis of the “more comprehensive, accurate job estimates released by the BLS as part of its Quarterly Census of Employment and Wages (QCEW) program“, the Philadelphia Fed found that the BLS had overstated jobs to the tune of 1.1 million! This is what the Philadelphia Fed wrote in its quarterly Early Benchmark Revision of State Payroll Employment report at the time:
Our estimates incorporate more comprehensive, accurate job estimates released by the BLS as part of its Quarterly Census of Employment and Wages (QCEW) program to augment the sample data from the BLS’s CES that are issued monthly on a timely basis. All percentage change calculations are expressed as annualized rates. Read more about our methodology. Learn more about interpreting our early benchmark estimates.
So what did this “more accurate”, “more comprehensive” report find? It found that…
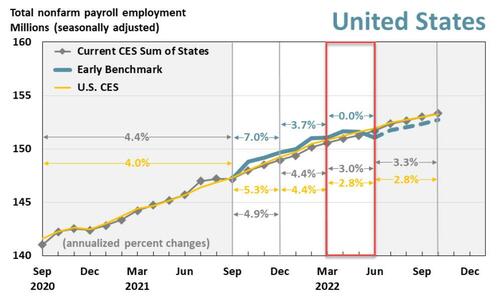
In the aggregate, 10,500 net new jobs were added during the period rather than the 1,121,500 jobs estimated by the sum of the states; the U.S. CES estimated net growth of 1,047,000 jobs for the period.
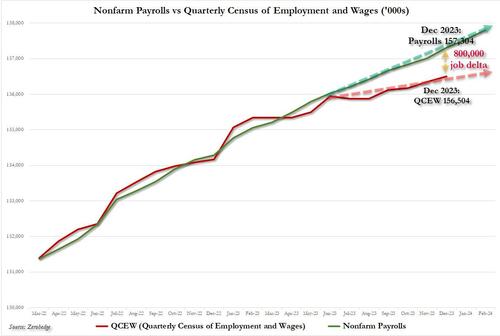
This is shown graphically in the chart below: specifically, the analysis looks at the quarter in the red box, where the green line, or the more accurate “early benchmark” revision of official data, dipped decidedly below the CES trendline (i.e., the nonfarm payrolls).
Alas, since the far more accurate Quarterly Census of Employment and Wages (QCEW) numbers would not be actually incorporated into BLS benchmarks for well over a year after we wrote our analysis in Dec 2022, neither we nor the market would know just how manipulated the data was until early 2024. Which, of course, is now, and as we already know, the BLS had been consistently downward revising virtually all initial job prints in 2023 (ten of the eleven jobs reports heading into Dec 2023 were revised lower) to make the economy more realistic but only in retrospect…
… however, even though we do know now that the jobs data in 2022 was far weaker than anyone thought at the time, nobody really cares: after all there are part-time jobs and illegal immigrants to plug any and all historical holes, plus we are talking about ancient history.
Plus, we have all those great recent jobs reports to fall back on: the ones that confirm that Bidenomics is doing such a great job.
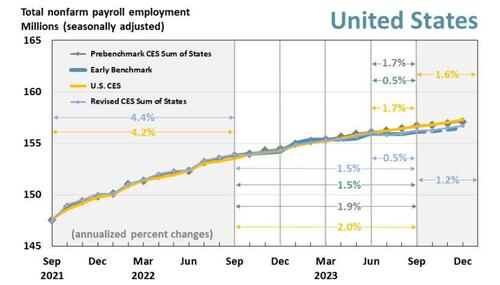
Only… that’s not true either.Presenting Exhibit A: the latest Philadelphia Fed quarterly report on Early Benchmark Revisions of State Payroll Employment. It shows that once again, the BLS has been fabricating jobs, and not just any jobs but those that make up the all-important (if highly inaccurate) payrolls reported by the Biden Bureau of Goalseeked Statistics.
The primary purpose of this analysis, in the Philly Fed’s own words, is “to produce timely estimates of state payroll jobs that closely predict the annual benchmark revisions released by the BLS each March. To do so, we incorporate more comprehensive job estimates released by the BLS as part of its Quarterly Census of Employment and Wages (QCEW) program.” This is more or less a replica of the analysis which the Philly Fed performed back in December, when it found that 1.1 million jobs were unexpectedly “missing.”
So what happened this time? Well, the analysis, which looked at state-level data, “found that “the employment changes from June through September 2023 were significantly different in 27 states compared with prebenchmark state estimates from the Bureau of Labor Statistics’ (BLS) Current Employment Statistics (CES).” Specifically, “early benchmark (EB) estimates indicated lower changes in 24 states, higher changes in three states, and lesser changes in the remaining 23 states and the District of Columbia.“
Some more details from the report:
Over the full year ending with this 2023 Q3 vintage — which includes additional QCEW data changes affecting the prior three quarters — payroll jobs in the 50 states and the District of Columbia grew 1.5 percent.
Based on the pre-benchmark CES sum of states and the U.S. CES, payroll jobs grew 1.9 percent and 2.0 percent, respectively.
The revised CES sum-of-states growth rate is 1.5 percent.
For 2023 Q3, payroll jobs in the 50 states and the District of Columbia rose 0.5 percent, after adjusting for QCEW data.
Based on both the prebenchmark CES sum of states and the U.S. CES, payroll jobs grew 1.7 percent.
The revised CES sum-of-states growth rate is 0.5 percent
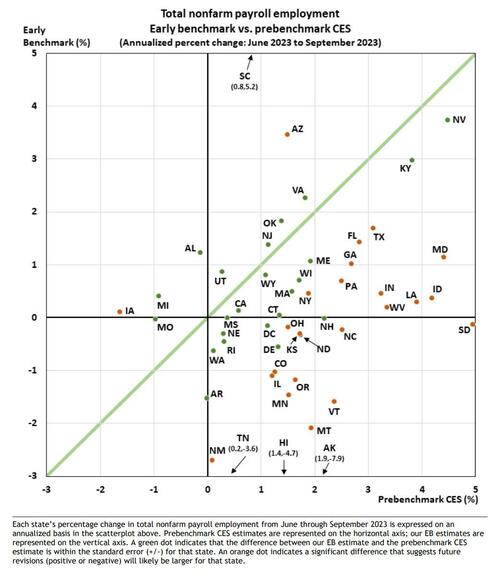
We’ll go back to the chart above in a second, but first we wanted to show this scatter of state-level employment comparing the St Louis Fed’s more accurate early benchmarking process vs the BLS’ Prebenchmarking CES process: it found that most states’ labor data would be revised lower, in many substantially so.
Ok… but what does all of that mean in English?
Well, to make some more sense of the data, we went through the Early Benchmark state-level data excel spreadsheet provided by the Philly Fed (link), and simply added across the various states to obtain aggregate, country-level data so that we could compare the far more accurate QCEW data with what the BLS had been peddling for the past year.
The result was – again – shocking, and as shown in the chart below, a little over a year after we, or rather the Philly Fed, found that the BLS had overstated payrolls in 2022 by 1.1 million, here we go again, only this time the BLS had overstated payrolls by 800,000 through Dec 2023 (and more if one were to extend the data series into 2024). It’s truly statistically remarkable how every time the data error is in favor of a stronger, if fake, economy.
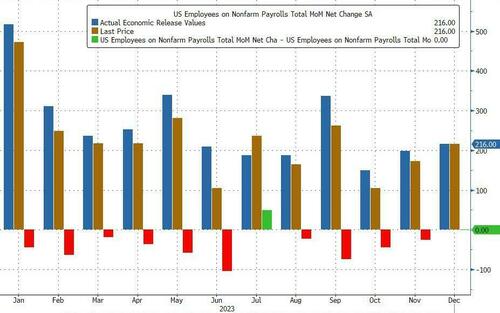
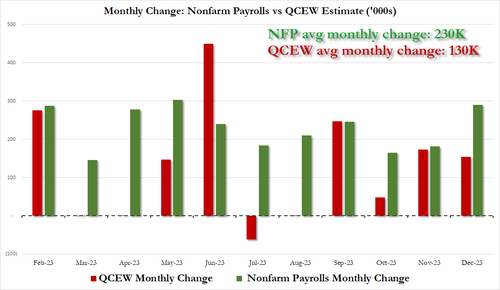
it also means that far from the stellar 230K average monthly increase in payrolls in 2023, which the White House would spin time and again as direct evidence of the benefits of Bidenomics, the true average monthly payroll increase in 2023 was only 130K! The full monthly change in payrolls as originally reported by the BLS (in green) and the actual monthly number, as per the QCEW (in red) is shown below.
Putting it all together, we now know – as the Philly Fed reported first – that the labor market is far weaker than conventionally believed. In fact, no less than 800,000 payrolls are “missing” when one uses the far more accurate Quarterly Census of Employment and Wages data rather than the BLS’ woefully inaccurate and politically mandated payrolls “data”, and if one looks back the the monthly gains across most of 2023, one gets not 230K jobs added on average every month but rather 130K.
Of course, none of that paints Bidenomics in a flattering picture, because while one can at least pretend that issuing $1 trillion in debt every 100 days to add 3 million jos per year is somewhat acceptable, learning that that ridiculous amount buys 800,000 jobs less is hardly the endorsement that the White House needs.
Which is also why nobody in the mainstream media – which is now nothing more than the PR smokescreen for the Biden puppetmasters, the government and the deep state – will ever mention this report.
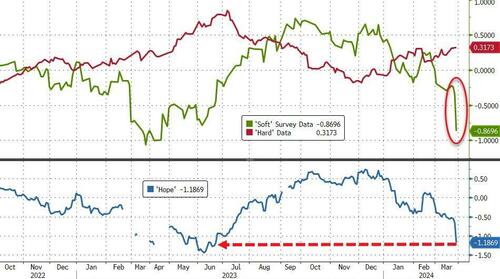
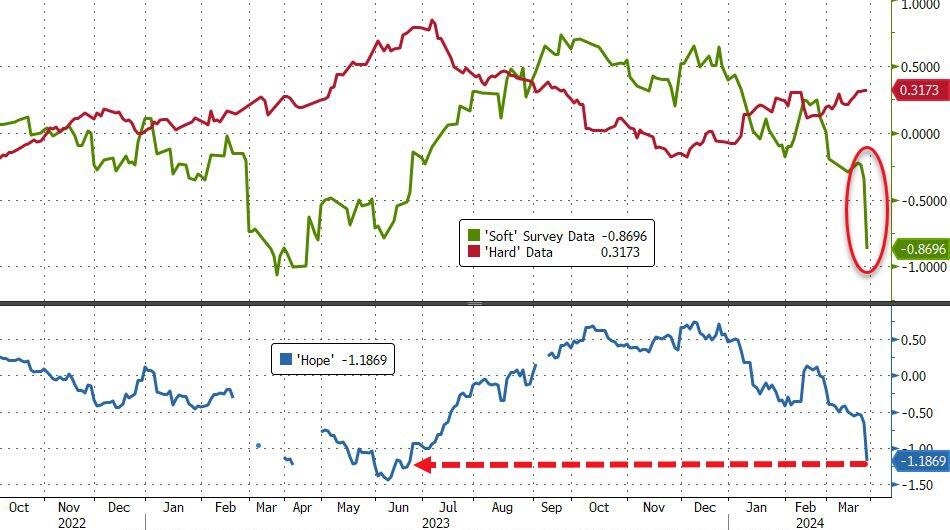
That smashed ‘hope’ – the spread between hard and soft data – back to cycle lows…
Source: Bloomberg
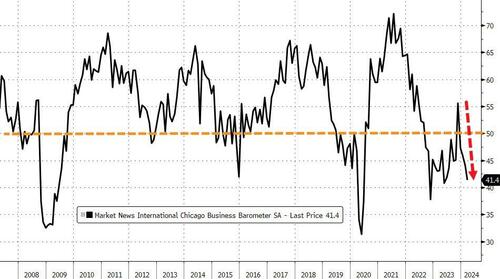
Today’s Chicago PMI plunged to 41.4 – its lowest since May 2023 – from 44.0 (and well below the expected bounce to 46.0)…
Source: Bloomberg
That was below all analysts expectations for the second month in a row…
Source: Bloomberg
Under the hood was even more problematic:
New orders fell at a faster pace; signaling contraction
Employment fell at a slower pace; signaling contraction
Inventories fell at a faster pace; signaling contraction
Supplier deliveries fell and a faster pace; signaling contraction
Production fell at a faster pace; signaling contraction
Order backlogs fell at a slower pace; signaling contraction
Worse still, Prices paid rose again!
So, in summary: slower growth, declining production, shrinking orders, falling employment… and accelerating inflation – is it any wonder that ‘soft survey’ data is collapsing – not exactly election-winning headlines.
Biden asking Zelenskyy for a loan so he can fix the bridge….


You must be logged in to post a comment.