When inflation is so bad that REAL wage growth is negative (-3.31% YoY), I would hardly call that a strong economy for the middle class and low-wage workers.
We also see that REAL home price growth (existing home sales median price YoY – CPI YoY) has slowed to only 2.23% YoY in July.
As The Fed tightens, it is only growing to get worse.
The ADP National Employment Report SA Private Nonfarm Level Change printed this morning confirming what most of us already knew … the US economy is slowing if not already in recession.
The ADP jobs added grew by only 132k in August as The Fed’s M2 Money growth slowed.
Since The Federal Reserve and Federal government overstimulated the economy when Covid surfaced in early 2020, The Fed’s balance sheet expanded to near $9 TRILLION which helped existing home sales median price YoY hit 25.2% in May 2021 but falling to 10.8% YoY in July 2022 as The Fed tightened rates.
It will be a monetary inferno if The Fed decides to actually unwind its $9 trillion balance sheet.
US home price growth is decelerating as The Federal Reserve let’s some of the air out of the monetary tires.
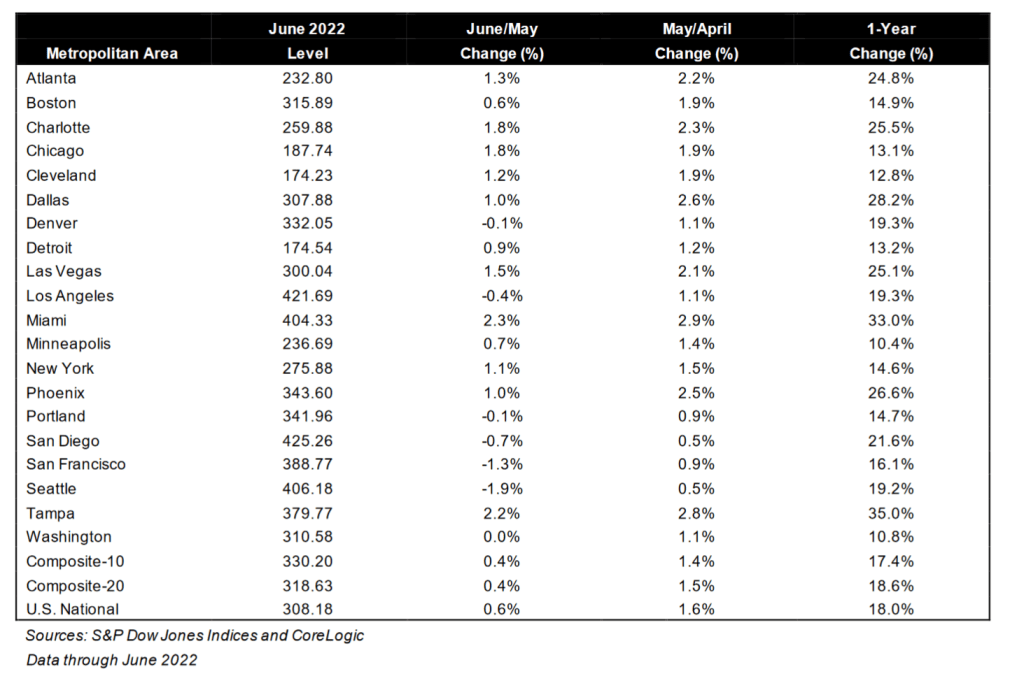
The S&P CoreLogic Case-Shiller U.S. National Home Price NSA Index, covering all nine U.S. census divisions, reported an 18.0% annual gain in June, down from 19.9% in the previous month. The 10-City Composite annual increase came in at 17.4%, down from 19.1% in the previous month. The 20-City Composite posted an 18.6% year-over-year gain, down from 20.5% in the previous month.
Tampa, Miami, and Dallas reported the highest year-over-year gains among the 20 cities in June. Tampa led the way with a 35.0% year-over-year price increase, followed by Miami in second with a 33.0% increase, and Dallas in third with a 28.2% increase. Only one of the 20 cities reported higher price increases in the year ending June 2022 versus the year ending May 2022.
While the Case-Shiller National home price index slowed to 18% YoY in June, the median price for existing home sales slowed to 10.55% YoY in July as The Fed’s M2 Money growth YoY slowed to 5.28% and Freddie Mac’s 30yr mortgage rate rose to 5.3%.
Bear in mind that Case-Shiller is lagged compared to the existing home sales numbers. Much like the New York Yankees manager picking the hottest batter in June to start in September. The Yankees traded poor-hitting Joey Gallo to the LA Dodgers to supplement poor-hitting Cody Bellinger.
In any case, as of June 2022, the 20 metro areas covered by Case-Shiller all grew in price in double digits with alligator-infested Tampa and Miami FL in the 30% rate, rattlesnake-infested Dallas is in 3rd place at 28.2%. Phoenix AZ, where I used to live, slowed to 26.6%. Yes, I had rattlesnakes on my property (a nest of Mohave Rattlers) and a large Diamond-backed Rattler behind my house).
Let’s see how housing holds up with more Fed monetary tightening. Fed Chair Powell is predicting “pain.”
It is amazing that Biden is rising in the polls, simply because he got several inflation-generating, crony pay-off bills passed through a Democrat-controlled Congress. Even more amazing is that Americans aren’t more furious with Biden given that inflation is still raging at 8.5% YoY and the US Personal Savings Rate to cope with raging prices is at -51.5% YoY.
It looks like one quick fix to the inflation problem is for The Federal Reserve to shrink its balance sheet. But they are taking their own sweet time doing it.
And then we have the S&P 500 index which has done poorly since Powell and The Fed have undertaken their “fight inflation” mantra caused by their own folly and Biden’s green, anti-fossil fuel policies. Not to mention Congress spending like drunken sailors in port.
But the same is going on in Europe where inflation is even higher than in the USA and the EUR/USD is plunging like a paralyzed falcon.
And then we have Biden shrinking the Strategic Petroleum Reserve (orange line).
And in Europe, we have Germany suffering through a horrible energy price spike.
Of course, Friday was one of those “Black Fridays” for investors. And pension funds.
The Dow Jone Industrial Average fell -1008.38 points after Powell’s “Mr T” remarks on pain. That was a whopping -3%. The NASDAQ composite index fell almost -4%.
Equity markets struggled in Europe as well, particularly the German DAX index.
The UMich Buying conditions for houses rose slightly, but remains near the lowest level since 1982.
Clubber Powell, Federal Reserve Chairman.
The Case-Shiller house price numbers are due out Tuesday for June and it is expected that they will show a significant slowing in home prices. Biden and Clubber Powell could then take “credit” for slowing “inflation.”
The elite class “economists” (aka, cheerleaders) are meeting at Jackson Hole, Wyoming this week. But while they are planning our future, the revision to the miserable Q2 Real GDP report came out this morning.
So, the second pass at measuring Real GDP produced a slightly better number (-0.6% vs -0.9%).
But the GDP PRICE index revision worsened from 8.7% to 8.9%. Look at REAL personal consumption (yellow line) as M2 Money growth slows.
Let’s see how things go at The Fed party at Jackson Hole, Wyoming. It is appropriate for The Fed to hold their party/meeting at Jackson Hole (Teton County) since it has the highest concentration of wealth per household than any other county in the nation.
Biden is the opposite of the miserly Scrooge McDuck. He gives billions to Ukraine and spends trillions on various Federal projects without batting an eye as to how and who is going to pay for all the spending. And Biden’s latest election pandering is no different.
Speaker Pelosi claims that Biden’s bold action on student loan forgiveness is a strong step in Democrats’ fight to … make college even MORE expensive and lead to colleges hiring even MORE administrators (aka, apparatchiks) making colleges even MORE bogged-down in red tape.
And Speaker Pelosi, the costs of Biden’s midterm election buy of votes is estimated to be $300 BILLION. And a report from the Brookings Institution observed that one-third of student debt is owed by the wealthiest 20% of households, while only 8% is owned by the bottom 20%.
So, Biden is letting AOC write-off $10k of her student loan obligation. Bear in mind that the $10k forgiveness is taxed by The Federal government as income.
It looks like The Fed will have to expand the M2 Money supply to pay for “Billions Biden’s” spending spree.
The phrase “crossing the Rubicon” is an idiom that means that one is passing a point of no return. Its meaning comes from allusion to the crossing of the river Rubicon by Julius Caesar in early January 49 BC.
Indeed, the US crossed the FISCAL Rubicon in Q4 2012. That is when US Treasury Public Debt outstanding exceeded Real GDP. And the gap has been growing ever since.
In case you were wondering why M2 Money Velocity is so low, it is because the US is in constant crisis management mode as an excuse to spend trillions of dollars …. that generates progressively lower real GDP.
They built this nation on MMT (Modern Monetary Theory) which translates to the Federal government and Federal Reserve just wanting to spend trillions and trillions. Since 2005 (the peak of the housing bubble), the US Federal Reserve has increased the M2 Money stock more than real GDP growth in almost every quarter.
I remember when macroeconomists used to say “Everything is beautiful … as long as M2 Money growth is LESS than real GDP growth.” But we have apparently shifted to MMT when Everything is beautiful as long as there is a crisis and Congress can spend trillions.
Now Biden/Congress are spending billions in trying to reduce inflation (seriously, only in Washington DC would they think that massive spending bills would REDUCE inflation).
The US housing market is sensitive to Fed “catch-up” monetary tightening. For example, the NAHB’s traffic of prospective homebuyers declined rather dramatically in August as The Fed tightened rates and the 30yr mortgage rate rose. That is what I call a “Nestea Plunge.”
How are mortgage rates impacted by Fed monetary policy? While The Fed began really “sloshing” markets with excess stimulus (QE in late 2008), the latest round of QE (or asset purchases) came with the US Covid shutdowns (what genius thought of that??) and that stimulus has NOT been withdrawn yet. Only the Fed Funds Target rate has tightened.
The 30yr mortgage rate rose with Fed rate tightening, but the Fed’s System Open Market Holdings (SOMH) of Treasury Notes and Treasury Bonds has come down a bit. But not the pare-down The Fed has hinted at. The 30yr mortgage rate is cooling as the prospect of future Fed rate hikes declines.
As of this morning, The Fed Funds Futures market points to rates rising until March 2023 … then easing again.
One reason The Fed has been slow to sell assets off its balance sheet is that a large chunk of T-Notes and T-Bonds are maturing shortly. It will be a matter of whether The Fed reinvests the proceeds or lets the balance sheet wind-down.
Real estate investment trusts (REITs) are an interesting asset class, allowing investors to purchase shares in large-ticket assets like multi-family properties or shopping centers. But given the changing landscape due to online shopping (aka, the Amazon effect), Covid economic shutdowns, etc., REITs should be having a hard time. But aren’t. How come?
Covid economic shutdowns definitely took its toll on retail shopping centers, as an example. And you can see the plunge in the NAREIT All equity index in early 2020. But the NAREIT All-equity index rallied … until The Federal Reserve started tightening their loose monetary policy. Note that as the implied O/N rate rose (orange line), REIT shares declined.
But as the WIRP implied O/N rate settled (pink box), the NAREIT index began to climb again. It is clear that REITs, like other equities, benefit from Fed easing. But how long will The Fed continue tightening?
As of this morning, The Federal Reserve is anticipated to raise their O/N rate to 3.738% by March 22, 2023. Then begin lowering their target rate … again.
Sadly, REITs, like other equity investments such as the S&P 500 index, are sensitive to The Fed’s easing/tightening. Look for REITs to struggle as The Fed tightens, then rally as The Fed eases again.
Here is the (in)famous Hindenburg Omen. Notice how the Hindenburg Omen alarm bells (yellow and red dots) have been silenced by The Fed. But as The Fed tightens (at least until March ’22), we may see the Hindenburg Omen flashing again. Call it the Powellburg Omen.
The NCREIF property index had a decline in the Covid-outbreak era (early 2020) and you can see a slight slowdown in the NCREIF index as The Fed started tightening to fight inflation.


You must be logged in to post a comment.