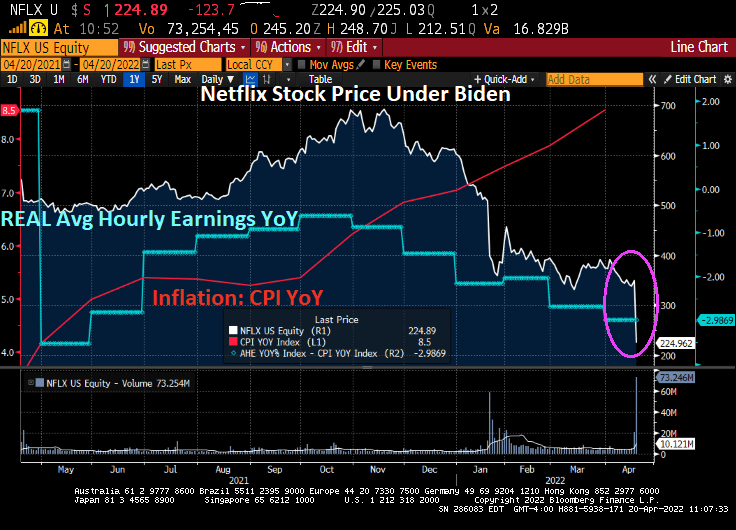
Netflix, the movie and TV show subscription service, suffered an extraordinary decline in its stock price. But like the film “Margin Call” that pretends the Lehman Brothers bankruptcy in 2008 was a surprise, it really is no surprise that Netflix is getting crushed. Why? Thanks to Bidenflation, millions of American households are suffering (REAL average hourly earnings are declining under Biden) and many of those were Netflix subscribers.
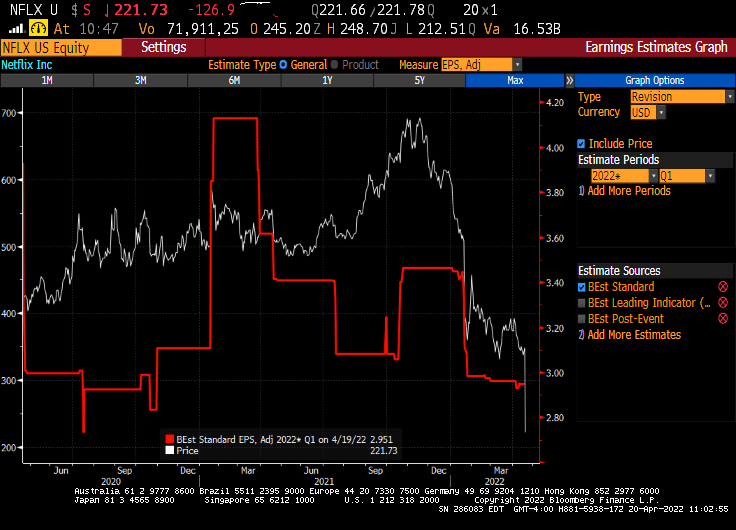
Netflix’ earnings per share soared when Biden was first installed as President, likely due to effects of Biden’s/Pelosi’s/Schumer’s Covid stimulus. But alas, fiscal stimulus is short-lived but the negative effects of inflation are long-lasting.
Inflation Joe, the bully of the middle class and low-wage workers. But at least millionaires will get more electric cars charging stations! /sarc
The book and movie “The Big Short” revolved around the 2005-2007 housing bubble driven by lending to borrowers with subprime credit (and little or no underwriting). As we know, Bear Stearns, Lehman Brothers and other investment banks too large positions in subprime asset-backed securities (SABS) that became highly toxic once the demand for high-yield subprime ABS dried up. The decline in US home prices coupled with soaring 90-day mortgage delinquencies led to the failure of Bear Stearns and Lehman Brothers along with Fannie Mae and Freddie Mac being put into conservatorship by their regulator.
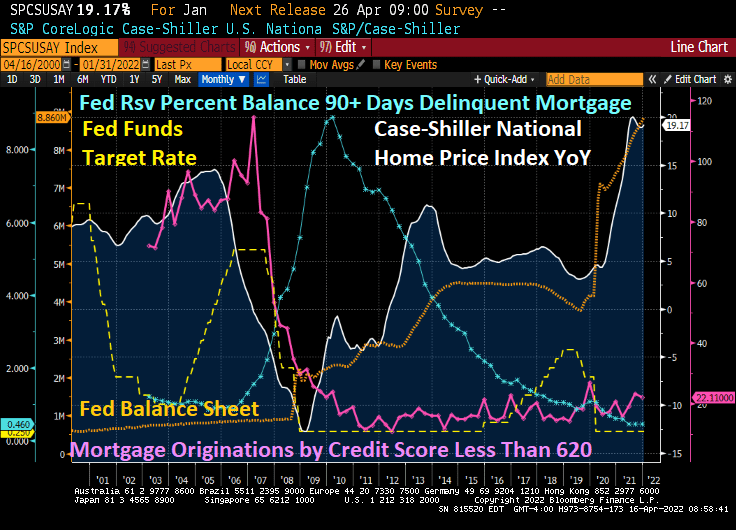
Fast forward to today. Mortgage originations by credit scores of 620 or less have shriveled while home price growth YoY is even higher than the subprime mortgage crisis of 2005-2007. So, is the US facing another “Big Short” scenario? Yes and no.
The answer is no in that lenders have tightened their credit box sufficiently so that investment banks are no longer buying large quantities of subprime credit paper. The answer is yes if we consider that the current housing bubble is fueled by extraordinary monetary stimulus due to Covid (as well as rampant Federal government stimulus spending).
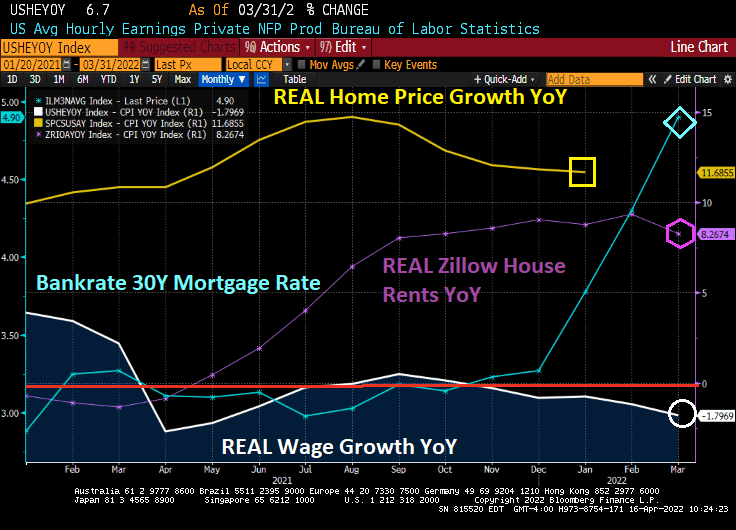
Following the Federal Reserve of Dallas’ lead, here is a chart of REAL home price growth YoY against REAL average hourly earnings YoY. I added REAL Zillow house rents YoY as well.
Look at the affordability gap during the Subprime Bubble of 2004-2006 and then the Fed Bubble of 2020 to today. Both bubbles show a disconnect between REAL home prices and REAL wages. REAL Zillow home rents are not as high as REAL home price growth, but still how a huge gap in rent affordability.
So, what can upset the apple cart? How about Jay and The Gang jacking up mortgage rates making home affordability even worse (unless it slows home price growth).
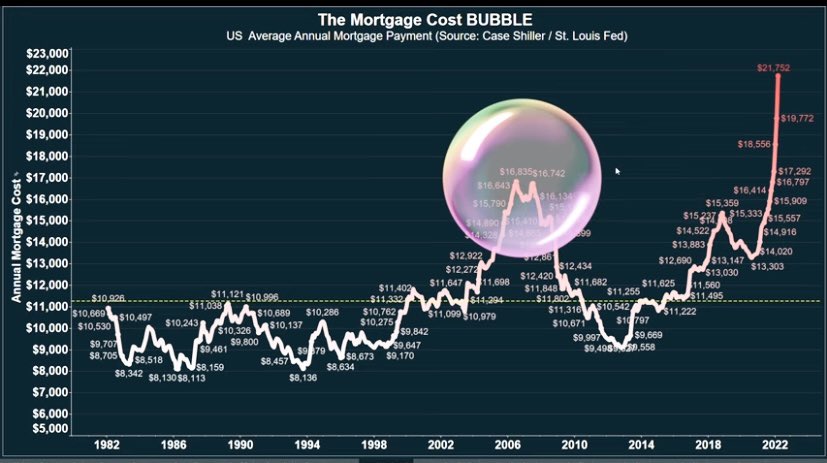
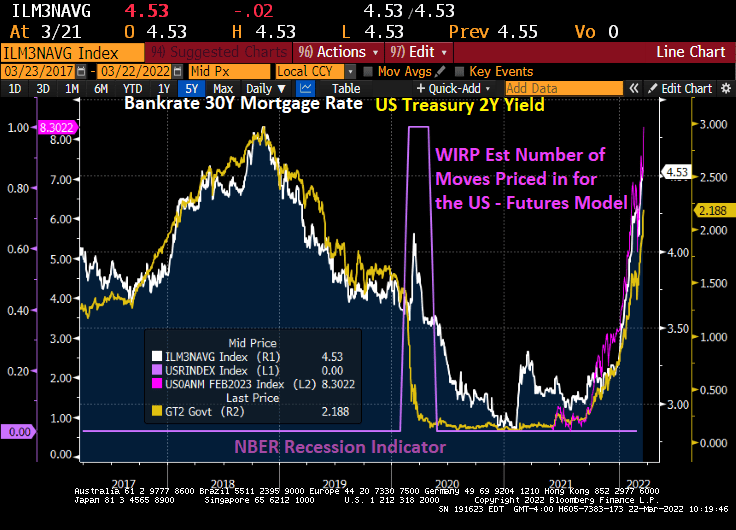
Thanks to The Fed’s propose quantitative tightening, mortgage rates are soaring and mortgage costs along with them. Mortgage costs, thanks to The Fed driving up housing prices AND mortgage rates, are substantially higher than during the subprime mortgage housing bubble.
The Fed’s whipsaw approach helped crash home prices during the subprime mortgage crisis by dropping rates too fast at first (helping to ignite a housing bubble) then raising rates too fast (helping to crash housing prices).
Harry Truman once uttered the phrase “The buck stops here.” Joe Biden’s catchphrase should be “It’s Russia’s fault!”
Well, all roads led to Joe and Jay. Here is a chart of Producer Price Index (Final Goods) prices YoY, now the highest in history. At least, gasoline prices are declining to $4.083 (they were $2.40 when Biden was installed as President). But inflation is out of control and the 30-year mortgage rate is now 5.14% (mortgage rates were 2.82% in February 2021 just after Biden took control).
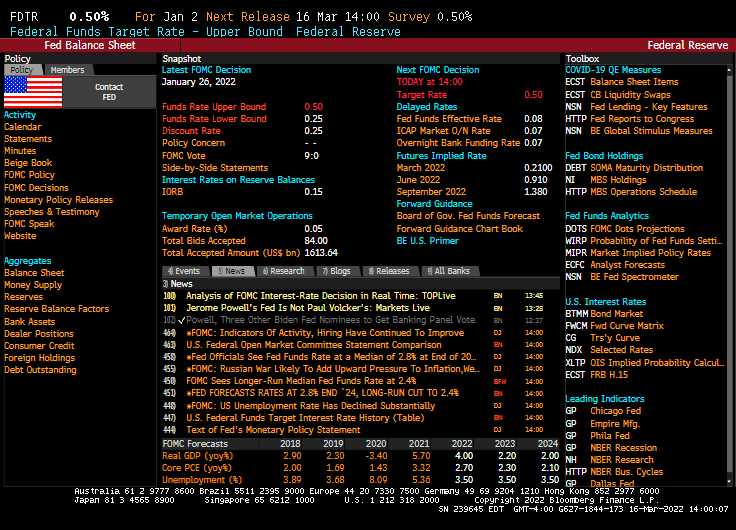
Just in case you wonder why I follow Fed Funds Futures data so closely.
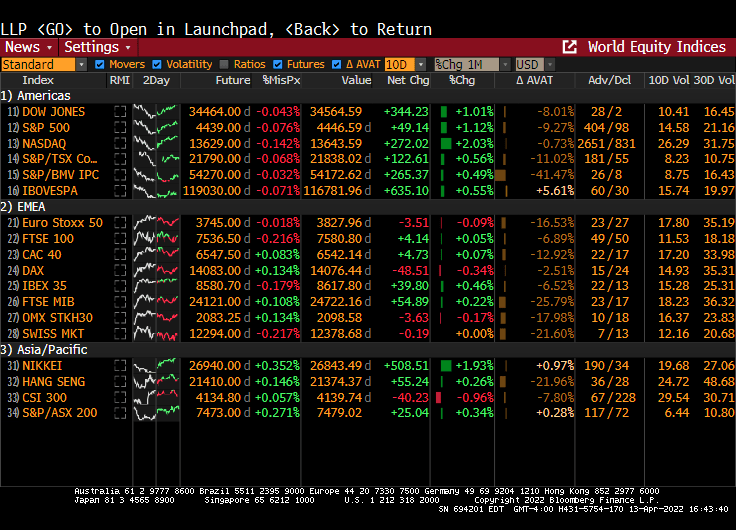
Equity markets are up strongly today as markets sense a weakening in resolve by The Federal Reserve (number of expected rate hikes dropped at 10AM EST).
It appears that we have a “Powell in the headlights” problem.
As we are painfully aware, The Fed’s exaggerated monetary flood combined with Federal stimulus spending has led to horrible inflation.
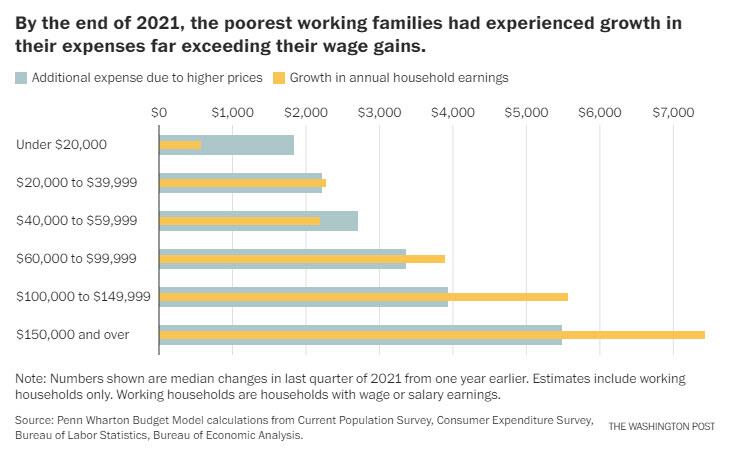
Yes, despite what government talking heads say, Federal stimulus increases demand for goods, the supply is generally slow to respond resulting in rising prices. Then government policies driving up energy prices also leads to highers prices. Throw in Federal Reserve monetary stimulypto and we have this chart from hell from Penn-Wharton. The chart shows that households earning less that $60,000 experience higher expenses due to rising prices than their gain in earnings.
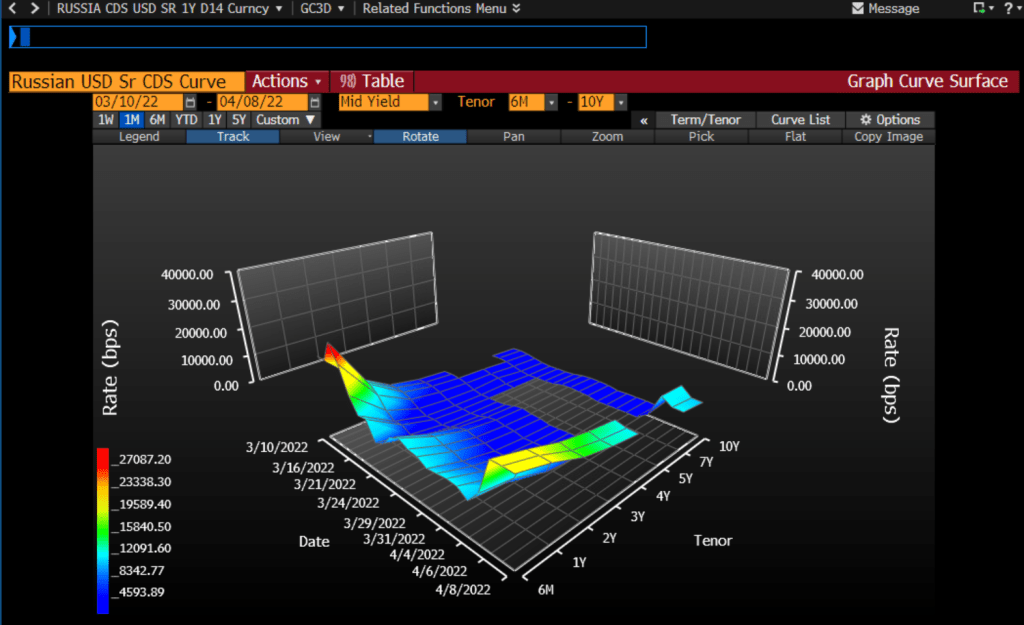
Another chart from hell is the Russian USD Credit Default Swap (CDS) curve. It is spiking at over 20,000.
The one-year Russian CDS is currently at a whopping 20,336 indicating that there is about a 99% of a Russian default over the coming year. As someone who lived through the 1998 Russian credit default scare on Wall Street, this will send a shock wave through credit and Treasury markets.
On the US Treasury front, this chart shows how steeply sloped the US Treasury actives curve has become. Steep until 3 years, then flat. I call this chart “T-Dazzle!” T-Dazzle because I can’t believe how badly the Biden Administration and The Federal Reserve are screwing up the country.
Crude oil? WTI Crude is back to almost $100 per barrel while Brent Crude is at $102.78 per barrel. Wheat is up 3.22% thanks largely to problems related to Russia invading Ukraine (Europe’s bread basket) and a dismal Chinese wheat harvest.
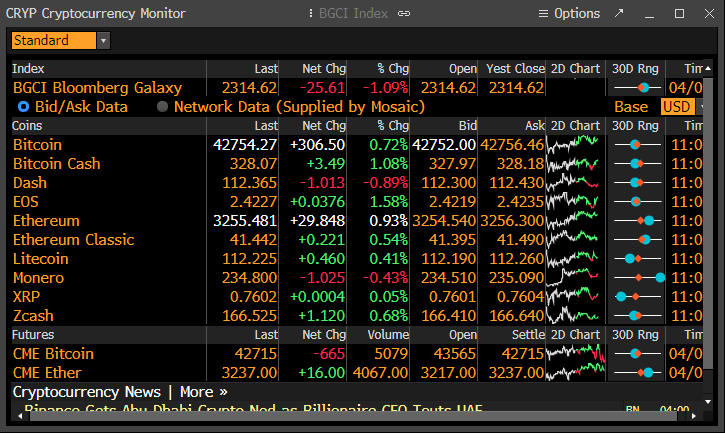
Cryptocurrencies, the alternatives to the US fiat dollar, are rising (in particular, Bitcoin and Ethereum).
Of course, I have to finish up with the soaring 30-year mortgage rate.
Federal Reserve Governor Lael Brainard said the U.S. central bank will continue to tighten policy methodically and shrink its balance sheet at a rapid pace as soon as May.
Brainard’s hawkish remarks sent bond prices crashing and 10Y bond yields up over 16 bps.
While Bankrate’s 30Y mortgage rate is down slightly today, the surge in the 10Y and 2Y Treasury yields could push mortgage rates above 5% by tomorrow,
Even Europe is feeling Brainard’s wrath. Italian 10Y sovereign yields are up almost 20 bps.
The NASDAQ index is down 300 points on Brainard’s utterance.
Gee thanks Lael from all us wanting to finance the purchase of a house.
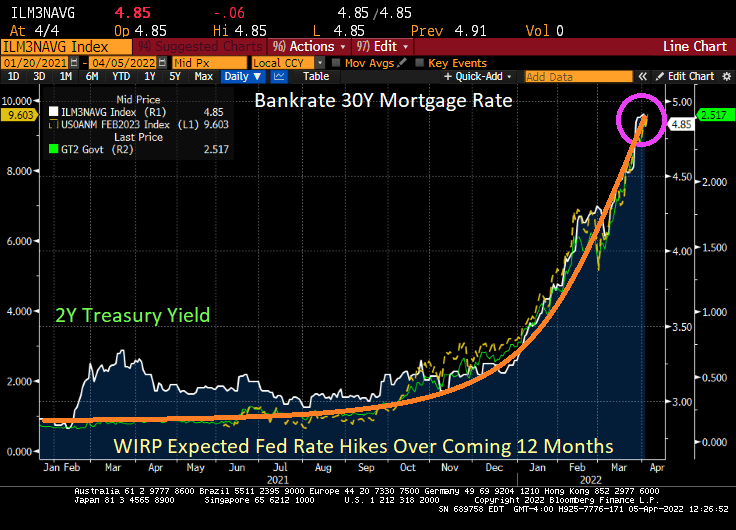
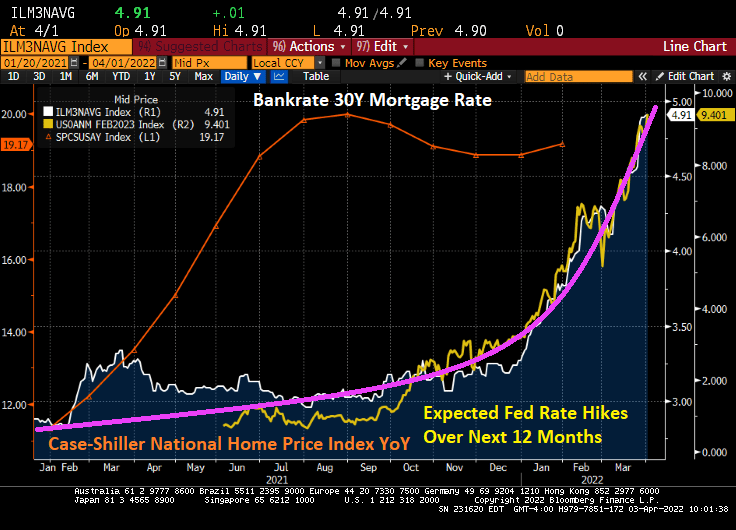
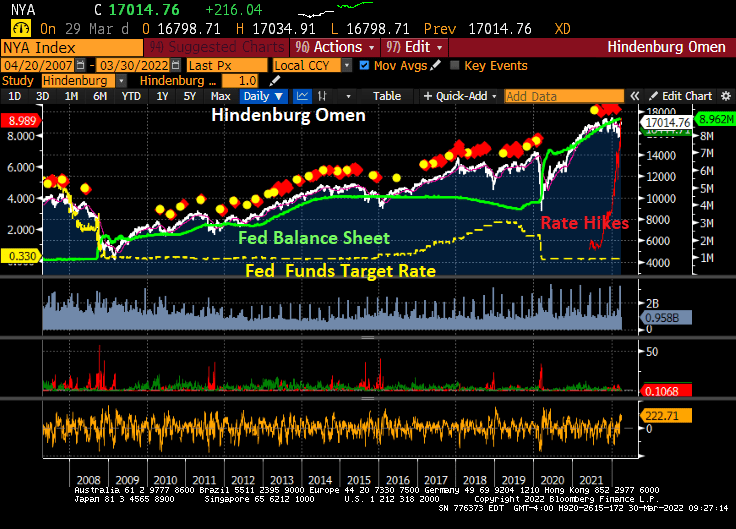
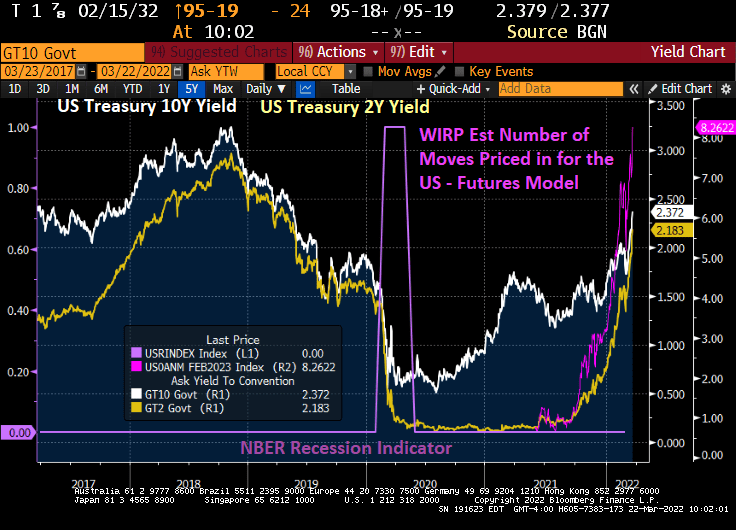
Consider what has happened since President Biden was elected. The S&P 500 total return index (green index) has risen thanks to The Federal Reserve’s balance sheet expansion (orange line) with COVID. Until 2022 when the expectation of Fed rate hikes surged from 3 in late December 2021 to 9.4 expected rate hikes over the next 12 months (yellow line).
The US Treasury total return index (white line) has gotten crushed with The Fed’s signals of rate hikes and quantitative tightening (QT). Call it “White Line Fever.” The commodity total return index (blue line) has surged as The Fed’s expected rate hikes have risen from 3 to 9.4 in 2022.
Is The Fed causing a Great Reset in housing? In 2022, we see the surge in Fed rate hike expectations leading the 30-year mortgage rate to be nearly 5%. The last Case-Shiller home price index was for January and it was still raging at 19.17% YoY growth. Let’s see if The Fed’s QT will slow down home price growth. But home prices are growing at 4x 30-year mortgage rates.
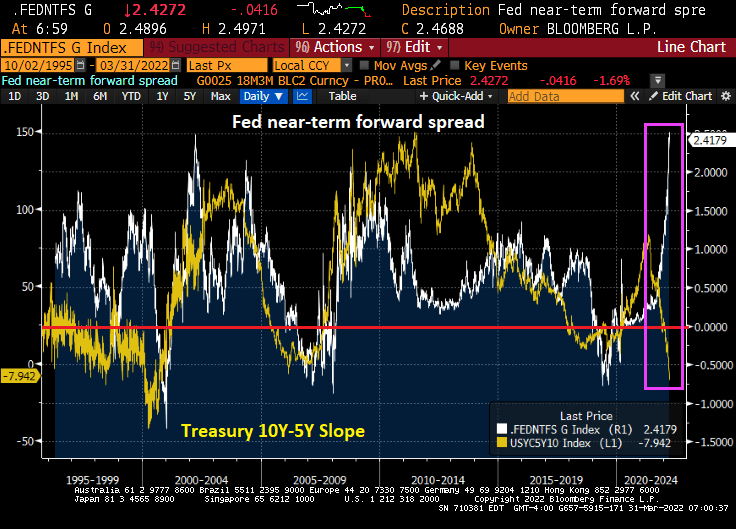
There is a massive divergence between the collapsing US Treasury 10Y-2Y yield curve and the near-term forward spread. The near-term forward spread is the difference between the implied interest rate expected on a three-month Treasury bill six quarters ahead and the current yield on a three-month Treasury bill.
As we already know, the 10Y-5Y yield curve has inverted signaling a coming recession.
This divergence between the Treasury yield curves and the near-term forward spread is occurring as US inflation hits the highest rate in 40 years.
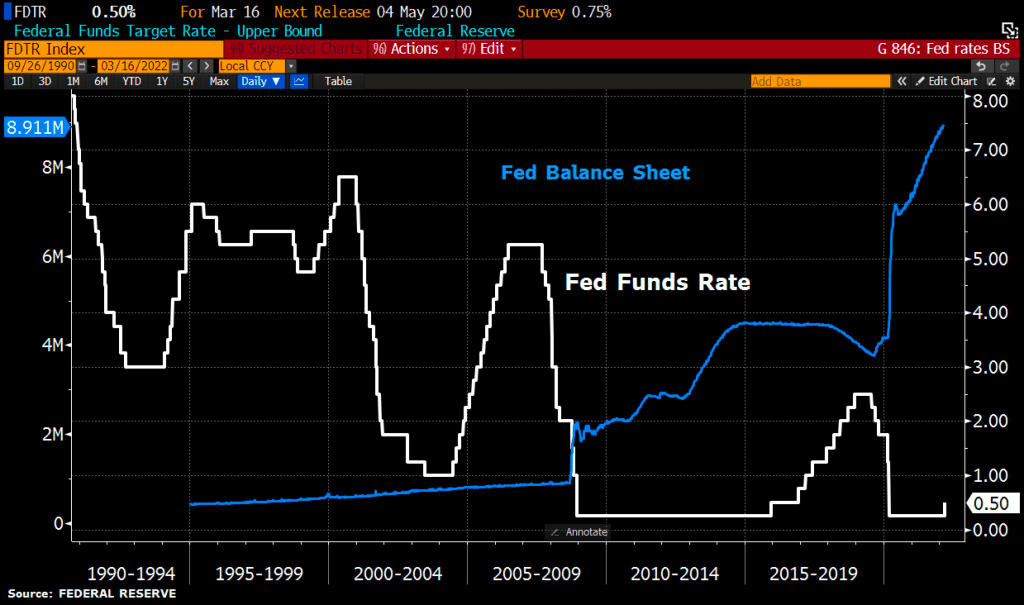
As of today, Jerome “Nero” Powell and The Gang at The Federal Reserve have not trimmed the Fed’s balance sheet and have only raised their target rate once under President Biden.
Here is the Hindenburg Omen, named for the catastrophic explosion on May 6, 1937 at Lakehurst Naval Air Station in New Jersey. The Hindenburg Omen was flashing red before the stock market correction of late 2007-2009. But, the Hindenburg Omen has flashed red repeatedly since the financial crisis, yet the S&P 500 index has kept rising. The reason? Repeated policy errors by The Fed leaving monetary stimulus in place for too long leading to a bubble forming in the stock market.
The Shiller CAPE (Cyclically-adjust price-earnings) ratio is at the second highest level since the 1800s. The highest point was the infamous Dot.com bubble and bust in 2000/2001.
Since The Fed continues to say “We have a plan!” to slow/shrink The Fed’s balance sheet and raise their target rate … it has not done anything yet (other than a 25 basis point bump at the March meeting).
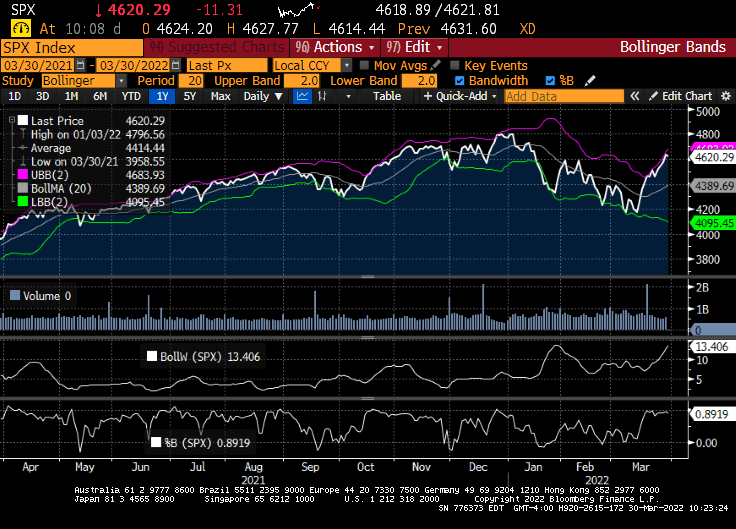
I am not advocating technical analysis for stocks, but the Bollinger Band analysis for the S&P500 index is showing the S&P 500 index near the top band indicating that a decline in likely.
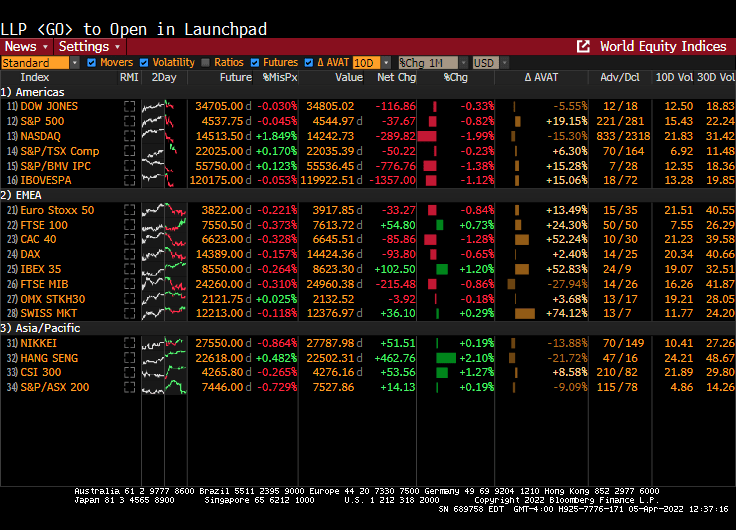
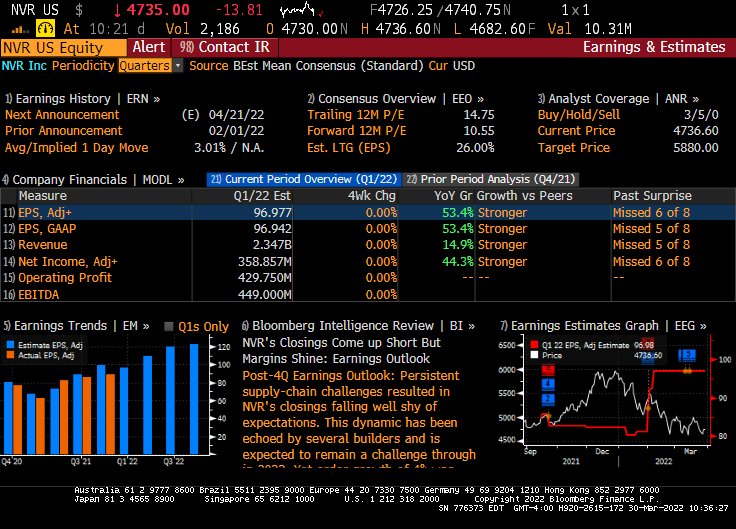
Today, the US equity market in essentially flat given the massive uncertainty about the Russia/Ukraine situation and whether the US economy is slipping into darkness. But this morning, Federal government blessed companies (healthcare, solar energy and Blackrock) are doing quite well, while homebuider NVR is taking it on the chin thanks to hints that The Fed will raising rates.
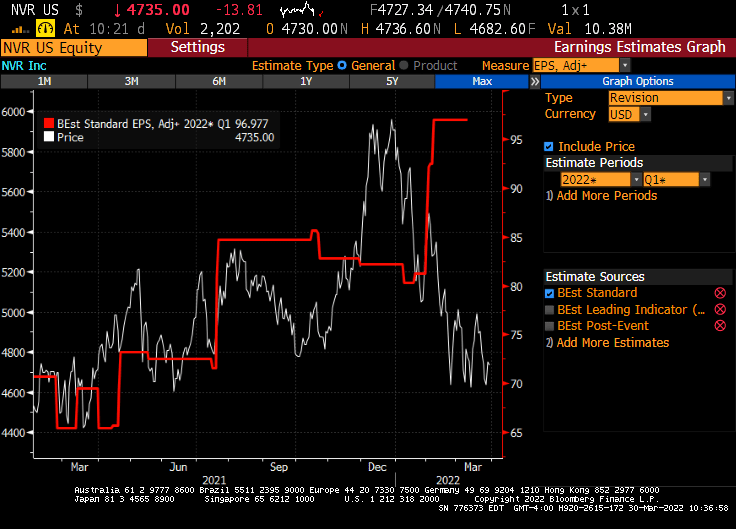
Now, NVR (Northern Virginia Homes, Ryan Homes) had explosive earnings growth in their February 1, 2022 report.
But the market is pricing in the crushing Fed rate hikes that are expected.
So, will Foul Powell pull a Volcker and raise rates and crush the economy (and stocks)? Or will Foul Powell And The Fed gang let inflation burn out of control, but preserve the massive asset bubbles?
So, The Federal Reserve raised their target rate by … as expected … 25 basis points to 50 basis points.
The Taylor Rule suggests that the target rate should be 11.96%. So, Powell and The Gang are getting closer! /sarc
The short-term reaction to the measly rate increase? The Dow declined (but still in positive territory for the day) and the benchmark 10-year Treasury yield spiked to 2.23%.
On Powell’s surrender to inflation, the US Treasury 10Y-2Y curve continued to flatten.
You can see The Fed’s sloth-like response to blood-curdling inflation in the lower right-hand part of the chart.


You must be logged in to post a comment.