Options imply a +/-1.1% move in S&P 500 for the 18-Sept FOMC meeting; this compares to an average of +/-1.2% move priced into SPX ahead of FOMC meetings since the beginning of 2022.
Arguably, this is an unusually important FOMC meeting due to the expected start of a cutting cycle.
On average, the S&P 500 has moved +/-1.3% during FOMC events since the beginning of 2022, coming above options implied moves.
In the July FOMC meeting the index moved +/-1.6% vs. an options implied expectations for a +/-1.1% move.
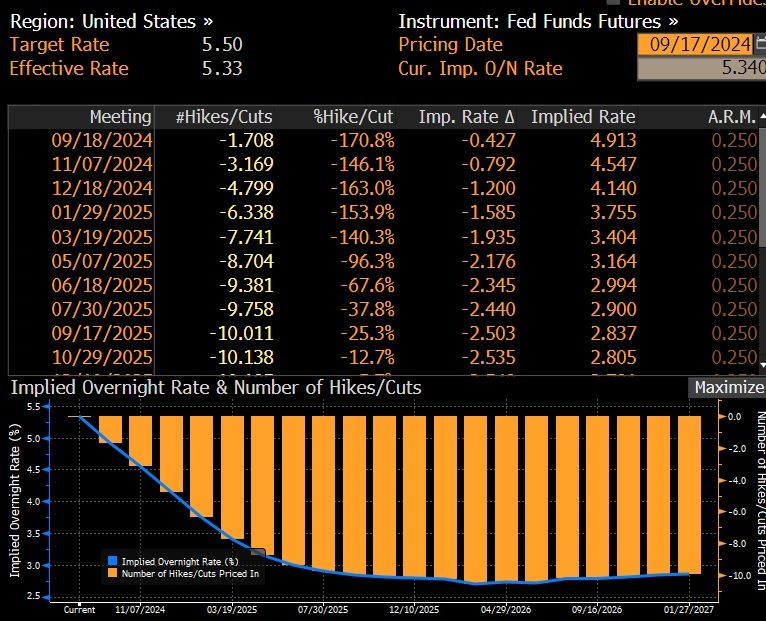
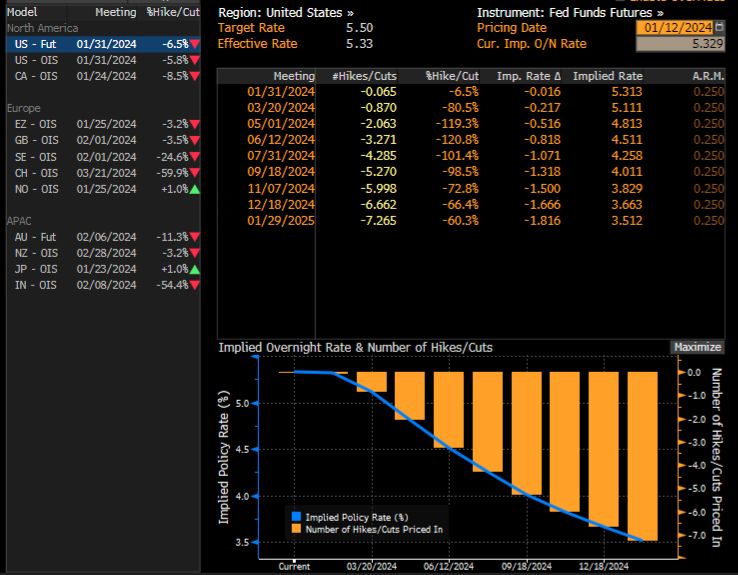
Goldman’s economists expect the September FOMC meeting to be the start of the Fed easing cycle with a 25bp rate cut followed by two consecutive 25bp rate cuts in November and December, and an eventual terminal rate of 3.25-3.5%.
They see differing asset performances around the start of the easing cycle depending on what motivated the Fed cuts.
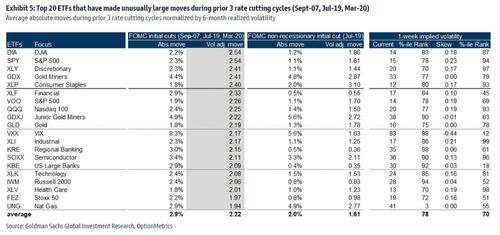
Goldman analyzed moves across stocks and ETFs during the first Fed rate cut in the prior 3 Fed easing cycles (18-Sep-2007, 31-Jul-2019 & 3-Mar-2020).
Rate cuts during the 2007 and 2020 easing cycles were associated with a recession while the 2019 cut was due to a growth scare.
In the tables below are the top 20 names that saw unusual moves during the prior 3 Fed easing cycles and for the 2019 cycle separately.
Financials and Tech were major movers during the beginning of the prior 3 Fed easing cycles while the 2019 cycle also saw unusual moves in Consumer Staples.
Happy Easter! I mean Happy TRADITIONAL Easter, not a Biden weird trans celebration.
Biden and Congress (Schumer, Johnson, McConnell, etc) spend and borrow like its cottage cheese.
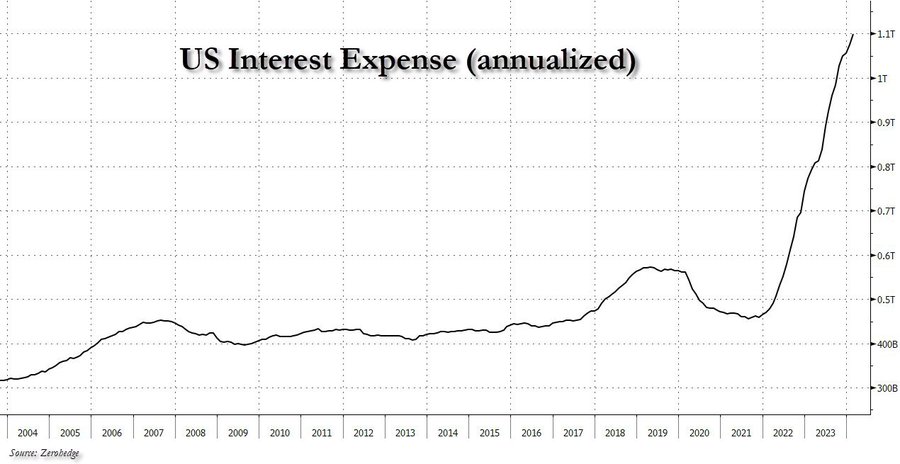
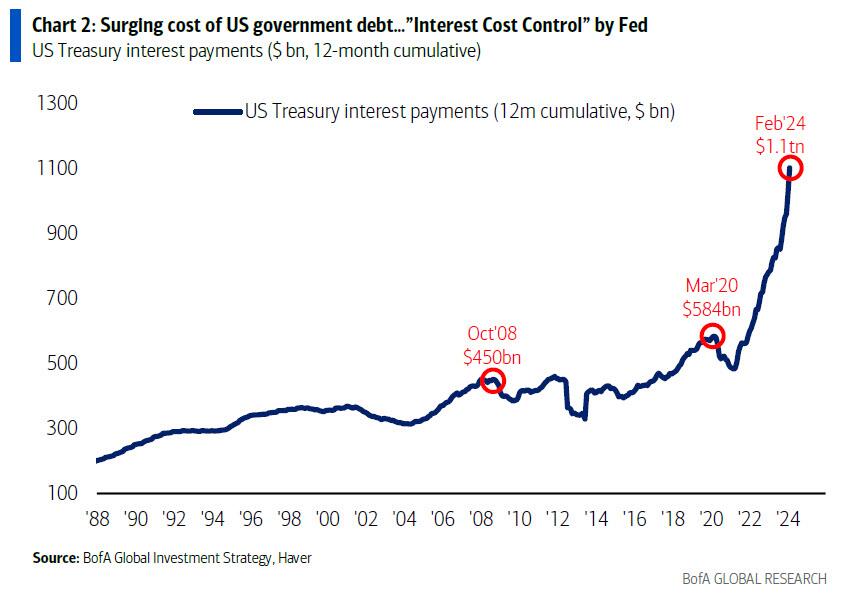
After hitting $1 trillion in late 2023, interest expense on US debt rose to a record $1.1 trillion in late March, and ii) while US debt is now rising at a pace of $1 trillion every 3 months, US interest expense is rising at a just as torrid $100 billion every 4 months (this interval will also shrink to three months very soon).
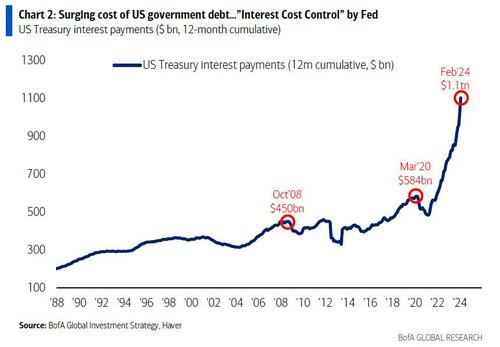
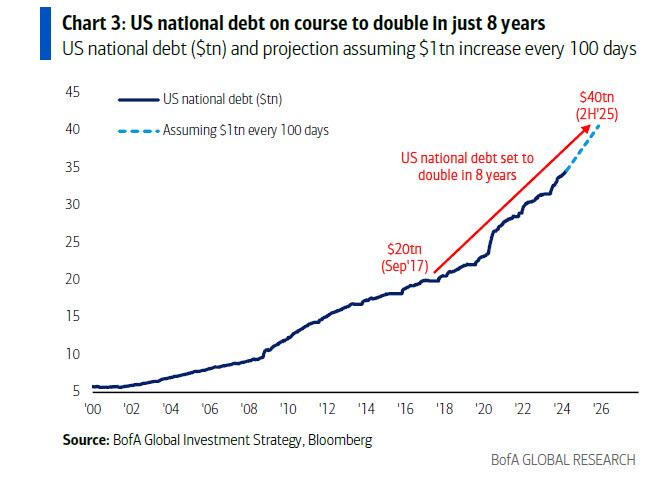
he Biggest Picture: $1.1tn in interest payments on US government debt past 12 months, doubled since COVID (Chart 2); trend in govt spending (up 9% YoY) & debt (up $1.0tn every 100 days)…big motivation for Fed to cut rates to constrain surge in interest costs (“ICC” or Interest Cost Control policy)… bear in bonds (if no recession), steeper yield curve, weaker US$, higher commodities/gold/crypto & TINA for stocks.
Of course, since Hartnett is one of those good strategists where one fact opens up a cascade of downstream observations, that’s precisely what happened this time and he fills out the balance of his latest report (available to pro subscribers in the usual place) with his tongue-in-cheek notes on why the US is on a doomsday date with a debtdisaster, starting with why being a “dove means never having to say you’re sorry”:
US government spending past 5 months = $2.7tn, up 9% YoY… on course for $6.7tn in FY24; US national debt rising $1tn every 100 days…set to hit $35tn in May’24, $37tn by US election, $40tn in H2’25 (doubling in 8 years); spending up, deficits up (9% of GDP average past 4 years), debt up -> interest payments up = $1.1tn in past 12 months & set to rise by $150bn in next 100 days[ZH: this sounds familiar]
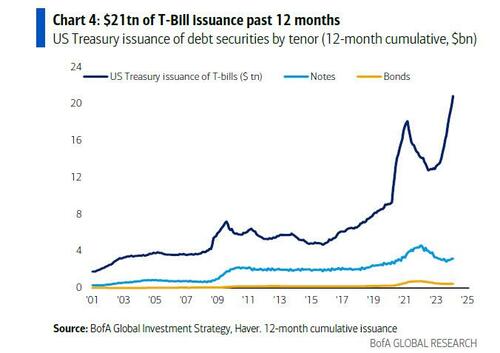
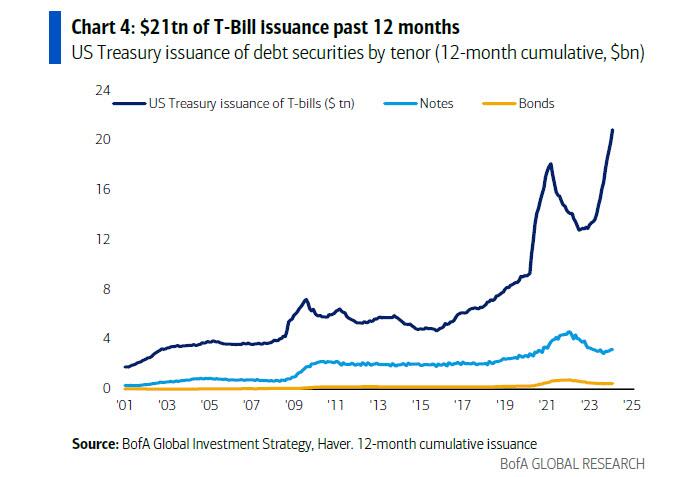
US Treasury has aggressively shifted refunding toward <1-year T-Bills ($21tn issuance past 12 months), lowering maturity of debt to ≈5 years, increasing sensitivity to short rates, incentivizing Fed to cut rates;
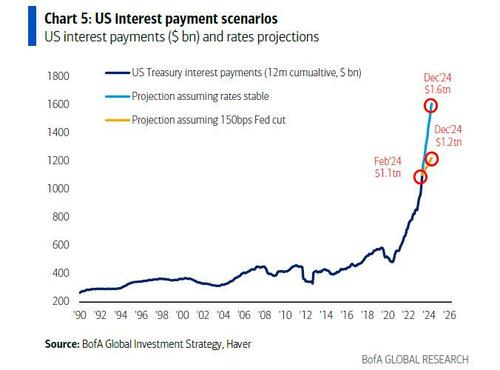
And the punchline: Hartnett takes our observations, and expands them to their logical, if absurd, extreme (which ironically takes places in just 9 months) to find that US annual interest costs are set to jump from $1.1 trillion to $1.6 trillion, which is a big deal…
Unchanged rates/yields & debt trend next 12 months & US refinancing rate is 4.4% & annual interest costs jump from $1.1tn to $1.6tn (Chart 5); in contrast 150bps of Fed cuts next 12 months and average refi rate is 3.2%, stabilizing/constraining interest payments to $1.2-1.3tn over next 2 years; call it “ICC”/Interest Cost Control but Fed must placate fiscal excess coming quarters…bear in bonds (if no recession), steeper yield curve, weaker US$, higher commodities/gold/crypto & TINA for stocks.
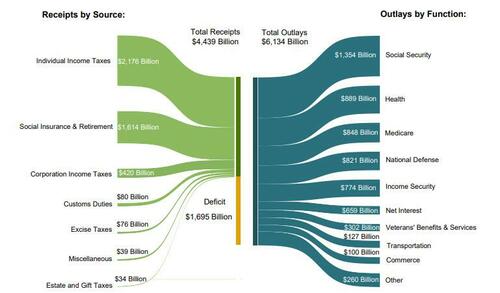
… because if the Fed does not cut rate by 150bps (as it may in an “ICC” scenario) should inflation prove to be sticky (something which Putin clearly has figured out realizing the fate of Biden’s re-election is in his oily hands), and total interest does rise to $1.6 trillion by year-end, that it will become the single biggest US government outlay by the end of the fiscal year; as a reminder, in fiscal 2023, Social Security spending was $1.354 trillion, Health was $889 billion, Medicare $848 and national defense, a paltry (by comparison) $821 billion.
Stepping briefly away from the looming US debt disaster, Hartnett makes three more observations on the current state of the market:
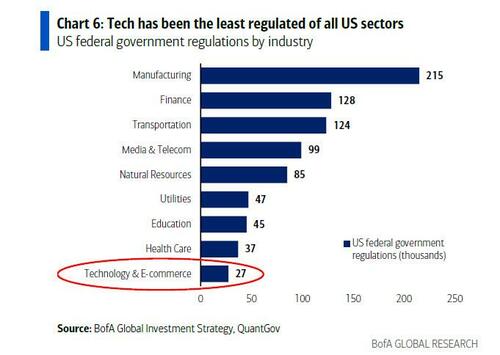
Tech regulation getting noisier: DoJ vs Apple antitrust lawsuit, FTC vs Amazon antitrust lawsuit, FTC inquiry into AI deals of Amazon, Google, Microsoft; EU investigation into Apple, Meta, Google breach of Digital Markets Act; EU $2bn Apple antitrust fine, Japan FTC Apple & Google antitrust complaint et al…
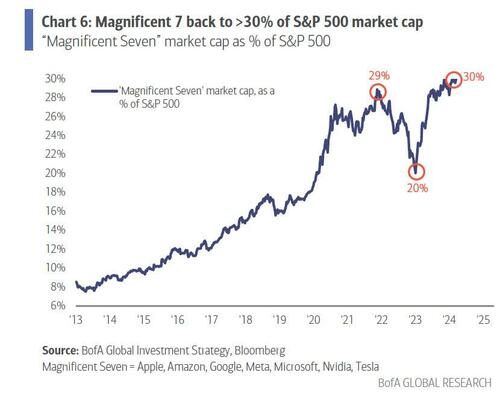
“Magnificent 7” = 30% of SPX index & 60% of SPX gains past 12 months…investors love big tech “moats”, monopolistic ability to protect margins, market share, pricing power, finance & control AI arms race; but ≈$2tn of Magnificent 7 revenues past 12 months tempting target for regulators/governments struggling to pay bills;
Note tech historically the least regulated of sectors (the chart below uses data from 2017) and in past 12 months average tax rate of “Magnificent 7” was 15% vs 21% for rest of S&P 500… and regulation & rates the historic way sector bulls & bubbles end.
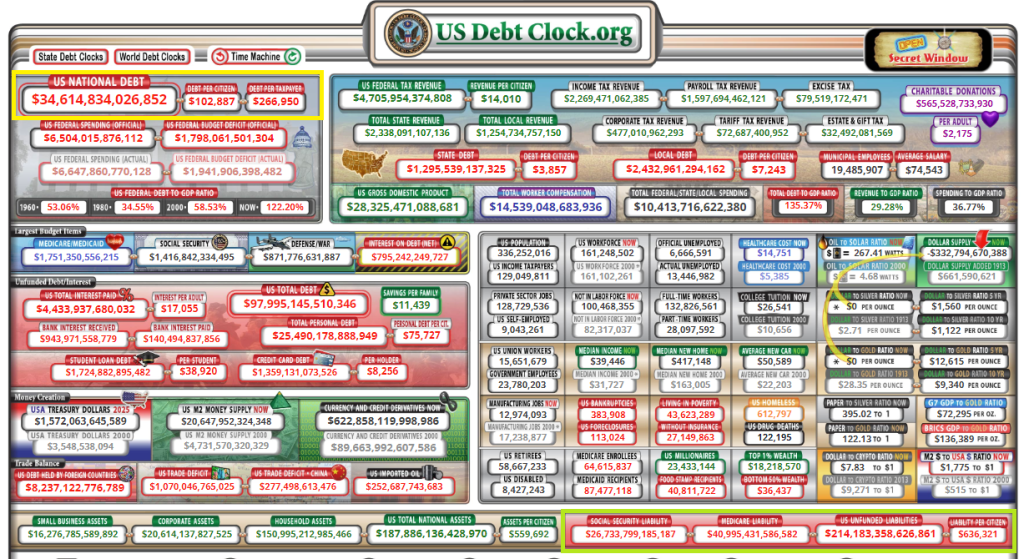
Now for the REALLY bad news. Unfunded liabilities (entitlements) have hit $214+ TRILLION. Given how voters hate paying more in taxes, look for the growing entitlements to add AT LEAST $214 trillion in NEW DEBT which will result in record high interest payments.
Hey big spender! How about NOT spending trilliions while pocketing 10% from foreign enemies?
Congress and The Biden Regime should select the now defunct British beer Watney’s Red Barrell (a truly awful beer) to symbolize their committment (or lack thereof) to fiscal responsibilty.
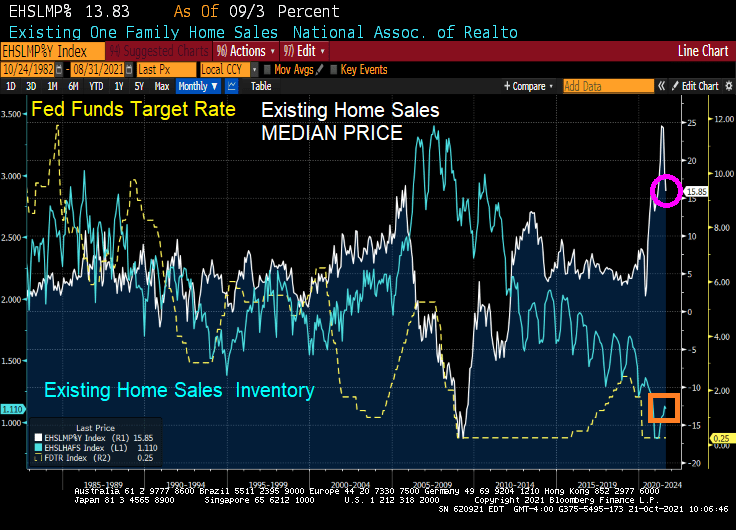
Housing is simply unaffordable under Bidenomics, a strange brew of big corporate green subsidies, political handouts (any wonder why Biden is forgiving student loans in an election year?) and bad Fed policy errors.
But young Americans don’t always have a sugar daddy like Hunter Biden has who are willing to pay for rent for political parasites like those in Washington DC.
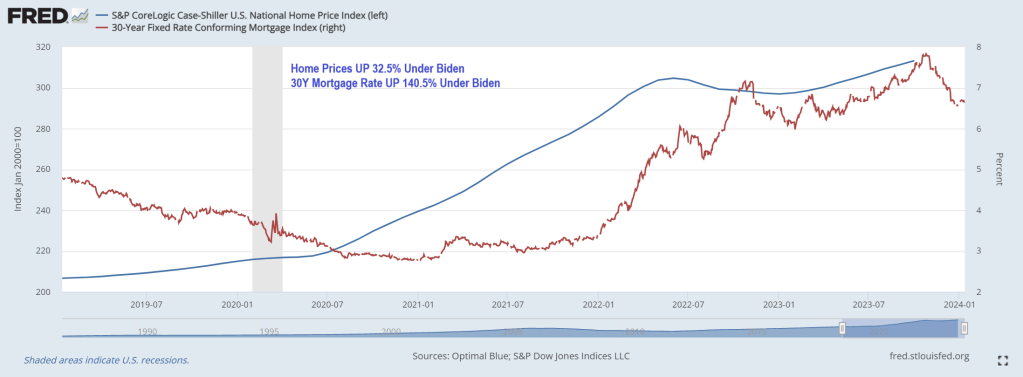
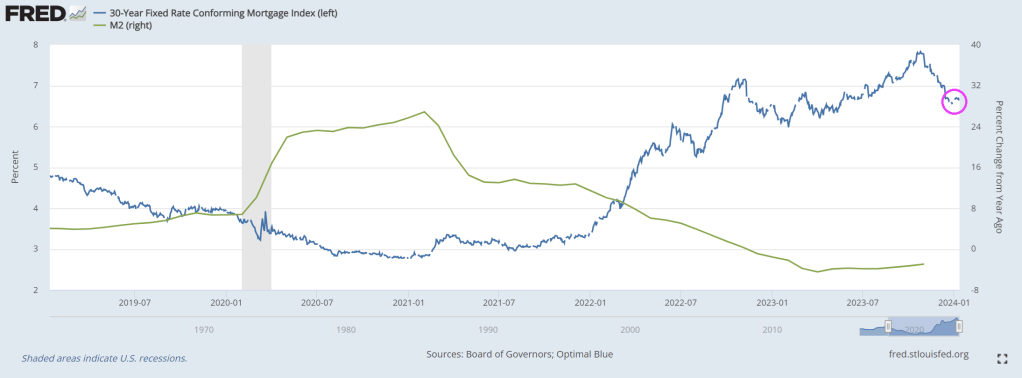
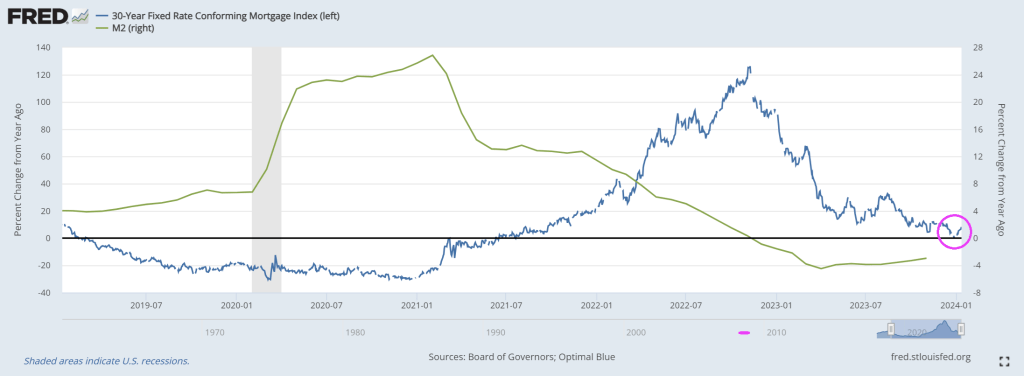
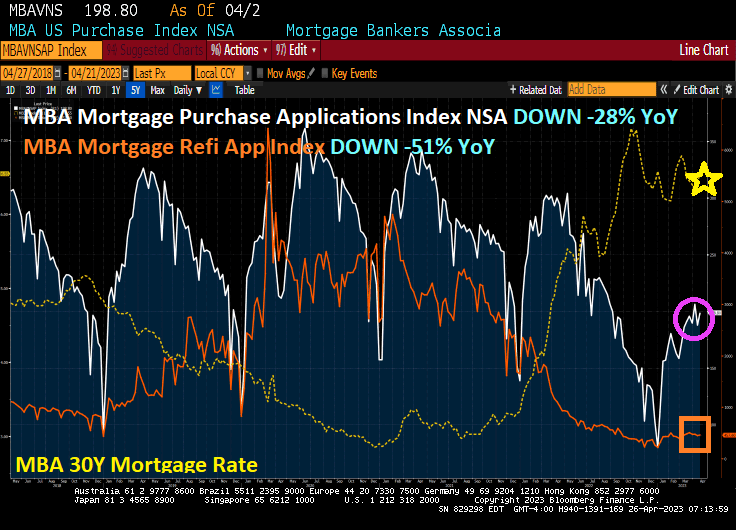
Young adults used to dream of moving out of their parents’ homes and into their own apartments, but living alone has become a luxury not everyone can afford. Not surprising, since home prices under Biden have risen 32.5% while 30-year mortgage rates are up a staggering 140.5% under Clueless Joe.
But in growth terms (year-over-year), White House Propagandists Karine Jean Pierre and John Kirby will no doubt focus on the cooling of housing prices and mortgage rates … although both are reaccelerating.
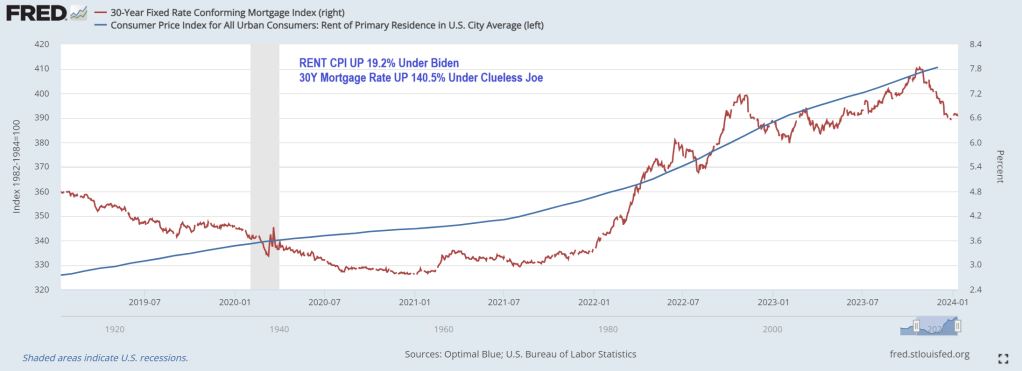
Rent CPI is up 19.2% under Clueless Joe.
How does this impact younger Americans? According to a recent study by Intuit Credit Karma, 31% of Gen Zers are living with their parents because they can’t afford to rent or buy their own place. Overall, 11% of American adults still live at home with their parents.
“The current housing market has many Americans making adjustments to their living situations, including relocating to less-expensive cities and even moving back in with their families,” said Courtney Alev, a consumer financial advocate at Intuit Credit Karma.
Even young adults who live alone are reconsidering their living arrangements because costs are too high.
About a quarter (27%) of Gen Zers reported that they could no longer afford rent and 25% said they’ll have to move back in with family to make ends meet.
Millennials are in the same boat: 30% say rent is unaffordable, and 25% are thinking about moving back in with their parents.
The research is consistent with a 2021 study conducted by the U.S. Census Bureau, which showed that one in three adults ages 18 to 34 live with their parents.
In a 2022 study, Pew Research also found that the percentage of Americans living with their parents has increased steadily since 2000. Pew calls these living arrangements “multigenerational households,” and said young adults ages 25 to 29 are most likely to cohabit with their parents.
Different studies, but all tell the same story: Finances are the top reason young adults are still living with family.
Housing and rental costs rise
It’s hardly surprising that young adults are struggling to make ends meet. Housing costs and living expenses have skyrocketed since the pandemic, and younger generations have faced the most financial hardship.
As Creditnews Research reports, Millennials and Gen Zers have been locked out of homeownership due to rising home prices, elevated interest rates, and stagnant real wages (adjusted for inflation).
For example, in 2023, Millennials accounted for only 28% of homebuyers despite being in their prime home-buying age. Gen Zers barely made a dent in the housing market, accounting for a paltry 4% of all buyers.
According to Fed data, average home prices were $431,000 as of the third quarter of 2023.
The rental market isn’t much better. Although rent costs have declined for three straight months, landlords are still asking for $1,964 per month on average, per Redfin data. Average rents were below $1,650 at the start of Covid.
But the problem of surging rents goes back much longer than that. According to a report from Moody’s Analytics, rent prices grew 135% between 1999 and 2022, while average incomes for all age groups were up 77% over the same period.
In terms of earning potential, younger generations are at the lower end of the totem pole, so they’re more likely to be affected by rising rent prices.
Where’s the “strong economy” everyone always talks about?
While the U.S. economy has steered clear of recession and unemployment remains near historic lows, Americans are still struggling to afford basic expenses. This is especially true for younger generations.
A 2023 study conducted by Deloitte found that more than half of Millennials and Gen Zers were living paycheck to paycheck. Perhaps shockingly, 37% of Millennials and 46% of Gen Z reported taking another part-time or full-time job just to afford their bills.
Working longer hours and barely scraping by is one of the main reasons why younger adults feel they’re worse off financially than their parents were at their age.
An August 2023 study conducted by The Harris Poll found that 74% of Millennials and 65% of Gen Zers believe they are starting further behind financially than previous generations.
“They’re telling us they can’t buy into that American dream the way that their parents and grandparents thought about it—because it’s not attainable,” said The Harris Poll CEO John Gerzema.
Remember, Clueless Joe Biden is in charge!(or Obama, take your pick).
Mortgage applications increased 3.7 percent from one week earlier, according to data from the Mortgage Bankers Association’s (MBA) Weekly Mortgage Applications Survey for the week ending April 21, 2023.
The Market Composite Index, a measure of mortgage loan application volume, increased 3.7 percent on a seasonally adjusted basis from one week earlier. On an unadjusted basis, the Index increased 5 percent compared with the previous week. The Refinance Index increased 2 percent from the previous week and was 51 percent lower than the same week one year ago. The seasonally adjusted Purchase Index increased 5 percent from one week earlier. The unadjusted Purchase Index increased 6 percent compared with the previous week and was 28 percent lower than the same week one year ago.
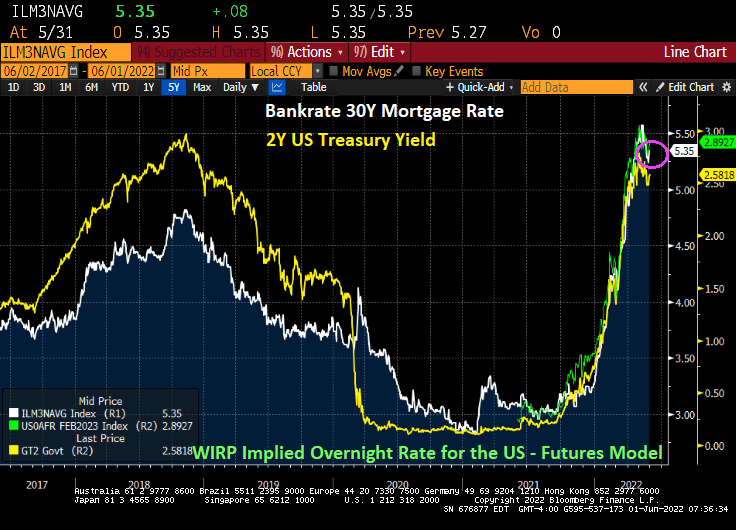
US mortgage rates are up slightly this morning. Bankrate’s 30-year mortgage rate survey is up to 5.29%.
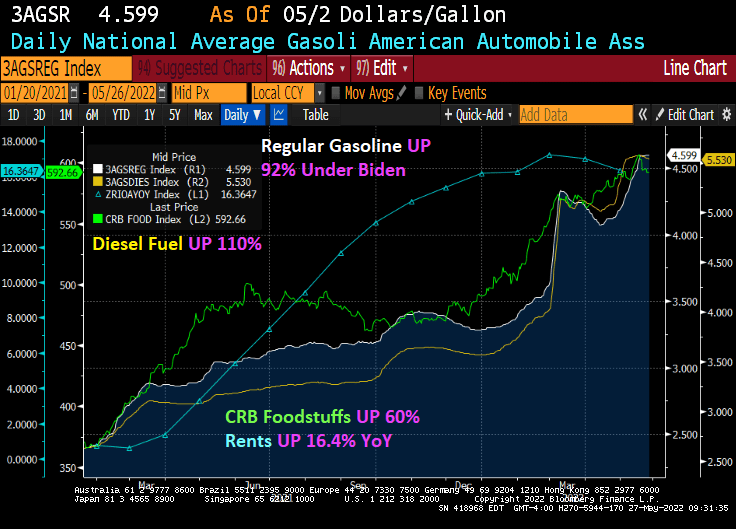
The Biden Scorecard is still a bleak one (for non-elitists). Regular gasoline is UP 92% under Biden, Diesel fuel is UP 110%, foodstuffs are up 60% under Biden, Zillow all-house rents are UP 16.4% YoY.
https://www.redfin.com/news/housing-market-update-pending-sales-up-47pct-from-2019/According to Redfin, forty-four percent more homes are pending sale than at this time in 2019, but only 3% more homes recently hit the market—down from 12% growth over 2019 just 7 weeks prior. As a result of the severe imbalance between the number of homes for sale and the number of buyers, the pace of the market is picking up at a time when it typically slows. A third of homes are finding buyers within a week of hitting the market, up from 30.8% at the end of the summer. This week, we’re comparing today’s market with the pre-pandemic fall market of 2019 to highlight how hot the market remains, even as most measures are settling into typical seasonal patterns.
“Comparing today’s sales and new listings numbers to the 2019 levels helps to reveal the stark shortage of supply we are facing,” said Redfin Deputy Chief Economist Taylor Marr. “The boost of housing supply that came on the market during the summer has already faded away, even as demand tapers off as we expected it to in the fall. Relative to the last ‘typical’ fall of 2019, demand remains steady and strong thanks to the increased urgency many buyers have as mortgage rates inch up. Rising rates also make buyers more price sensitive, so homes that are priced right are increasingly likely to receive offers right away.”
Shortage of supply, indeed. It is a mystery to me why the supply of homes for sale is not matching the demand.
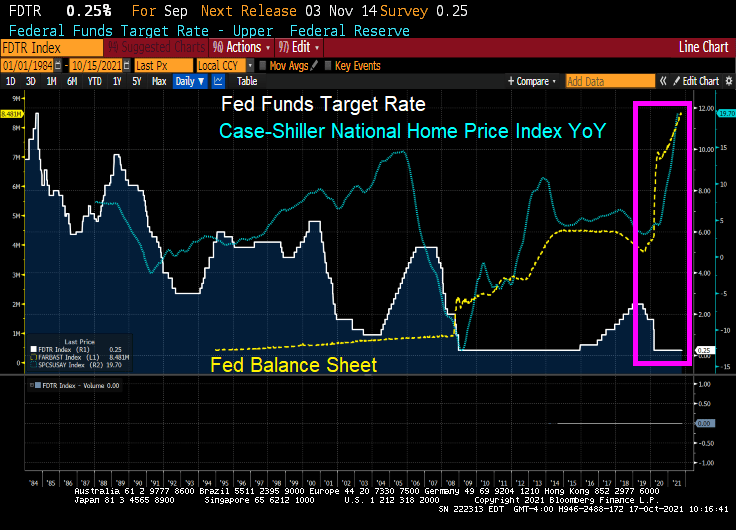
But what happened after 2019? COVID and the entrance of massive Federal Reserve and Federal government stimulus. With limited supply hitting the market, home prices soared with the government stimulus.
We are likely to see rising prices until Federal Stimulypto stops or at least slows.
Powell and The Fed’s policies have veered from their mandate requiring Chairman Powell to meet 350 times with Congress to sell The Fed’s policies.
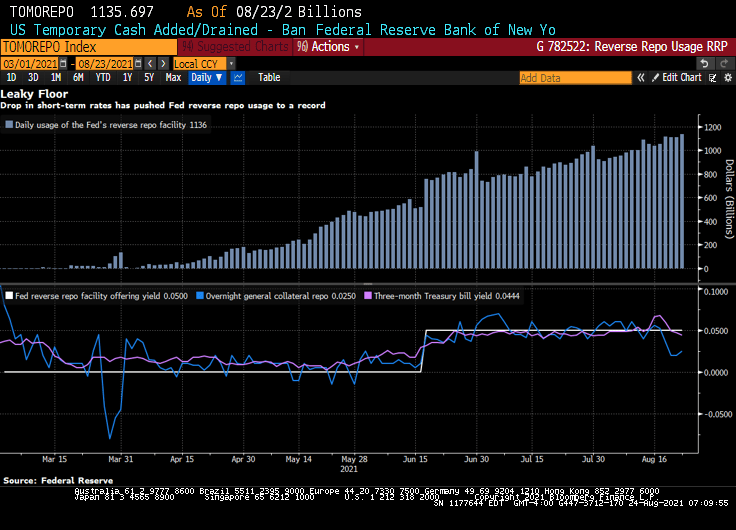
Bloomberg) — The Federal Reserve’s floor for overnight funding markets is proving to be no match for the deluge of cash.
Money-market securities ranging from Treasury bills to repurchase agreements continue to trade below 0.05% — the offering rate on the overnight reverse repo facility, which is supposed to act like a floor for the front end. The Fed at its June meeting had raised the rate by five basis points to help support the smooth functioning of short-term funding markets.
Still, usage of the tool climbed to a record $1.136 trillion on Monday, eclipsing the previous high of $1.116 trillion on Aug. 18.
Demand for the so-called RRP facility has surged as a flood of dollars threatens to overwhelm funding markets. That’s in part a result of the central bank’s long-standing asset purchases and drawdowns of the Treasury’s cash account, which is pushing reserves into the system. As a result, liquidity has been swelling, especially as the Treasury cuts supply to create more borrowing room under the debt ceiling.
The pressure pushing down overnight rates toward zero is proving a major headache for money-market funds. It hampers their ability to invest profitably, and can lead to further disruptions as they begin to waive fees to avoid passing on negative rates to shareholders. A number of firms including Vanguard Group shut down prime money-market funds last year after struggling to cover operating costs in the low-interest-rate environment.
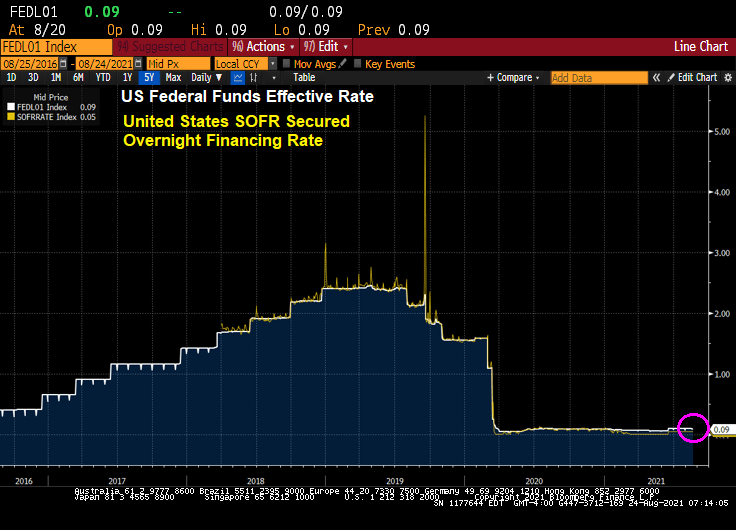
Yes, overnight rates such as the US SOFR rate, are near zero.
Powell’s Charm Offensive in Congress Positions Him to Keep Job
Perhaps that is why Federal Reserve Chair Jerome Powell is acting as a lobbyist with Congress for The Fed’s nontraditional approach to monetary policy.
(Bloomberg) Since he took the helm of the Fed in February 2018, through June of this year, he’s held at least 350 meetings, dinners or phone calls with members of Congress, according to his monthly calendars. That’s almost nine per month, and many of those included more than one lawmaker. The tally doesn’t count at least 16 appearances as chair before numerous congressional committees.
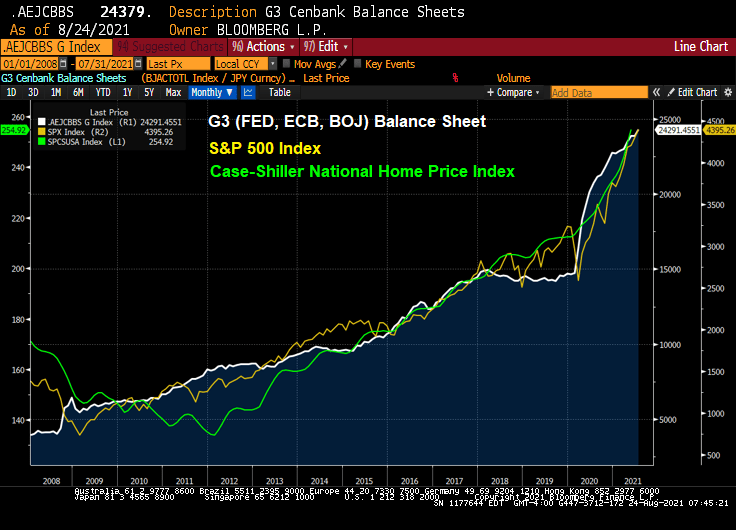
Well, the stock market has zoomed-up since Bernanke and The Fed adopted zero-interest rate (ZIRP) policies and the now famous quantitative easing (QE) policies in late 2008.
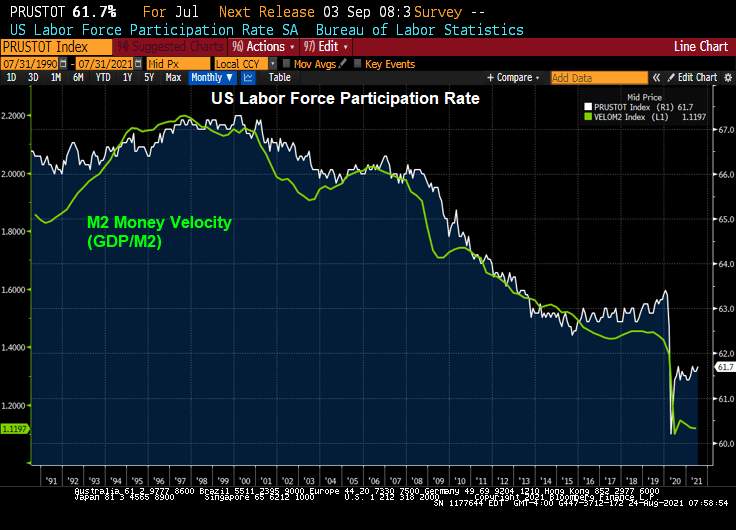
Congress member Alexandria Ocasio-Cortez asked Fed Chair Powell about the Fed helping with US unemployment. We are already at zero rates (on the short-end), and Congress should look at their policies on why labor force participation is slow to recover from the Covid epidemic.
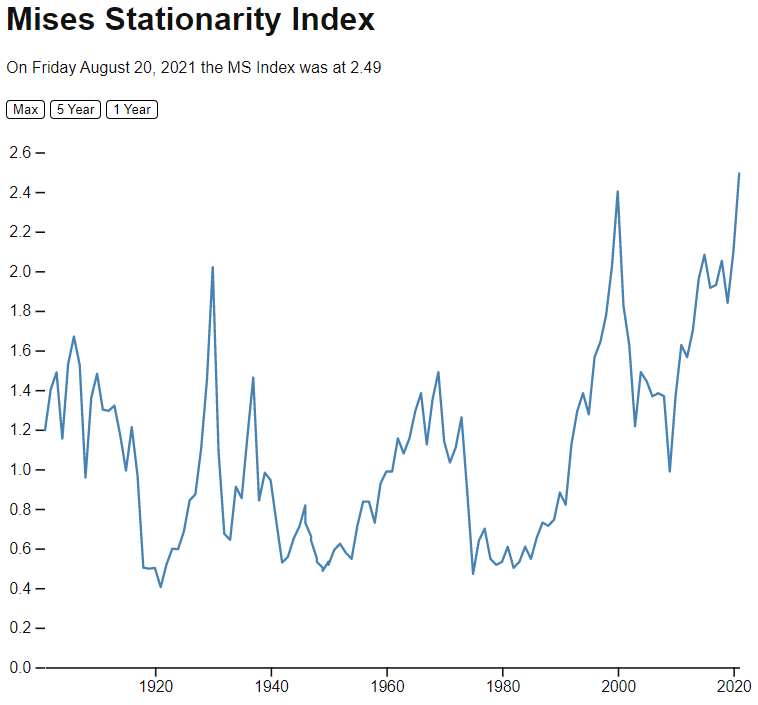
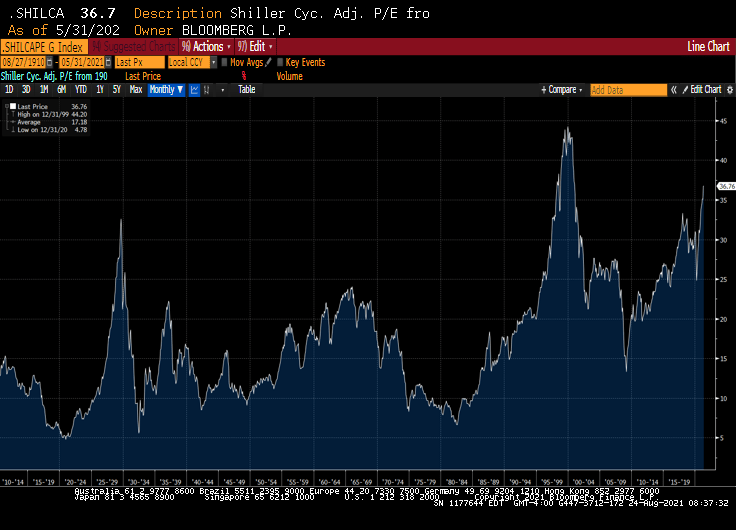
The Mises Stationarity Index is different than the Shiller CAPE index, which is showing equities as being overpriced, but not yet in dot.com bubble zone.


You must be logged in to post a comment.