US Budget Deficit Projected To Be -$20 TRILLION Over Next 10 Years (Biden Ignores The Inflation Tax, Interest Costs On US Debt Forecast To TRIPLE Over Next 10 Years)

President Biden loves to demonize his opponents like Republicans over spending and the Federal budget. Biden argued that his budget won’t increase taxes on Americans making less than $400,000 a year and will ultimately cut the deficit by $2 trillion over the next decade. The president has yet to release his budget plan but has promised to do so by March 9.

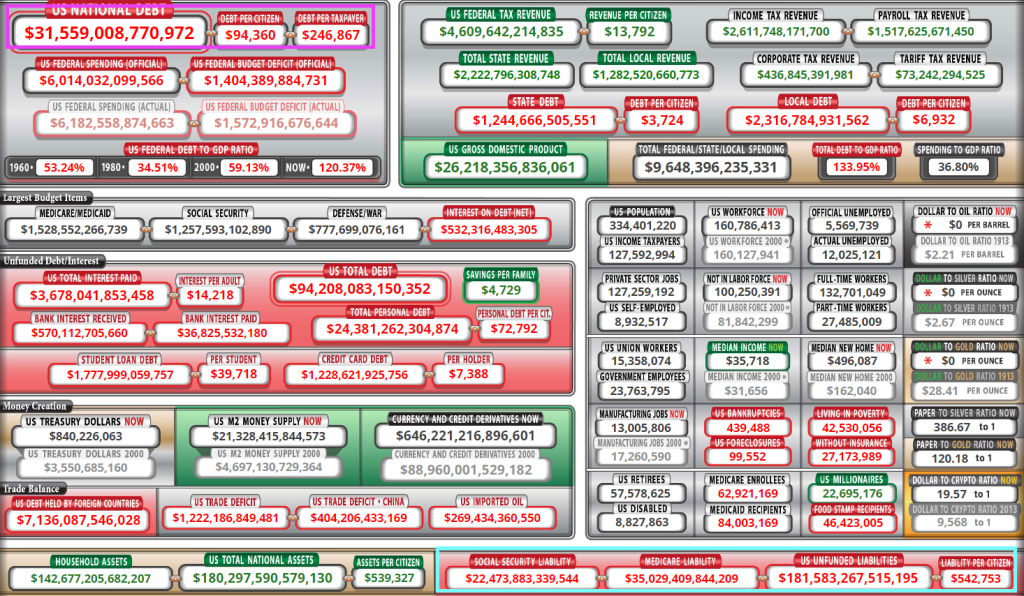
Of course, Biden ignores “the inflation tax” which is crippling American households (negative REAL hourly earnings growth for 22 straight months). And while he won’t raise taxes on Americans making less than $400,000 (he doesn’t have the authority), he loves to spend money like most of Congress. Without tax increases, The Federal Government will have to issue MORE debt and run budget deficits in perpetuity.

Here is the sickening forecast of Federal budget deficits. Budget deficits are forecast to keep rising and are project to hit -$20 TRILLION over the next 10 years.

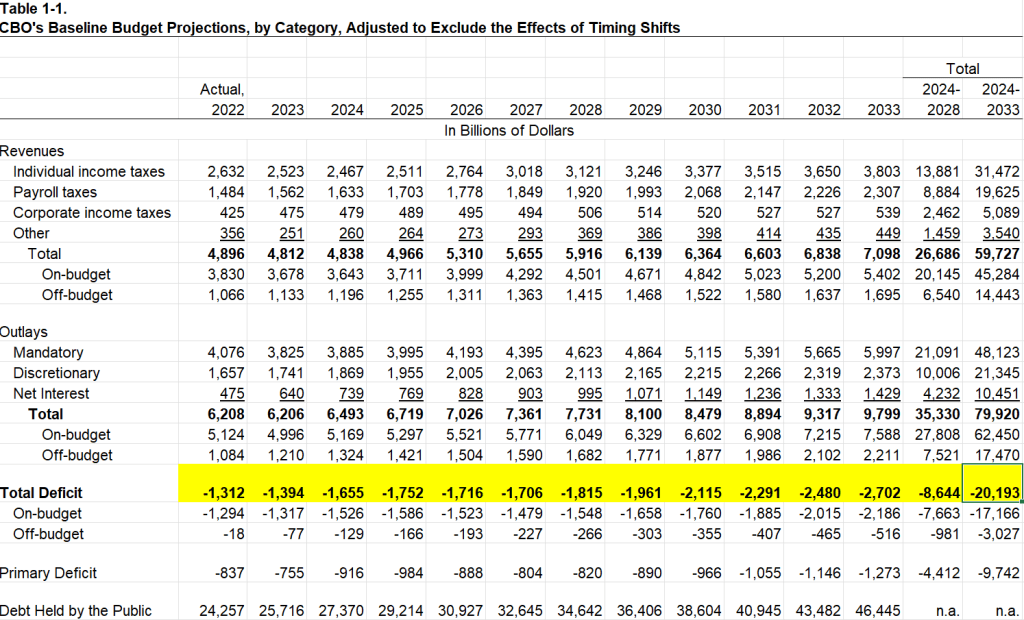
Here is the spreadsheet of projections from the Congressional Budget Office.

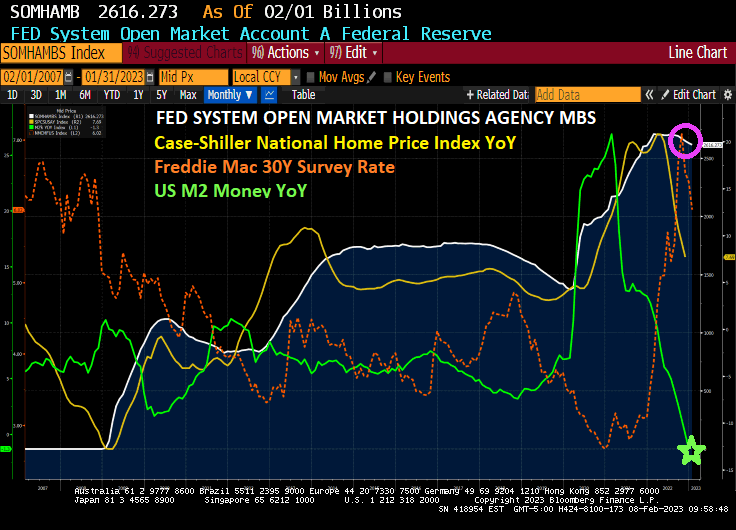
The US is already experiencing irresponsible growth in Federal debt and interest payments on the Federal debt.

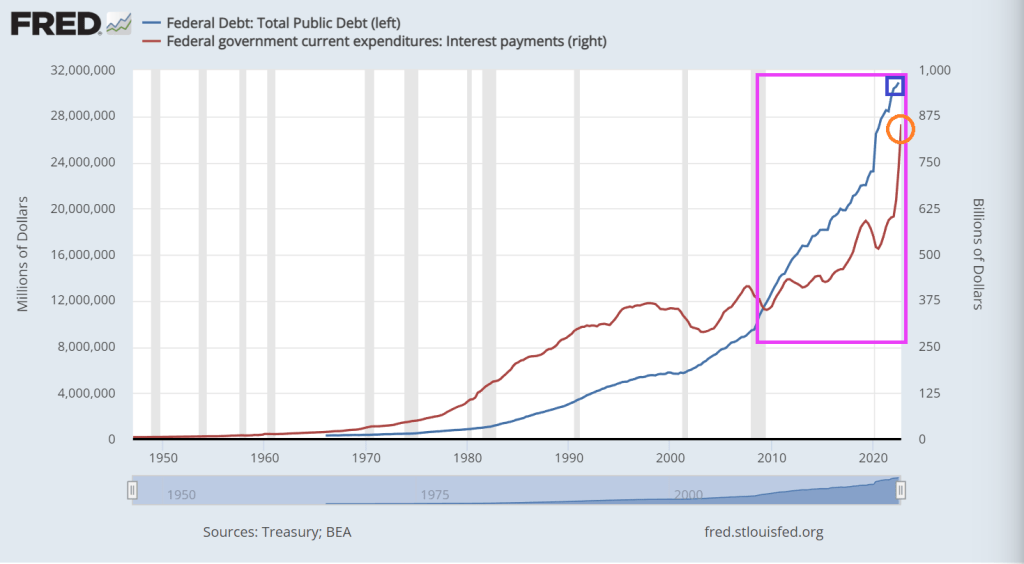
Interest costs will nearly triple in the next decade. The Federal Reserve has increased interest rates eight times since early 2022 to combat high inflation — which has contributed to the significant increase in the federal government’s cost of borrowing. In CBO’s projections, such costs would rise from $475 billion in 2022 to $1.4 trillion in 2033. Over the upcoming decade, CBO projects that net interest payments will total $10.5 trillion; relative to the size of the economy, net interest would grow from 2.4 percent this year to 3.6 percent in 2033. In 2030, the ratio of interest to GDP would total 3.3 percent, the highest recorded since 1940 (the first year for which such data are reported).

And don’t forget that the Federal government (meaning taxpayers) are on the hook for $181.6 TRILLION in unfunded liabilities.

Here is my black German Shepherd listening to me talk about the dangers facing the US economy.

US Mortgage Applications Decline 7.7% From Last Week As Fed Continues Their Counterattack On Inflation (Purchase Apps Down 43% From Last Year, Refi Apps Down 76%)

US inflation is causing The Federal Reserve to raise interest rates, and mortgage applications are suffering.

Mortgage applications decreased 7.7 percent from one week earlier, according to data from the Mortgage Bankers Association’s (MBA) Weekly Mortgage Applications Survey for the week ending February 10, 2023.

The Refinance Index decreased 13 percent from the previous week and was 76 percent lower than the same week one year ago. The seasonally adjusted Purchase Index decreased 6 percent from one week earlier. The unadjusted Purchase Index decreased 5 percent compared with the previous week and was 43 percent lower than the same week one year ago.

The MBA contract rate rose 3.4% from 6.18% to 6.39% as The Fed tightens.

And if you believe the Taylor Rule (as opposed to The Fed’s current politically-based decisions), The Fed’s target rate should be 10.15% and The Fed is less than half way there at 4.75%.

The Fed is expected (by investors in Fed Funds Futures) to rise to 5.283% by the July FOMC meeting, then decline to under 5% by January ’24.

Speaking of Fed rate hikes, January’s red hot retail sales (up 3% MoM) is surely going to drive inflation UP and The Fed will keep raising rates.

Inflation Nation! US REAL Average Hourly Earnings Negative For 22 Staight Months In January As Inflation Heats Up … Again (CPI Rises 0.5% MoM, Food Rises 11.3% YoY)

The January US inflation numbers are out and they were grim.

US REAL average hourly earnings fell … again … to -1.8% year-over-year (YoY) from a revised -1.6% YoY in Deember. That makes 22 straight months of negative hourly earning growth.

CPI Month-over-month (MoM) was revised upward for December, and increased from 0.1% in December to 0.5% in January. CORE CPI remained unchanged from the upward revision in December to 0.4% MoM.

Components of inflation include FOOD AT HOME (up 11.3% YoY), utility (piped) gas service (up 26.7% YoY) and shelter (up 7.9% YoY). So, the middle-class inflation tax (food, heating, housing) remains high.

Do I detect a trend in shelter inflation??

Hey, I thought Treasury Secretary Janet Yellen said inflation was transitory. 22 straight months of negative hourly earnings growth seems more permanent than transitory.

Debt Star! US Debt Has Increased $22.8 TRILLION (264%) Since Pelosi Became House Speaker In 2007 (M2 Money Increased By 200% Since 2007 While M2 Money Velocity Collapsed)

Nothing has been the same since Nancy Pelosi (CA-D) became Speaker of the House in January 2007. In fact, US public debt was at $8.68 trillion when she was handed the gavel and US public debt now sits at $31.55 trillion. That is a whopping 264% increase in the nation’s debt under free-spending SanFranNan. To Pelosi, there is no such thing as too much debt.

To be fair, Pelosi had plenty of help. We had Barack Obama and Joe Biden assume the Presidency in 2009 and in between we had RINOs (Republicans in name only) John Boenher and Paul Ryan as House speakers. In the Senate, the US has had Harry Reid (NV-D), Chuck Schumer (NY-D) and breifly Mitch McConnell (KY-R) as majority leaders. Of course, he had Donald Trump as President for 4 years then a return to the Obama-Biden Presidency with Old Joe as President for the past 2 years.

This chart show how deranged Congress and the Administration became since 2007. On October 3, 2008, President George W. Bush signed the $700 billion Emergency Economic Stabilization Act (EESA) of 2008 after Treasury Secretary Henry Paulson asked Congress to approve a bailout to buy mortgage-backed securities that were in danger of defaulting.

I find it sad that a House panel voted to designated Pelosi as House Speaker Emerita for her “leadership” in helping to spend the US into bankruptcy. Look at the trajectory of public debt since Pelosi assumed the position of Spender of The House in 2007.

Since 2007, the US has expereienced a housing bubble burst and ensuing financial crisis (2008/2009), then a Covid economic shutdown in 2020 requiring (in the mind of Statists) massive Federal spending in the form of Covid Relief (aka, the American Rescue Plan) for $1.9 TRILLION, then Infrastructure Spending bill for $1 TRILLION, the Inflation Reduction Act (really a green energy spending bill dressed up as an inflation reduction measure) and the infamous pork-laden Omnibus bill. All this Federal spending has driven up M2 Money by 200% since Pelosi first became House speaker.

Look at the chart of M2 Money Velocity (GDP/M2 Money) since Pelosi became House Speaker. It has collapsed.

Pelosi is also notable for her “You have to pass the bill to see what’s in it” speech on the Affordable Care Act and childishly tearing up on camera a copy of Donald Trump’s State of the Union address.

Meanwhile, the US has $181.5 Trillion in UNFUNDED LIABILITIES that will require MORE debt to be issue. Social Security unfunded liability is now $22.46 trillion and Medicare unfunded liability is up to $35 trillion. But if you dare mention “reform” to these massive entitlement boondoggles, President Biden and Senate Majority Leader Chuck Schumer will say “Republicans want to take away your Social Security!” That isn’t what Rick Scott (FL-R) said.

Unfunded liabilities per citizen is now $542,457. I propose that all illegal immigrants crossing the Mexican border (or Canadian border) per forced to pay their share of unfunded liabilities as an entry fee..

While Congress debates cutting spending (Hint: Childish Biden and Schumer said no to any cuts to spending), the US Debt Star gets closer to completion.

Don’t Be Misled By The Low US Unemployment Rate, It Goes Low Just Prior To A Recession (Treasury Curve Remains Deeply Inverted, Mortgage Rates Rise)

Biden’s State of the Union address saw him bragging about his record job creation (actually, it was the private sector, not Biden than created jobs) and historic unemployment rate. What Biden didn’t mention (along with not discussing the porous Mexican border with fentanyl pouring across or why he failed to shoot down a Chinese spy balloon until after it has passed over numerous military reservation) is that the unemployment rate always hit a low point just prior to a recession.

So, here we sit at 3.4% unemployment. But we also see the US Treasury yield curves (10Y-3M and 10Y-2Y) remaining deeply inverted.

The US Treasury 10-year yield is up 5.5 basis points today.

And Bankrate’s 30-year mortgage survey rate is up slightly today.

Help US, McCarthy! Price of Insuring Against US Debt Default Remains Elevated As No End In Sight (Effective Rate Of Interest On US Mortgage Rate Rises)

Everyone seems to have amnesia about Joe Biden’s hatred of Social Security and Medicare. He has tried to cut Social Security, Medicare and Veteran’s benefits as a US Senator. In addition, it was Biden that led the charge to TAX Social Security benefits for seniors. Now Biden has pivoted and is claiming that Republicans are the ones that want to cut Social Security. Wow. Biden simply goes where the political winds blow.

Here is where we set today. The cost of insuring for a US debt default remains elevated as the US has hit its statutory debt limit. This is happening at the effective rate of interest on US mortgage debt is rising.

Help us McCarthy! Because Biden and Schumer don’t want to cut ANY spending.

We need somebody like Mr. Garvey from Key and Peele to lead the debt ceiling debate.

But never fear! Congress LOVES to spend your money, so will eventually raise the debt ceiling.

Fragility! The Federal Reserve Is Slow-Walking Its Shrinking Of Mortgage-backed Securities As M2 Money Growth Goes Negative (Mortgage Purchase Demand Down -37% Since Last Year And Down -45% Since February 5, 2021)

Starting in 2009 with the housing bubble burst and ensuing financial crisis, The Federal Reserve bought agency mortgage-backed securities (MBS) in an effort to provide stability to the then suffering housing and mortgage markets. Flash forward to today and The Federal Reserve still has $2.62 TRILLION in Agency MBS in its System Open Market holdings. And declining very slowly.

All this is happening as M2 Money growth YoY has gone negative and both mortgage rates and home price growth are slowing.

Is the US mortgage market that fragile that requires The Fed to support it?

The answer is yes if we look at the Mortgage Bankers Association weekly applications index. The Refinance Index increased 18 percent from the previous week and was 75 percent lower than the same week one year ago. The unadjusted Purchase Index increased 4 percent compared with the previous week and was 37 percent lower than the same week one year ago.

I noticed that Biden didn’t mention how mortgage purchase applications since he was installed as President have fallen -45%. Mortgage refi applications have dropped -88% since February 5, 2021.

At least the US house payment to income ratio has declined since the peak. But still higher than at the peak of the US housing bubble in 2006.

US Treasury’s Disastrous 3-Year Auction! High Rate Rises To 4.073% As Allotment To Dealers And Brokers Collapses (Stop Through Yield Crashes To Lowest Level In Years)

After Jerome Powell raved about the strong US labor market and oddly ignored the staggering crowding-out of US interest payments on its massive debt, the US Treasury’s 3-year debt auction was … a Hinderburg moment.

First, the high yield at today’s auction of 3-year Treasury notes was 4.073%. This occured as the allotment to brokers and dealers collapsed along with M2 Money growth YoY.

Then we have this horrible chart of the 3Y auction stop through, crashing into uncharted waters. A stop-through indicates when the highest yield the Treasury sold in the auction is below the highest yield expected when the auction began – the “when issued” level.

Here is the rest of the auction story.

Strange Days! US Adds 517k Jobs In January While ADP Adds Only 106k Jobs (Avg Hourly Earnings At 4.4% YoY While Headline Inflation At 6.5%)

Strange days indeed!

Today’s jobs report from the Bureau of Labor Statists (BLS) was stunning. 517k jobs added! Very strange since the ADP jobs added report on Febuary 1st was only 106k. THAT is a huge discrepancy (probably a seasonal adjustment in the BLS reporting).

Average hourly earnings rose to 4.4% YoY. Too bad headline inflation is still roaring at 6.5%. So, the inflation tax is still overwhelming wage growth.

The spread between the January jobs report (BLS) and the ADP jobs added report (ADP) is similar to the infamous jobs report that the Philly Fed “corrected” (orange circle).

Here is the summary of the BLS numbers.

And on the strange jobs report, US Treasury 10-year yields are up 10+ basis points.

Where were the jobs added? How about “Hey Bartender!” since leisure and hospitality added 128k jobs in January.

  • Leisure and hospitality added 128,000 jobs in January compared with an average of 89,000 jobs per month in 2022. Over the month, food services and drinking places added 99,000 jobs, while employment continued to trend up in accommodation (+15,000).
  • In January, employment in professional and business services rose by 82,000, led by gains in professional, scientific, and technical services (+41,000). Job growth in professional and business services averaged 63,000 per month in 2022.
  • Government employment increased by 74,000 in January. Employment in state government education increased by 35,000, reflecting the return of university workers after a strike.
  • Health care added 58,000 jobs in January. Job growth occurred in ambulatory health care services (+30,000), nursing and residential care facilities (+17,000), and hospitals (+11,000).
  • Employment in retail trade rose by 30,000 in January, following little net growth in 2022 (an average of +7,000 per month). In January, job gains in general merchandise retailers (+16,000) and in furniture, home furnishings, electronics, and appliance retailers (+7,000) were partially offset by a decline in health and personal care retailers (-6,000).
  • Construction added 25,000 jobs in January, reflecting an employment gain in specialty trade contractors (+22,000). Employment in the construction industry grew by an average of 22,000 per month in 2022.
  • In January, transportation and warehousing added 23,000 jobs, the same as the industry’s average monthly gain in 2022. Over the month, employment in support activities for transportation increased by 7,000.
  • Employment in social assistance increased by 21,000 in January, little different from the 2022 average gain of 19,000 per month.
  • Manufacturing employment continued to trend up in January (+19,000). In 2022, manufacturing added an average of 33,000 jobs per month.
  • Employment showed little change over the month in other major industries, including mining, quarrying, and oil and gas extraction; wholesale trade; information; financial activities; and other services.

The source of the jobs miracle? Changes in how jobs are measured.

Changes to The Employment Situation Data |
| |
| Establishment survey data have been revised as a result of the annual benchmarking |
| process, the NAICS 2022 conversion, and the updating of seasonal adjustment factors. |
| Also, household survey data for January 2023 reflect updated population estimates. |
| See the notes at the end of this news release for more information.
|
|_________________________________________________________

Challenger Job Cuts Rise 440% In January As Fed Liquidity Shrinks (US Treasury 10Y Yield Down -3.5 BPS)

President Biden had better give his State of the Union Address before the economy worsens any more.

In January, the Challenger, Gray and Christmas jobs cuts index was a doozy. Jobs cuts rose 440%. This is happening as The Federal Reserve keeps its feet on the monetary brake pedal.

The Challenger report shows a big jump of 135.8 percent in layoff intentions to 102,943 in January, up from 43,651 in December and 440.0 percent higher than the 19,064 in January 2022. Many of the job cuts are in the tech sector, but job cuts are now spreading across the economy as a recession looms.

This morning, the US Treasury 10-year yield is down only -3.5 basis points, but it is Europe where the action is. UK is down -16.2 basis points and Italy is down -14.8 bps. UPDATE: US 10Y yield down -5.3 BPS, Italy 10Y down -29 bps.