As Americans are painfully aware, inflation is the highest in 40 years prompting The Federal Reserve to remove the massive punch bowl. In fact, Federal Reserve Governor Christopher “Fats” Waller backed raising rates by 75 basis points this month.
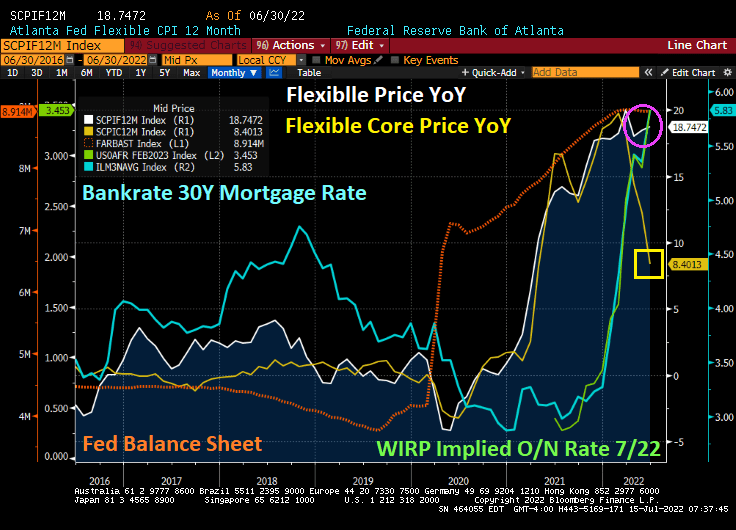
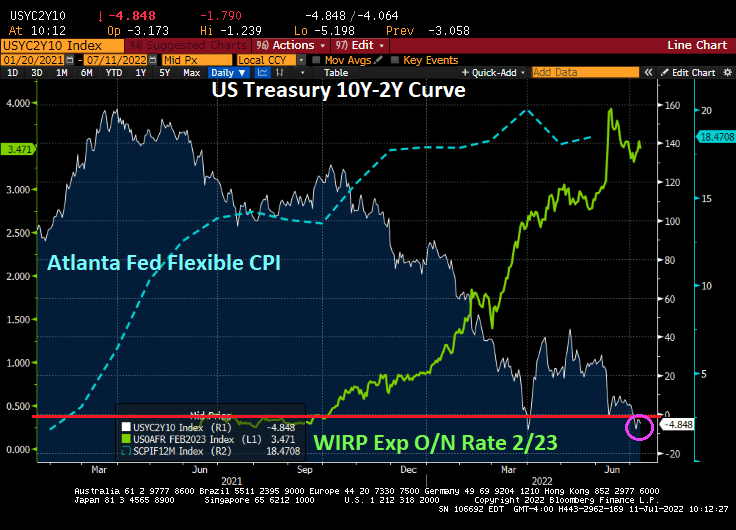
How hot was the recent inflation report? The Atlanta Fed’s flexible price index rose to 18.74% YoY. On the other hand, the CORE flexible price index (less energy and food) plunged to 8.46% YoY. The 30-year mortgage rate from Bankrate rose slightly to 5.83% as the implied overnight rate for the July FOMC meeting rose to 3.45%.
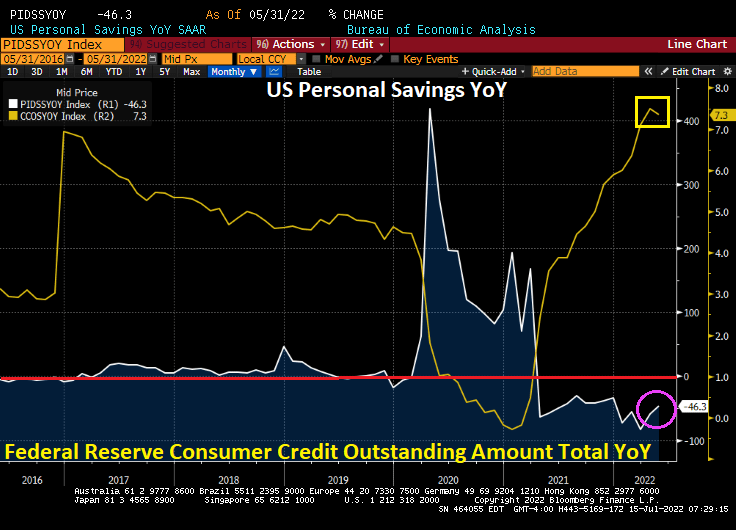
Inflation is ravaging consumers with the savings rate falling by -46.3% YoY while consumer credit rose 7.3% YoY. Yes, thanks to high inflation, consumers are saving less and borrowing more.
When even CORE flexible price inflation is 8.40% YoY, you know that The Fed and Federal government have made serious policy errors.
Face it. The Biden Administration has little interest in trying to increase the supply fossil fuel energy which would anger his “green” base (like building more refineries or allowing for more crude oil and natural gas exploration). So, the burden of “inflation fighting” falls on the frail shoulders of The Federal Reserve.
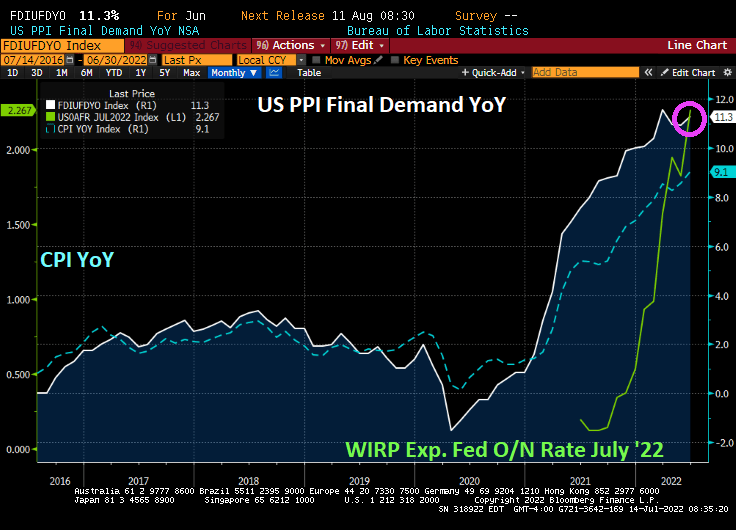
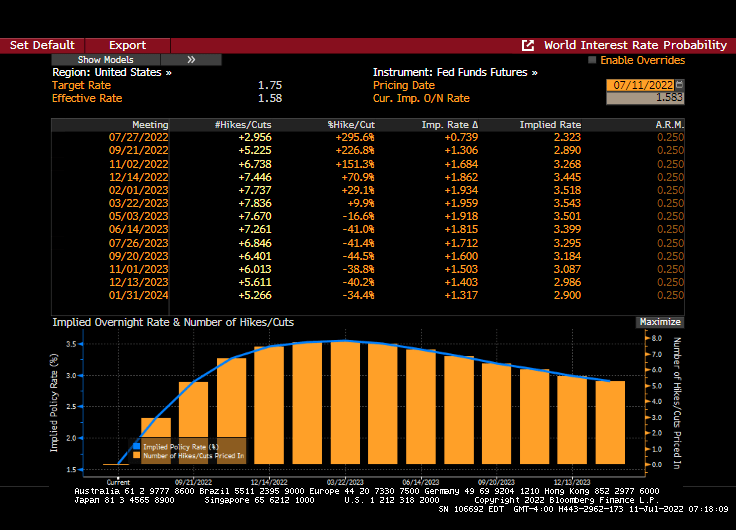
Given today’s US Producer Price Index Final Demand prices rising +11.3% YoY in June, it seems that The Fed has not been able to extinguish the “Tower of Inflation.” But, Fed Funds Futures are pointing to a near 100 basis point (or 1%) increase in The Fed Funds target rate at the July 27th Fed Open Market Committee (FOMC) meeting.
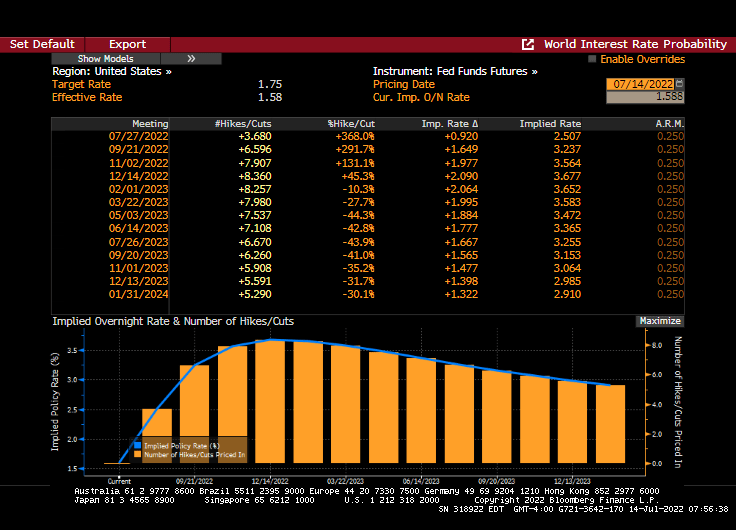
The Fed Funds Futures Data points to a +0.920 (almost 1%) increase at the July 27th FOMC meeting. Followed by rate cuts.
And with the fear of a near 100 basis point increase, today’s stock markets are a sea of red.
It is up to Fed Chair Jerome Powell and policy error brigade to extinguish price increases caused by 1) bad Biden energy policies and 2) too much spending by Biden and Congress. It is like trying to wave-down the Super Chief train with a cigarette lighter.
Yet, the Frail Fed will try to waive down The Super Chief inflation engine with Fed Fireballs. Aka, rate increases of 100 basis points.
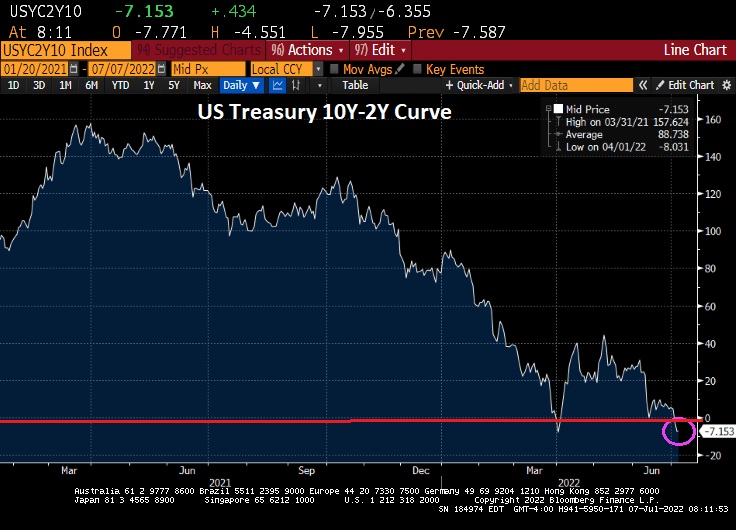
The US Treasury 10Y-2Y yield curve steepened after Biden’s inauguration as President, a sign of economic optimism. Then reality began to dawn when inflation began to surge (blue line). Then The Fed stepped in to combat inflation by signaling an increase in their target rate (green line). The result? The 10Y-2Y Treasury curve is inverted at -4.85 BPS, generally an indicator of an impending recession.
But never fear! The Feral Reserve is expected to reverse its rate increases by March 2023.
So, it looks like The Fed will be returning to its “low rider” rate policies in early 2023.
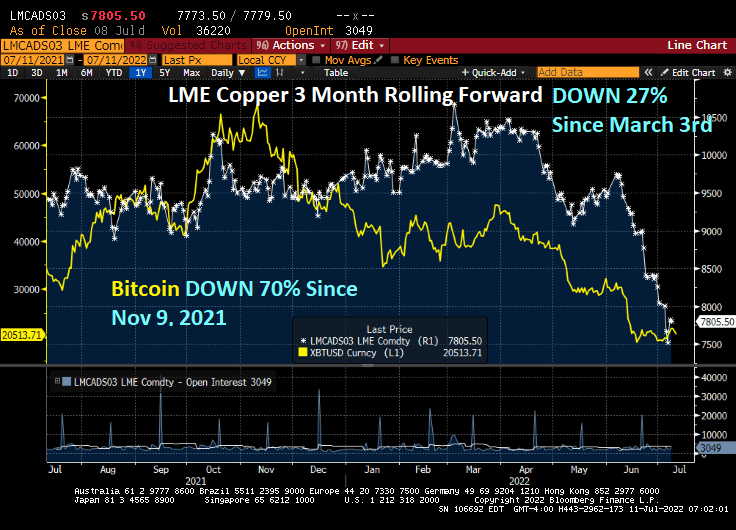
Copper, one of the economic measures of a growing economy, is down -27% since March 3, 2022 as recession looks more likely.
Let’s compare copper with another famous asset, Bitcoin. Bitcoin, a cryptocurrency, is down 70% since November 9, 2021.
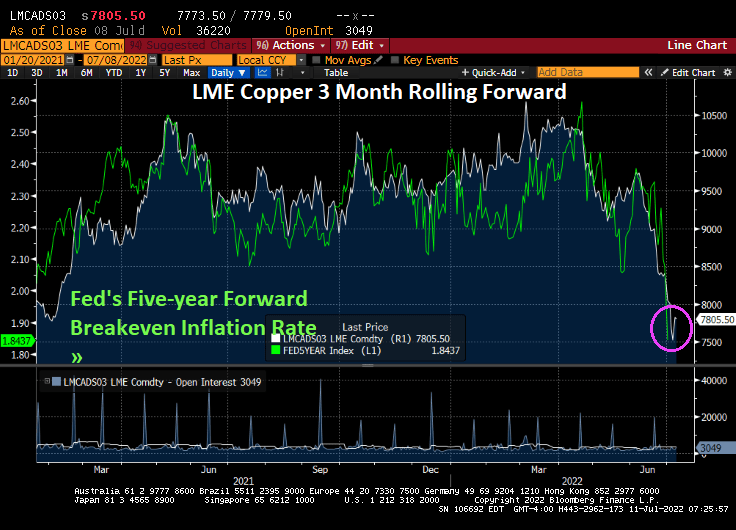
As I discussed yesterday, The Fed’s five-year forward breakeven inflation rate has plunged to its lowest levels under Biden as the global economy is slowing.
Notice that copper prices fit pretty well with The Fed’s 5-year breakeven inflation rate.
It looks like The Fed is killing-off the economy in their quest to tame inflation.
US inflation is the highest in 40 years, yet inflation may be slowing as 1) The Fed cranks up interest rates and 2) the global economy is slowing.
US inflation data in the coming week may stiffen the resolve of Federal Reserve policy makers to proceed with another big boost in interest rates later this month.
The closely watched consumer price index probably rose nearly 9% in June from a year earlier, a fresh four-decade high. Compared with May, the CPI is seen rising 1.1%, marking the third month in four with an increase of at least 1%.
While persistently high and broad-based inflation is seen persuading Fed officials to raise their benchmark rate 75 basis points for a second consecutive meeting on July 27, recession concerns are mounting. There are signs, though, that price pressures at the producer level are stabilizing as commodities costs — including energy — retreat.
But the expectations of inflation, as measured by The Fed’s 5-year forward breakeven inflation rate, just crashed to 1.8437%.
The breakeven inflation rate is a market-based measure of expected inflation. It is the difference between the yield of a nominal bond and an inflation-linked bond of the same maturity.
The USD Inflation Swap Forward 5Y5Y is also falling like a rock as The Fed hikes their target rate (green line).
Could it be that inflation is cooling with Fed rate hikes (but not the shrinking of their $8 trillion balance sheet)?
Currently, Fed Funds Futures are pointing to a Fed target rate of 3.552% by February 2023. And with that, Bankrate’s 30-year mortgage rate rose to 5.75%. Once again, like velociraptors from Jurassic Park, The Fed’s balance sheet is still out in force.
Fed Chair Jerome Powell and Atlanta Fed President Raphael Bostic are keeping The Fed’s balance sheet at near $9 trillion as they hunt assets to inflate.
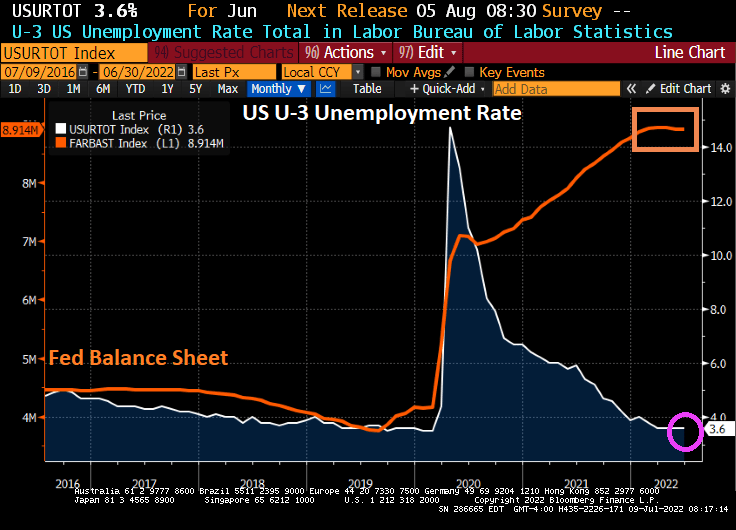
Take the US U-3 unemployment rate. The Biden Administration is proud of the unemployment rate of 3.6%. But if you look at the chart of unemployment relative to The Fed’s balance sheet expansion due to Covid lockdowns, there is still almost $9 trillion of Fed stimulus outstanding.
Of course, the lockdowns were pure economy killers, so opening the economies again led to the unemployment rate falling to 3.6% which is still higher than before the Covid outbreak. But The Federal Reserve has been painfully slow at shrinking its balance sheet, leaving almost $9 trillion in monetary stimulus outstanding.
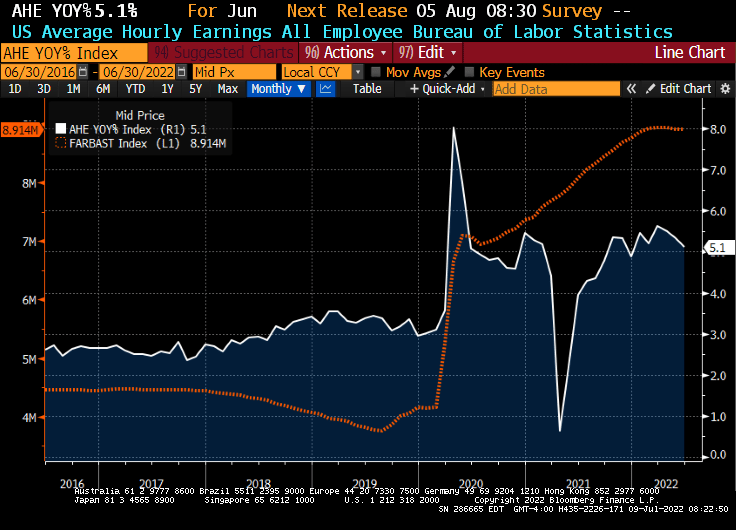
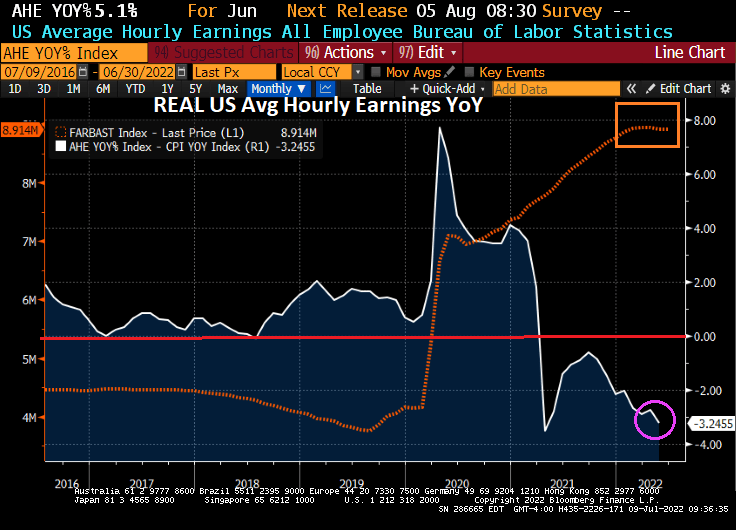
Take average hourly earnings growth. The media is all smiles as US wage growth declined to 5.1%, much higher than pre-Covid.
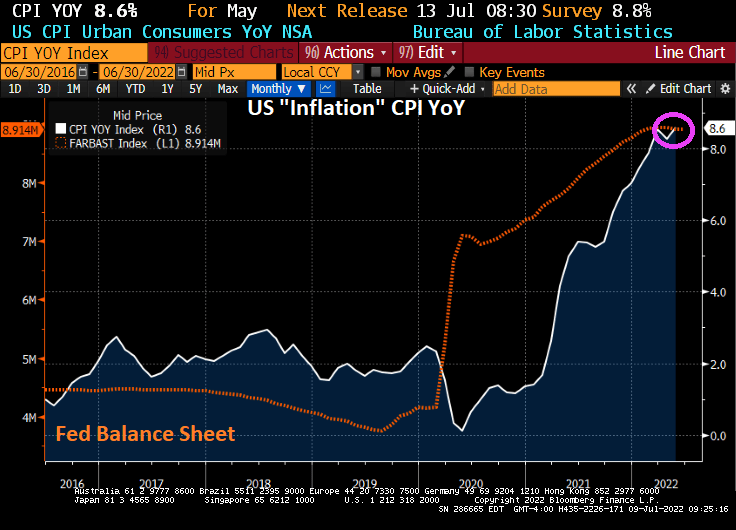
Then we have inflation, at 40-years highs thanks to massive Fed stimulus (and Federal spending).
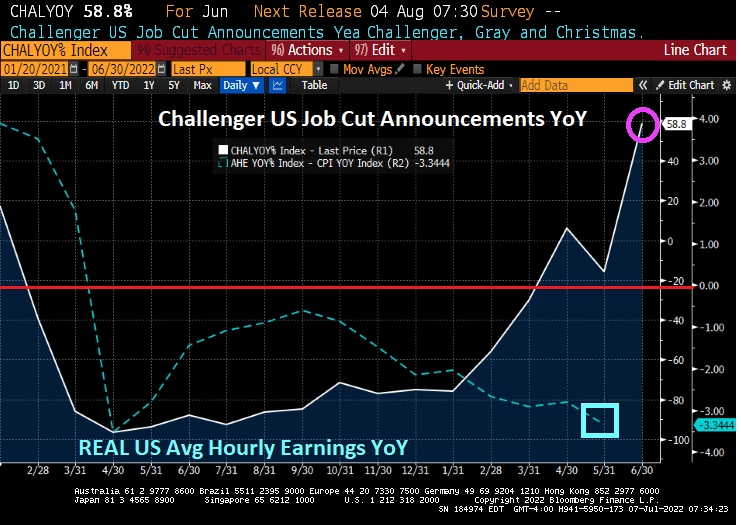
And if we deduct inflation from average hourly wage growth, we see REAL wage growth declining at a -3.25% YoY clip.
Lastly, we have the US Dollar. Nothing has been the same since the financial crisis of 2008 and the entrance of The Federal Reserve distorting the economy and prices. Not to mention the US Dollar.
The Fed leaving its monetary stimulus out in force for so long is a major policy error. So what happens when The Fed actually gets serious about withdrawing the monetary stimulus (likely after the midterm elections)?
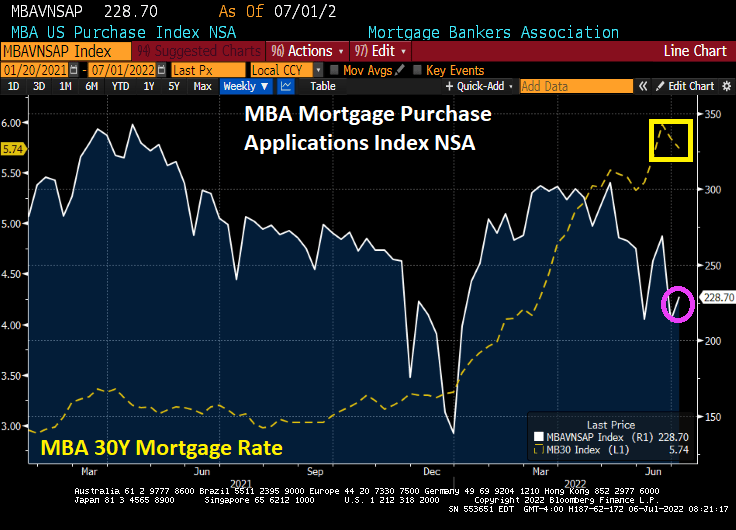
Well, this is one way to get inflation under control … crash the economy. And inflation fears growing, we are seeing mortgage rates declining and mortgage applications increasing.
Mortgage applications decreased 5.4 percent from one week earlier, according to data from the Mortgage Bankers Association’s (MBA) Weekly Mortgage Applications Survey for the week ending July 1, 2022. This week’s results include a holiday adjustment to account for early closings the Friday before Independence Day.
The seasonally adjusted Purchase Index decreased 4 percent from one week earlier. The unadjusted Purchase Index increased 7 percent compared with the previous week and was 17 percent lower than the same week one year ago.
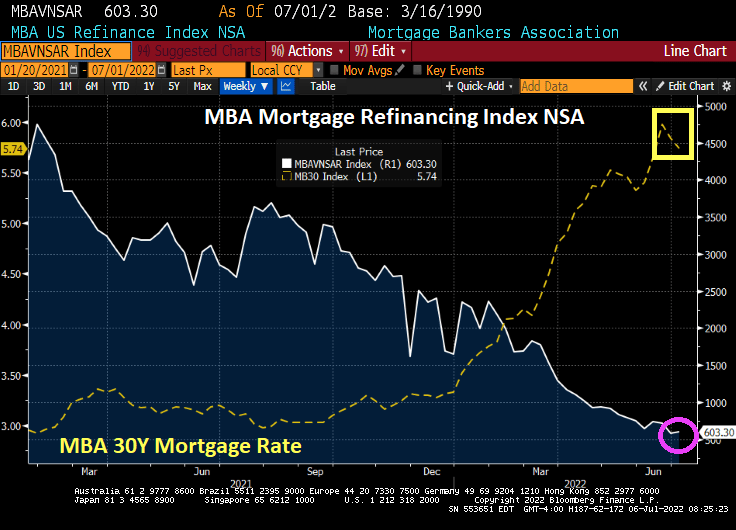
The Refinance Index decreased 8 percent from the previous week and was 78 percent lower than the same week one year ago.
TED refers to the difference between the three-month Treasury bill and the three-month LIBOR based in U.S. dollars, a measure of fear in the market.
The 3-month TED spread is rising awfully fast. A sign of impending recession.
US bank credit default swaps (CDS) are rising fast as inflation gets ugly.
The US Treasury 10Y-3M curve is bumping against the zero barrier.
I am still shaking my head at President Biden chastising gasoline stations for not lowering prices at the pump when refiners are near full capacity and the Biden Administration is doing nothing to increase the supply of US-source non-green energy.
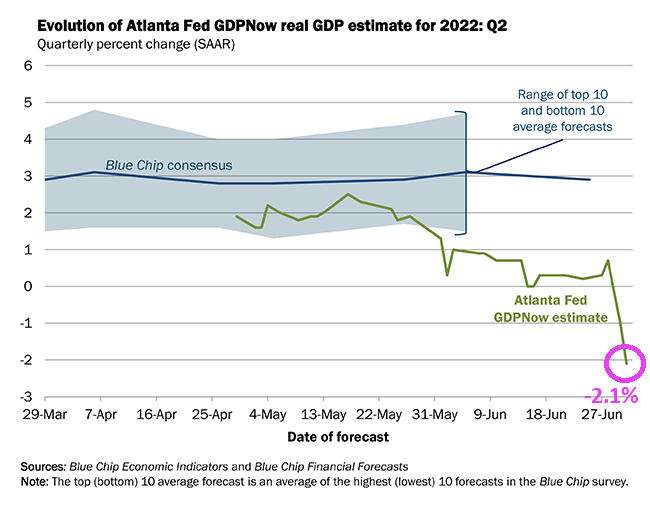
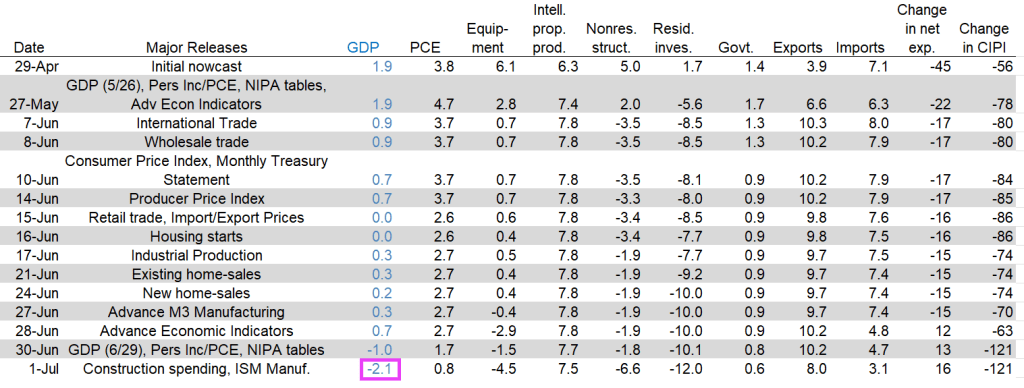
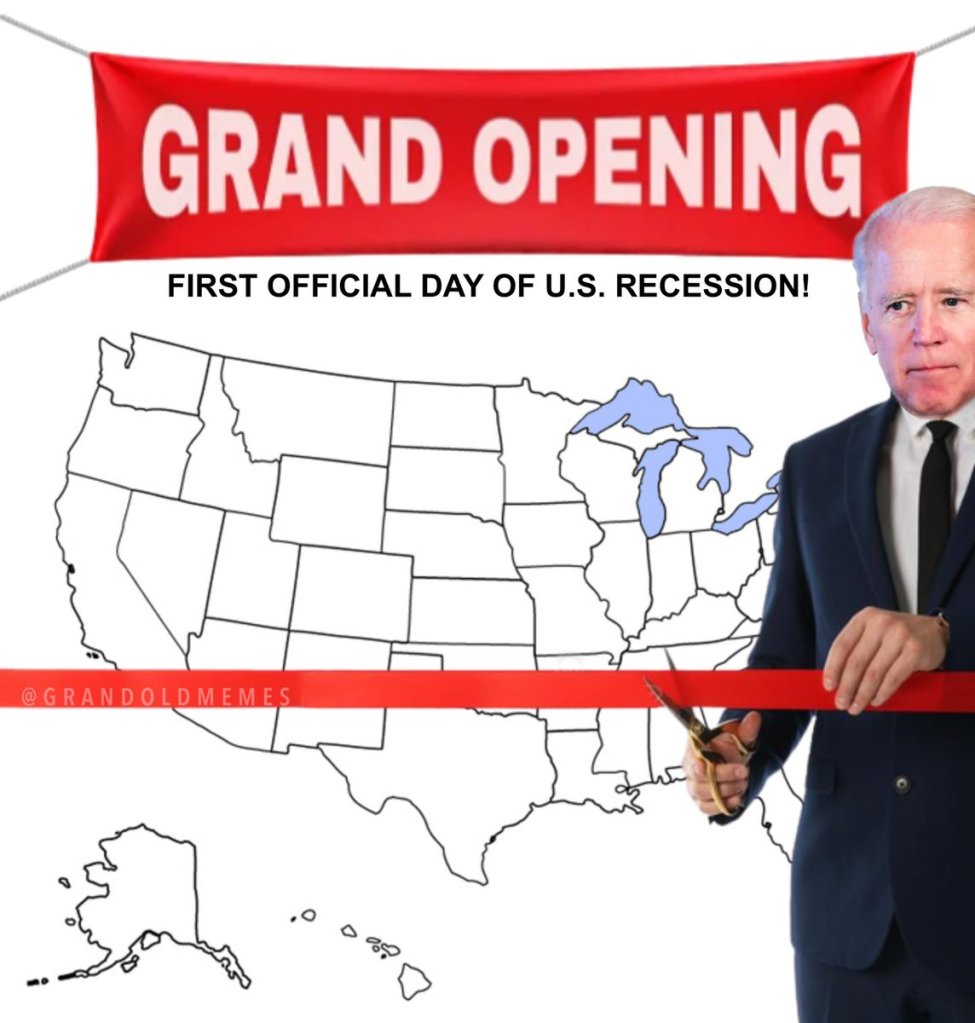
Which is bad news for Biden and Democrats after Q1’s bad GDP report of -1.6% “growth”, we now see the Atlanta Fed’s real-time GDP report for Q2 at -2.1%.


You must be logged in to post a comment.