“Bidenomics is indeed working!” claims Karine Jean-Pierre. “Cost is going down … wages going up, that is Bidenomics.”
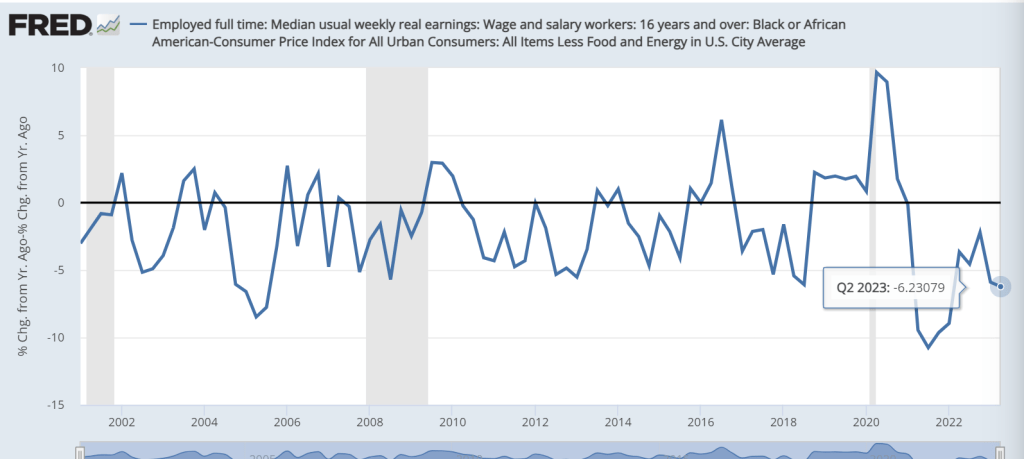
Excuse me Karine. REAL weekly earnings growth remains negative as inflation outpaces weekly earnings growth. As of Q2 2023, REAL median weekly earnings growth is a dismal -3.57% YoY.
And if you are black, Bidenomics has failed you even worse! Q2 Real weekly earnings growth for black households was -6.23% YoY.
Jared Bernstein was VP Joe Biden’s former Chief Economist and is now chair of the United States Council of Economic Advisers. Pretty impressive! Except that Bernstein is not really an economist. He has a PhD in social welfare from Columbia University. In other words, Bernstein is a Progressive Marxist cheerleader, not a real economist. Perfect for The Biden Adminstration where they installed a small town Mayor with no experience (Buttigieg) as Transportation Secretary.
BERNSTEIN: “Yes, it depends on what your benchmark is.”
Bernstein’s answer reminds me of the infamous reply of President Clinton about having sex in the Oval Office with Monica Lewinsky: “It depends on what the definition of sex is.”
Well, Jared, here is the data.
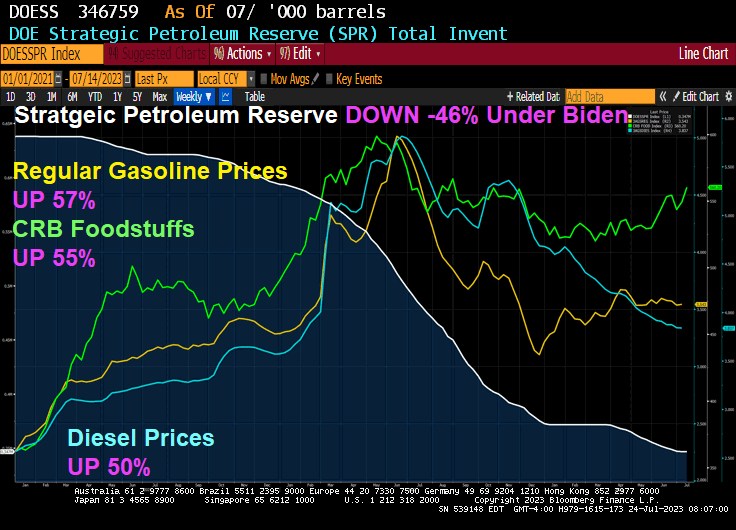
Since January 2021, regular gasoline prices are up 57% under Biden’s and Bernstein’s Reigns of Error. CRB Foodstuffs are up 55% under Clueless Joe and Diesel prices 50% under Bully Biden. Meanwhile, the Strategic Petroleum Reserves is DOWN -46% under Hidin’ Biden.
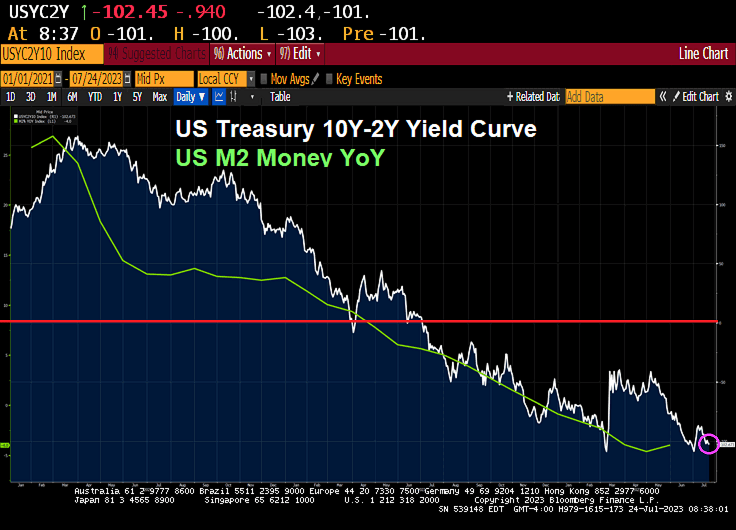
Meanwhile, the US Treasury 10Y-2Y yield curve has inverted to -102.45 as it does prior to a recession. I would love to hear “economist” Jared Bernstein explain that!
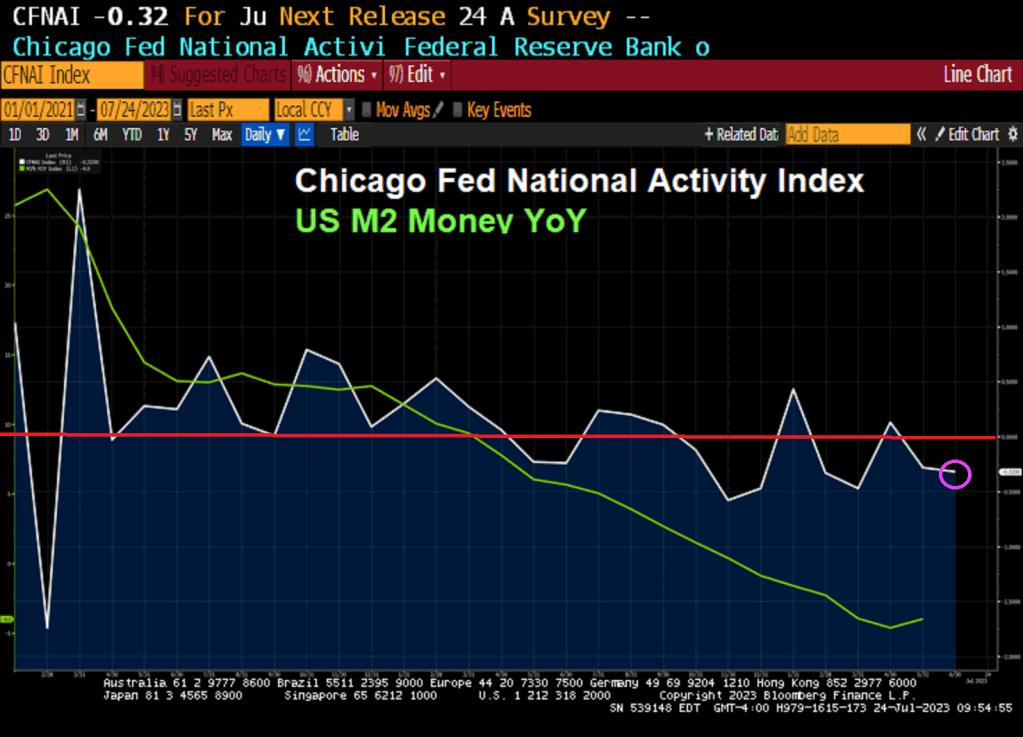
The Chicago Fed’s National Activity index fell to -0.32 in June. That is negative readings for 6 of the last 8 months.
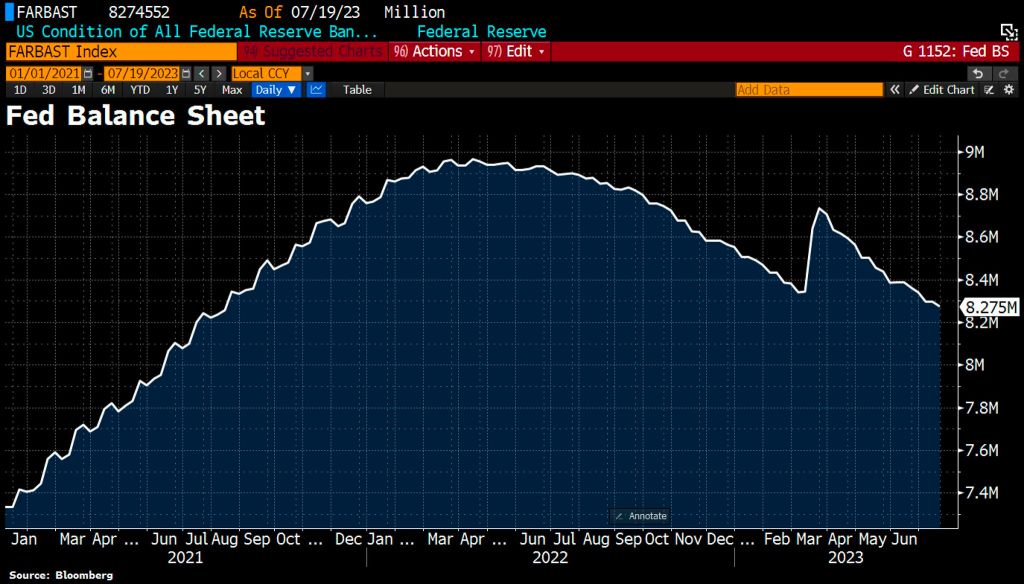
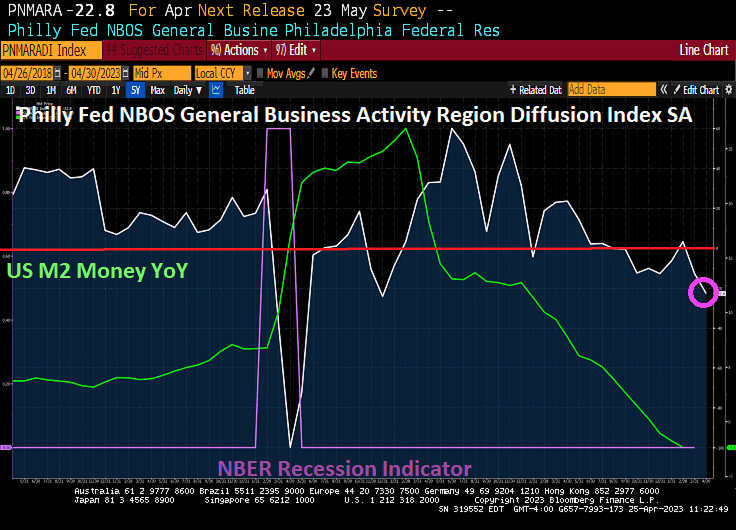
The Fed still hasn’t removed its monetary stimulypto from the market.
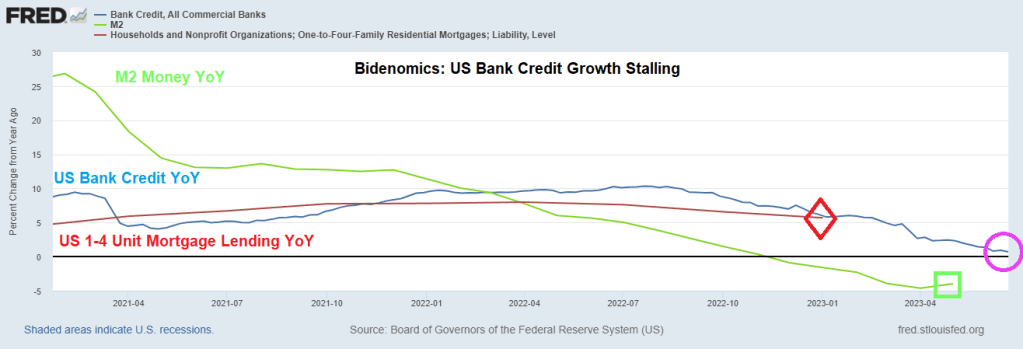
Bidenomics is based on massive Federal spending and massive Fed monetary stimulus. But like all stimulus, it wears off. Such is the case with bank lending as The Fed raises interest rates.
US bank credit year-over-year (YoY) has stalled to a lowly 0.7% rate as M2 Money growth YoY increases slightly to -4%.
Its figures. With the Socialist Federal Reserve manipulating interest rates and Biden/Congress spending like drunken sailors trying to manipuate economic growth, it makes sense that Biden wants to explore Bill Gate’s idiotic idea of blotting out the sun to prevent global warming.
Of course, Biden can hide at any of his 4 mansions and wear his Ray-ban Aviators to avoid the horror of his policies.
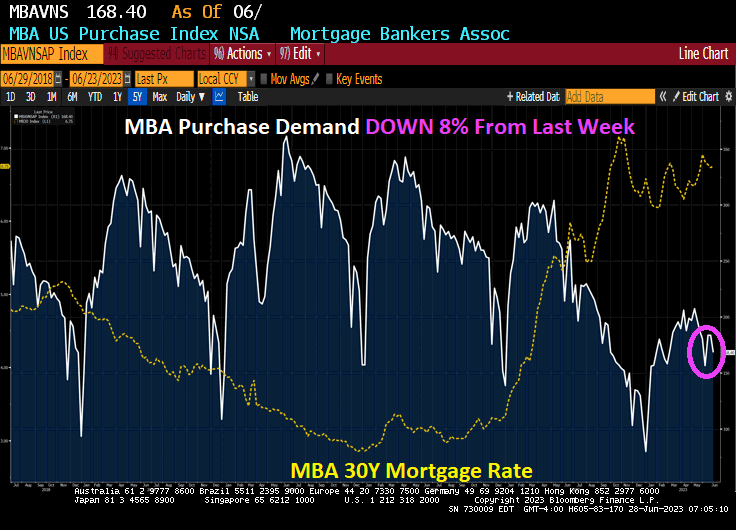
Eggs, bacon and toast. All more expensive under Biden’s economy. And mortgage purchase demand is down -45.3% since Biden was elected and mortgage refinancing demand is down -91% under Biden and mortgage rates are up 128% under Biden’s economy.
Mortgage applications increased 3.0 percent from one week earlier (using seasonally adjusted data), according to the Mortgage Bankers Association’s (MBA) Weekly Mortgage Applications Survey for the week ending June 23, 2023. This week’s results include an adjustment for Juneteenth holiday.
The Market Composite Index, a measure of mortgage loan application volume, increased 3.0 percent on a seasonally adjusted basis from one week earlier. On an unadjusted basis, the Index decreased 8 percent compared with the previous week. The seasonally adjusted Purchase Index increased 3 percent from one week earlier. The unadjusted Purchase Index decreased 8 percent compared with the previous week and was 21 percent lower than the same week one year ago.
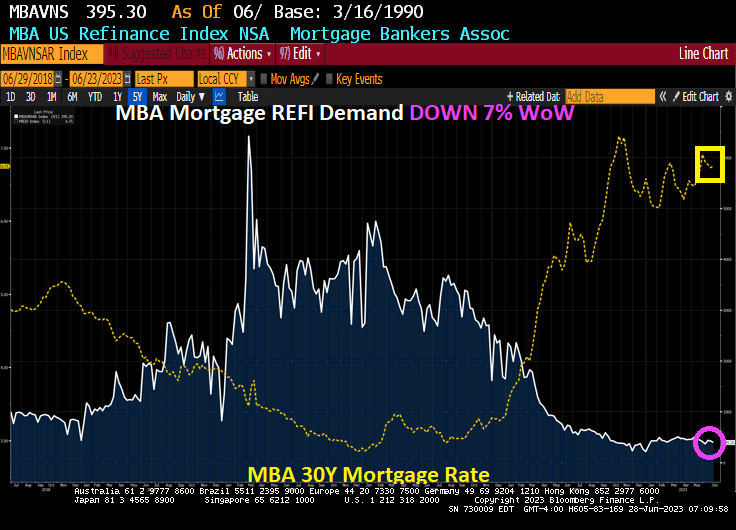
The Refinance Index increased 3 percent from the previous week and was 32 percent lower than the same week one year ago.
Now for the highly (self) touted Biden economy: Mortgage purchase demand is DOWN DOWN -45.3% under Biden, Refi demand is DOWN -91% under Bidenomics, and mortgage rates are UP 128% under Clueless Joe’s Reign of economic error.
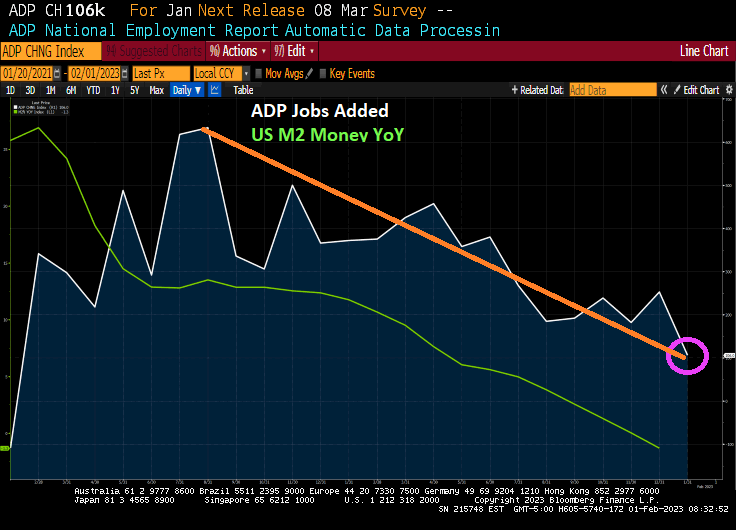
The US economy is slowing down. In fact, ADP jobs added just printed at 106k in January, the lowest reading since August 2021. ADP jobs added follows the slow down of M2 Money growth YoY as The Fed tightens its monetary policy.
Do I detect a trend (orange line)?
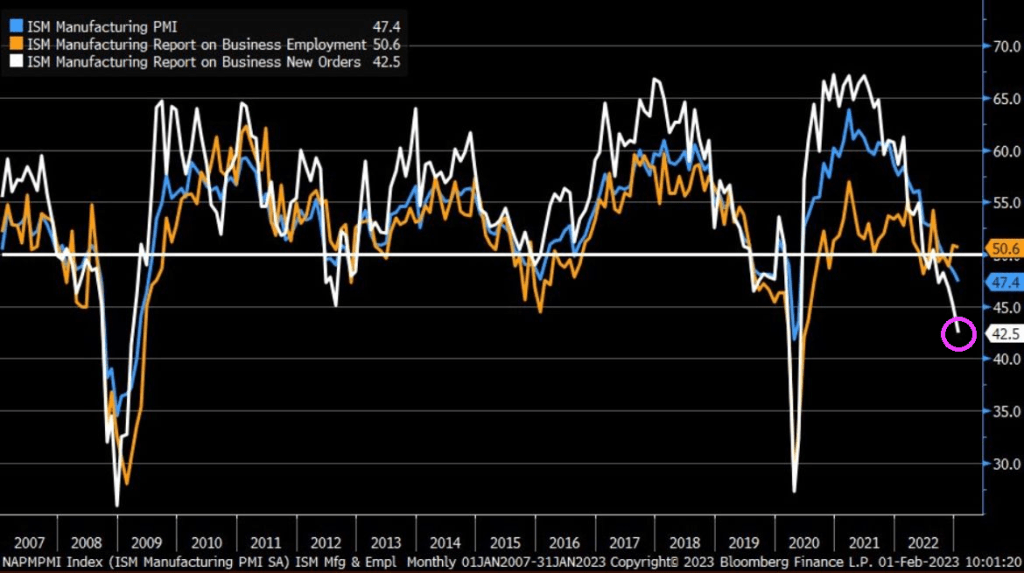
Speaking of trends, check out ISM Manufacturing New Orders. Lowest since Great Recession of 2008 (if I exclude the government economic shutdown Covid recession).
I doubt that January’s ADP report or the ISM Manufacturing report will be mentioned in Biden’s State of the Union address.
Welcome to the wonderful world of Bidenomics, giving the US 40 year highs in inflation leading The Federal Reserve to remove its enormous monetary stimulus (known as “The Punch Bowl.”
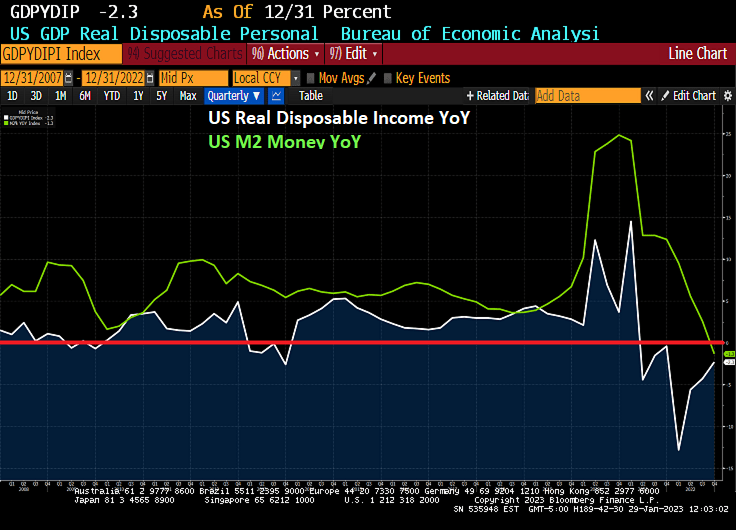
I previously pointed out that US Real GDP was actually less than 1% year-over-year (YoY) in 2022, hardly a fantastic number given the trillions in Biden/Pelosi/Schumer spending (Omnibus, Infrastructure, etc) and Powell/Fed’s whopping monetary stimulus in 2020. But real disposable income, the amount households have left to spend after adjusting for inflation, had been falling for 7 straight months.
In fact, REAL disposable personal income peaked in March 2021, shortly after Biden was sworn-in as President in Janaury 2021 at $19,213.9 billion (or $19.214 TRILLION). As of December 2022, real personal disposable income had fallen to $15,213.0 or $15.213 TRILLION. That is a loss of $4 TRILLION since March 2021. Or a -21% Loss in Real Disposable Income.
There was a hilarious film with Hillary Swank and Aaron Ekhart called “The Core” where earth’s core stops spinning and the earth gets cooked by the Sun’s rediation. Now we learn that the Earth’s inne core has actually stop spinning. This time, however, all that has happened is that Joe Biden is President which is almost as bad,
But also related to “The Core” is that the important Personal Consumption Expenditures (PCE) are out for December along with PCE price deflator numbers. In short, personal income was up 0.2% month-over-month (MoM) in December while personal spending was down -0.2%. REAL personal spending was down -0.3% MoM.
But the all important PCE deflators numbers were down all well. The REAL PCE price index (or deflator) was down to 5.0% YoY in Decmember while REAL CORE price index was down to 4.40%. All this is happening as M2 Money growth has stop spinning (down to -1.3% YoY in December).
Based on a CORE PCE YoY of 4.40%, the Taylor Rules suggest that The Fed Fund Target rate should be … 10%. However, the current Fed Funds Target rate is only 4.50%, so The Fed is not even half way there.
Fed Funds Futures are pointing to a peak rate of 4.90% by the June ’23 FOMC meeting, then a pivot (despite denials from Fed talking heads).
Of course, The Fed doesn’t follow the Taylor Rule or any other transparent rule for rate management. Rather, Fed Chair Powell like former Chair (and current Treasury Secretary Janet Yellen) follow a more seat-of-the-pants approach.
While the children in Congress and the Administration argue about cutting the Fedcral budget (as if there isn’t trillions of dollars of wasteful spending in the budget), we saw an even dumber suggestion from Pramila Jayapal (WA-D), Adam (Shifty) Schiff (CA-D) and Sheila Jackson Lee (TX-D): a bill to eliminate the debt ceiling altogether to allow unlimited Federal spending. That reminds me of the Tom Arnold/Julie Ford film “The Stupids.” Yet these clowns keep getting re-elected.
In any case, The Federal Reserve’s quantitative-tightening program risks being propelled toward an early end as US politicians bicker in Washington over raising the national debt limit, according to some economists and bond-market participants. As of this morning, the US credit default swap (1-year CDS) remains elevated signaling a positive probability of a US debt default. (CDS represents the price of insuring against a default).
But notice that The Fed still has $8.5 TRILLION in assets (largely Treasuries and Agency MBS) on their balance sheet. But The Fed’s plans to continue shrinking their balance sheet will be put on hold (and if fact will be reversed) if Democrats and President (10% for the big guy) Biden don’t budget on cutting some of the enormous fat from the Federal budget.
Mortgage applications increased 27.9 percent from one week earlier, according to data from the Mortgage Bankers Association’s (MBA) Weekly Mortgage Applications Survey for the week ending January 13, 2023. But mortgage applications are 60% lower than the same week last year.
The Refinance Index increased 34 percent from the previous week and was 81 percent lower than the same week one year ago. The seasonally adjusted Purchase Index increased 25 percent from one week earlier. The unadjusted Purchase Index increased 32 percent compared with the previous week and was 35 percent lower than the same week one year ago.
Here are the stats.
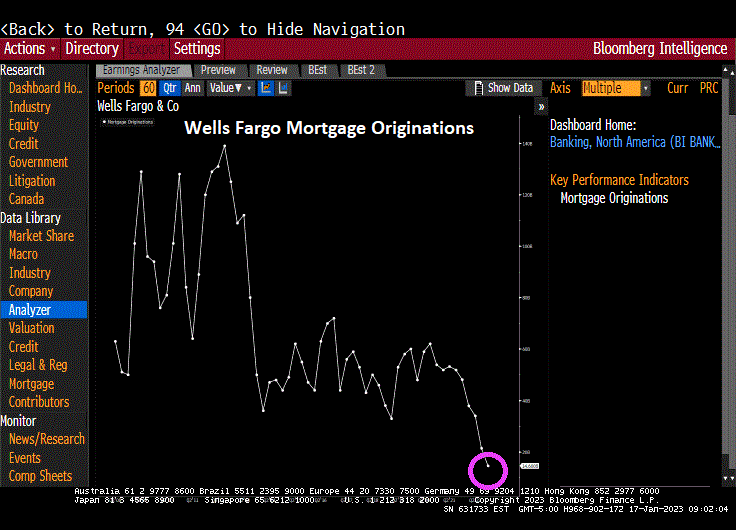
One lender in particular, Wells Fargo, smells blood in the economic waters, and has cut back mortgage originations.
Just remember, mortgage applications generally rise in the first part of the year until May, then start slowing until the last week of the year. This is called seasonality. But despite the fast growth this year, purchase applications are still down -35% compared to last year at this time.


You must be logged in to post a comment.