Covid is the gift that keeps on giving … to lazy bureaucrats and teachers union members. And a horror for small businesses and students since small businesse go bankrupt and students suffer from lack of education. And now The Federal Government is fearmongering (hey, that’s all they do!) ANOTHER Covid outbreak with Deep State Joe Biden advocating for more Federal spending on vaccines and telling everyone to get yet ANOTHER vaccination. And wear useless masks as a sign of obidience to The Democrat Party.
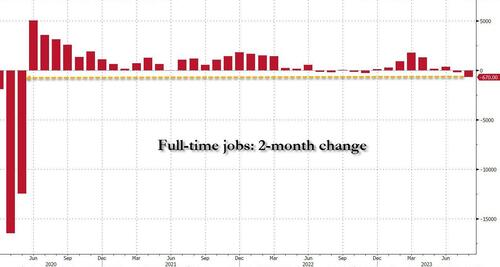
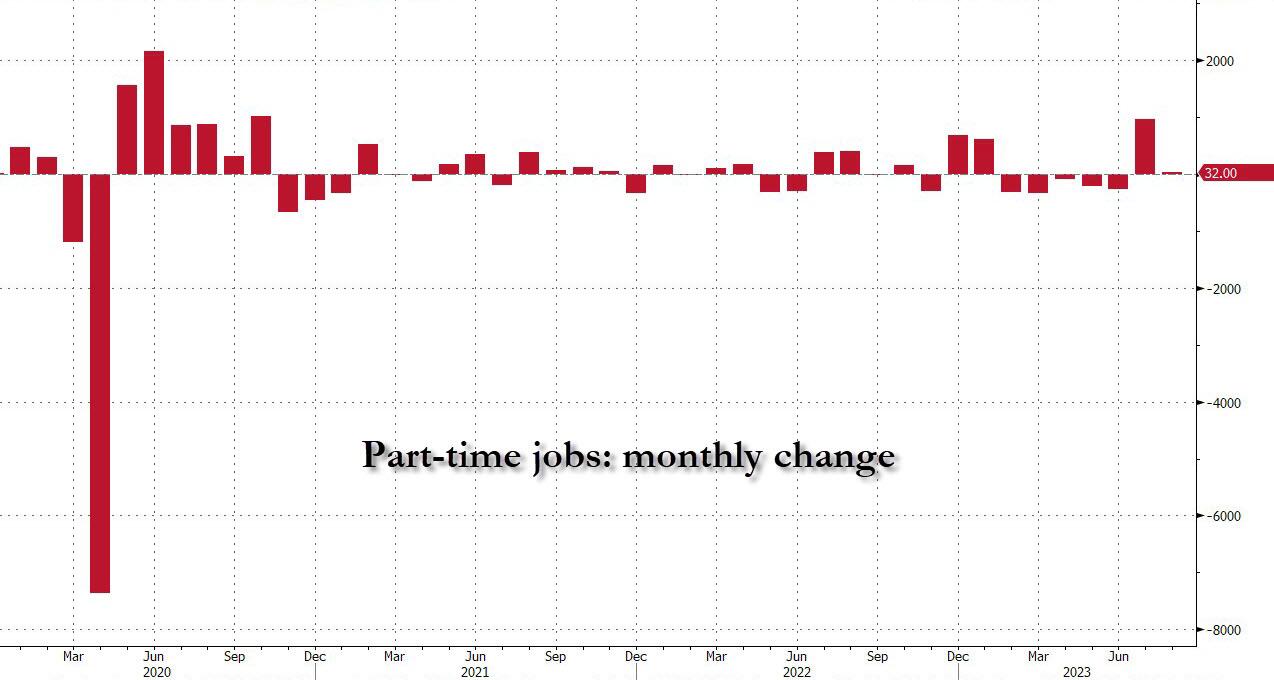
The Bureau of Labor Statistics (BLS) reported that in August the number of full-time jobs dropped again, sliding by 85K to 134.2 million, and followed the whopping 585K plunge in July which brings the two-month total drop in full-time jobs to a whopping 670K, the biggest 2-month plunge since the covid lockdowns in early 2020 when 12.5 million full-time jobs were lost in one month!
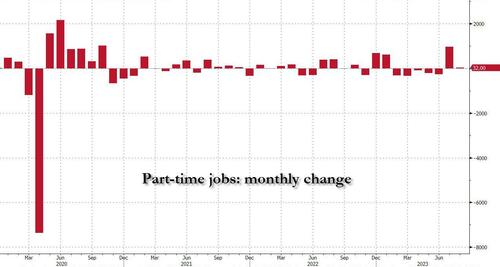
But if full-time jobs crashed how did the BLS get an increase of 222,000 employed workers? Simple: it was all in the latest jump of part-time workers. Indeed, in August the number of reported part-timers jumped by 32K and when added to the near-record 972K surge in July, the 2-month total was just over one million – 1,004,000 to be precise – to 27.185 million.
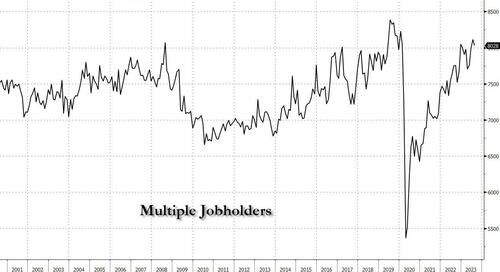
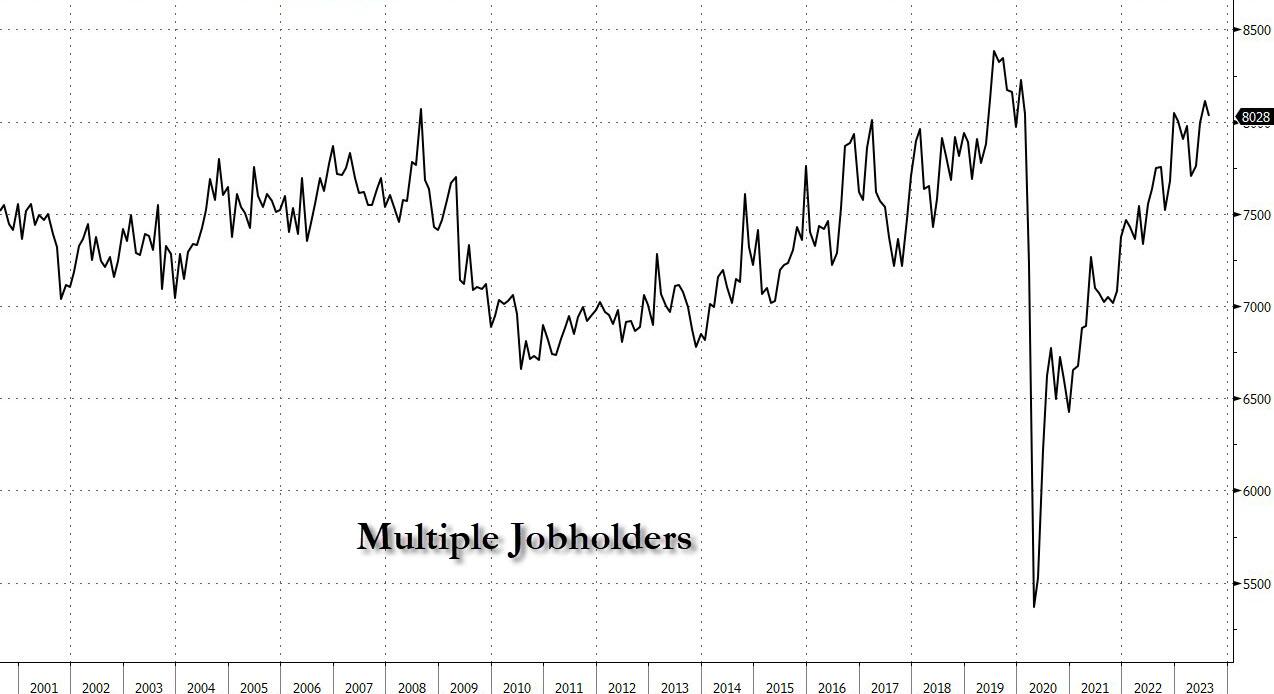
Going back to a quantitative read of the data, we look at the number of multiple jobholders – those workers who have to work more than one job at a time to make ends meet. In August this number was actually a modest silver lining, as it dropped by July, that number dropped by 85K to 8.028 million, but it remains just shy of the pre-covid record.
Given the extreme level of corruption in the Biden Administration, the Democrat Party should be renamed after New York’s Tammany Hall.
And require all people to wear a Tammany Hall fez instead of a mask.
The glories of Bidenomics is on fully display. Despite what Lyin’ Biden says, Bidenomics is only working for the elites (top 1%). How Soviet/CCP command economy of him!
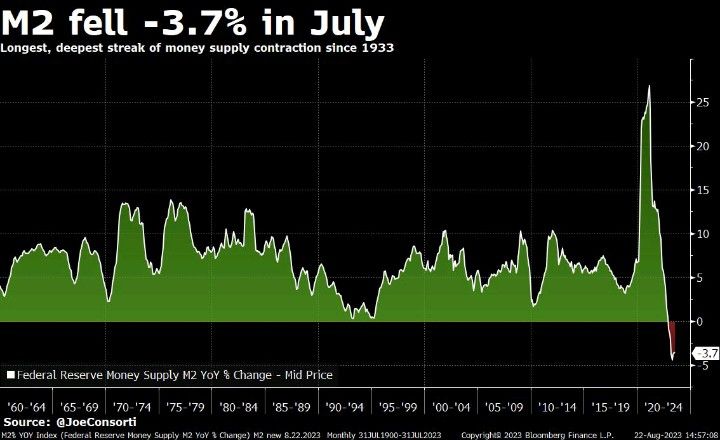
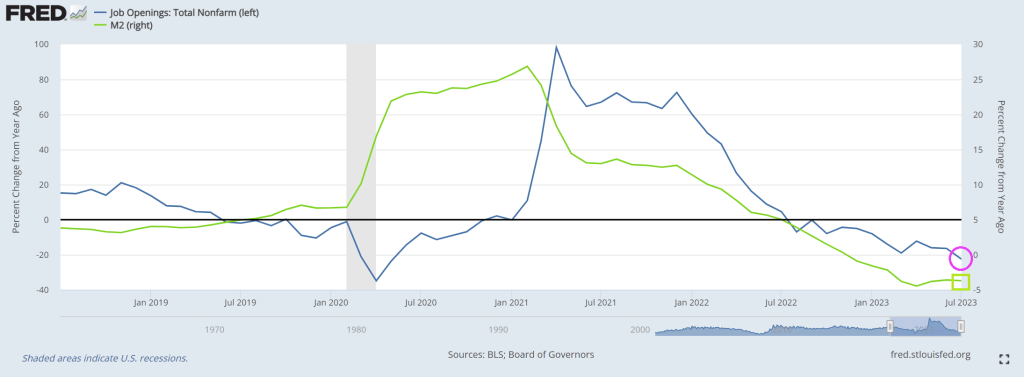
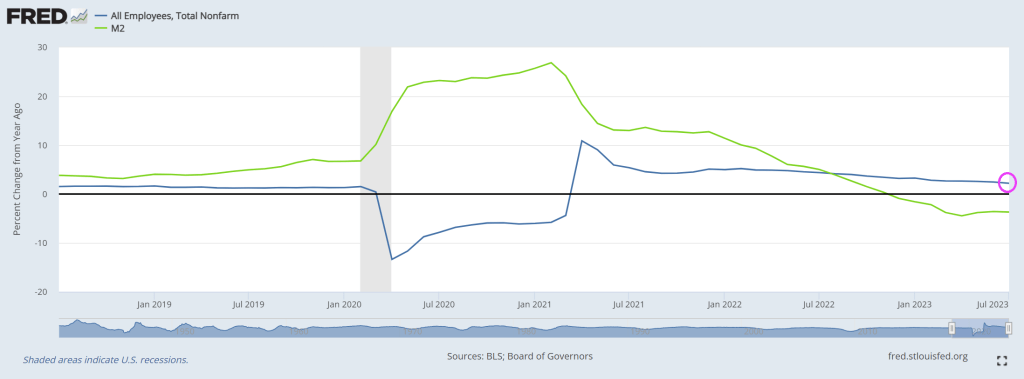
Here is an ugly chart showing Bidenomics in action! We all know that Covid unleashed a torrent of Fed monetary stimulus AND Federal spending on Covid relief and green energy subsidies (most to large Democrats donors). BUT we now have experienced 3 consectutive quarters of negative gross domestic income (GDI) growth. And nominal GDI growth is falling with falling M2 Money growth.
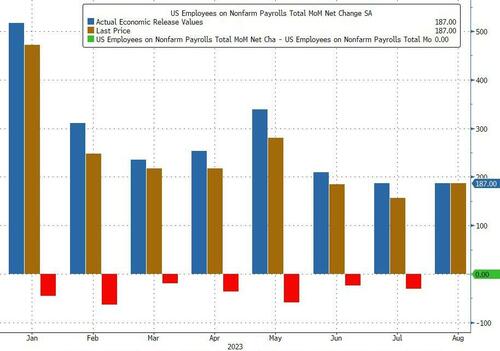
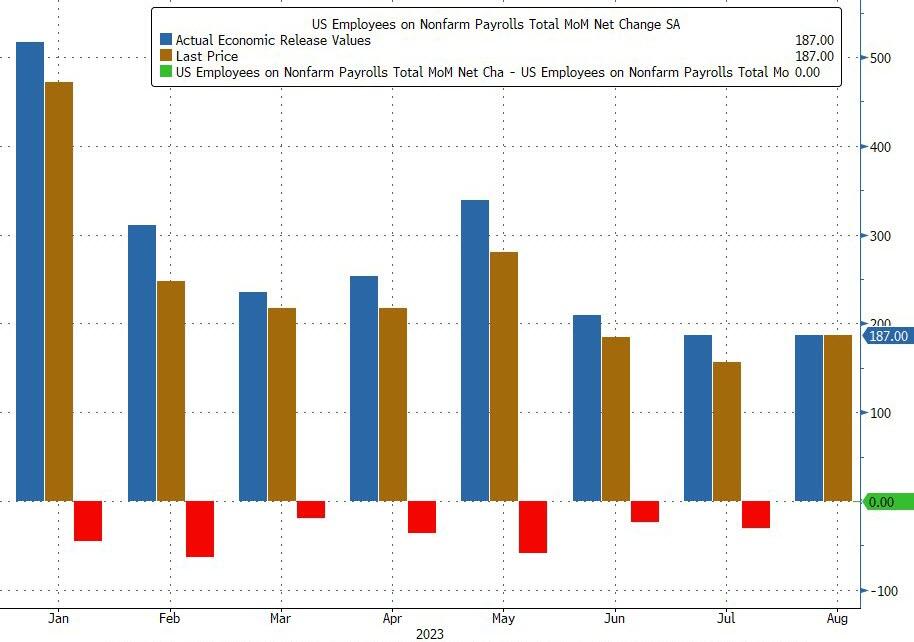
And today’s jobs report for August showed that only 187k jobs were added.
Superficially this would have meant an unchanged print from last month when the BLS also reported 187K jobs, however in keeping with recent trends that number was revised – drumroll – lower again, to 157K, meaning that every single monthly payrolls print in 20-23 has been revised lower (see chart below), a 12-sigma probability and virtually impossible unless there was political pressure to massage the data higher initially and then revise it lower when nobody is looking. (As if the mainstream media is at all honest!)
But wait there’s more: while July was revised down by 30K from +187,000 to +157,000, June was revised even more, by 80,000, from +185,000 to +105,000, which means that a number that was originally reported as 209K has been reivsed 50% lower, to 105K and a collapse vs original expectations of 230K. Here, the BLS was proud to report that “with these revisions, employment in June and July combined is 110,000 lower than previously reported.”
And we have The Conference Board’s confidence index at -65. Yikes!
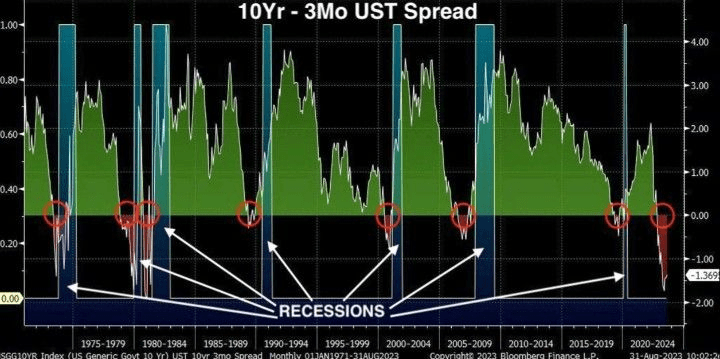
Finally, we have the 10Y-3M UST spread SCREAMING recession!
So, the economy is slowing under Bidenomics and Cadavar Joe.
Will Cadavar Joe actually go out on the campaign trail and debate ANY Democrat or Republican?? Remember, this is the man with the nuclear launch codes.
Another economic report on Bidenomics. This one is for housing.
Realtors Pending Home Sales Index (PHSI)* – a forward-looking indicator of home sales based on contract signings – rose 0.9% to 77.6 in July. Year over year, pending transactions fell by 14.0%. An index of 100 is equal to the level of contract activity in 2001.
Combine that with crashing M2 Money growth (lowest since 1933 and The Great Depression (and The Dust Bowl). The difference is that the US had the soothing talks of Franklin Roosevelt “I can assure you that it is safer to keep your money in a reopened bank than under the mattress.” —President Franklin Roosevelt in his first Fireside Chat, March 12, 1933. Unfortunately, we have Joe Biden, the WORST public speaker in history and a completely unempathetic person.
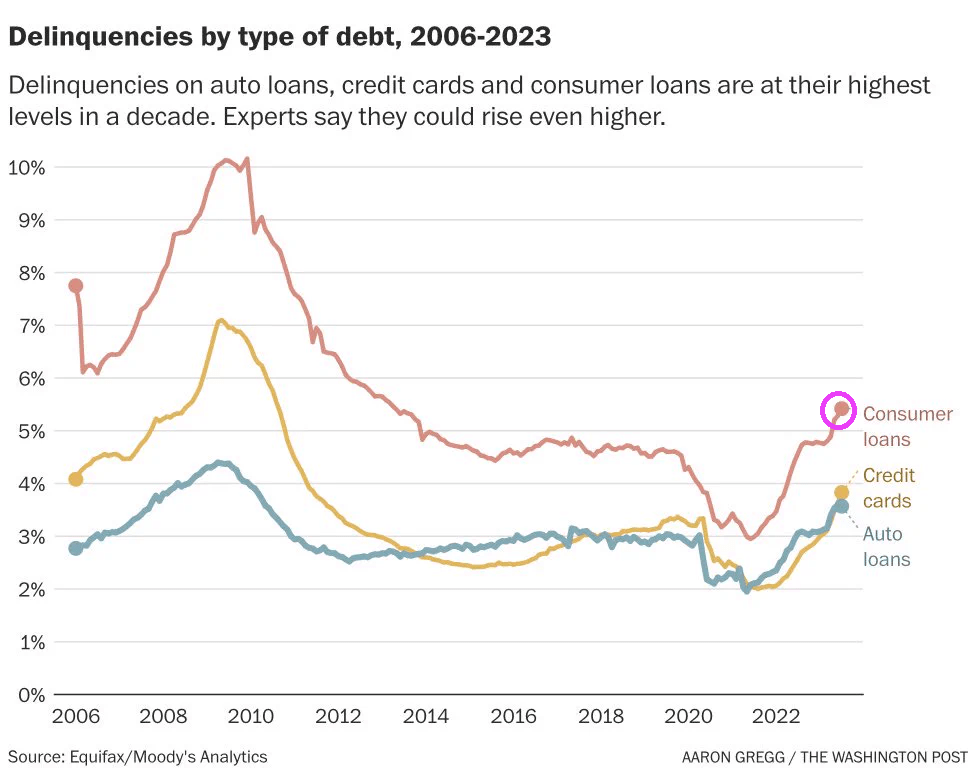
Delinquencies on auto loans, credit cards and consumer loans are at their highest levels in a decade.
Instead of Sleepy Joe, Middle Class Joe, Corrupt Joe (sounds like Cuppa Joe), and any of the multitude of unflattering nicknames, we now have REVEREND JOE.
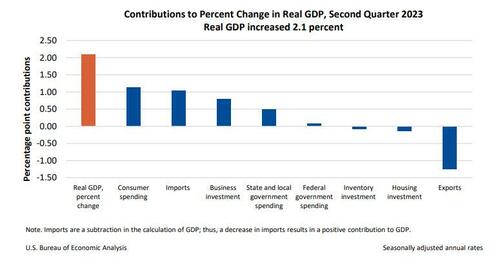
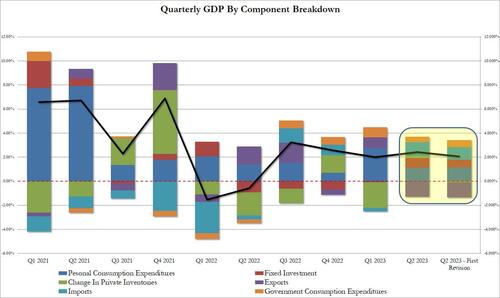
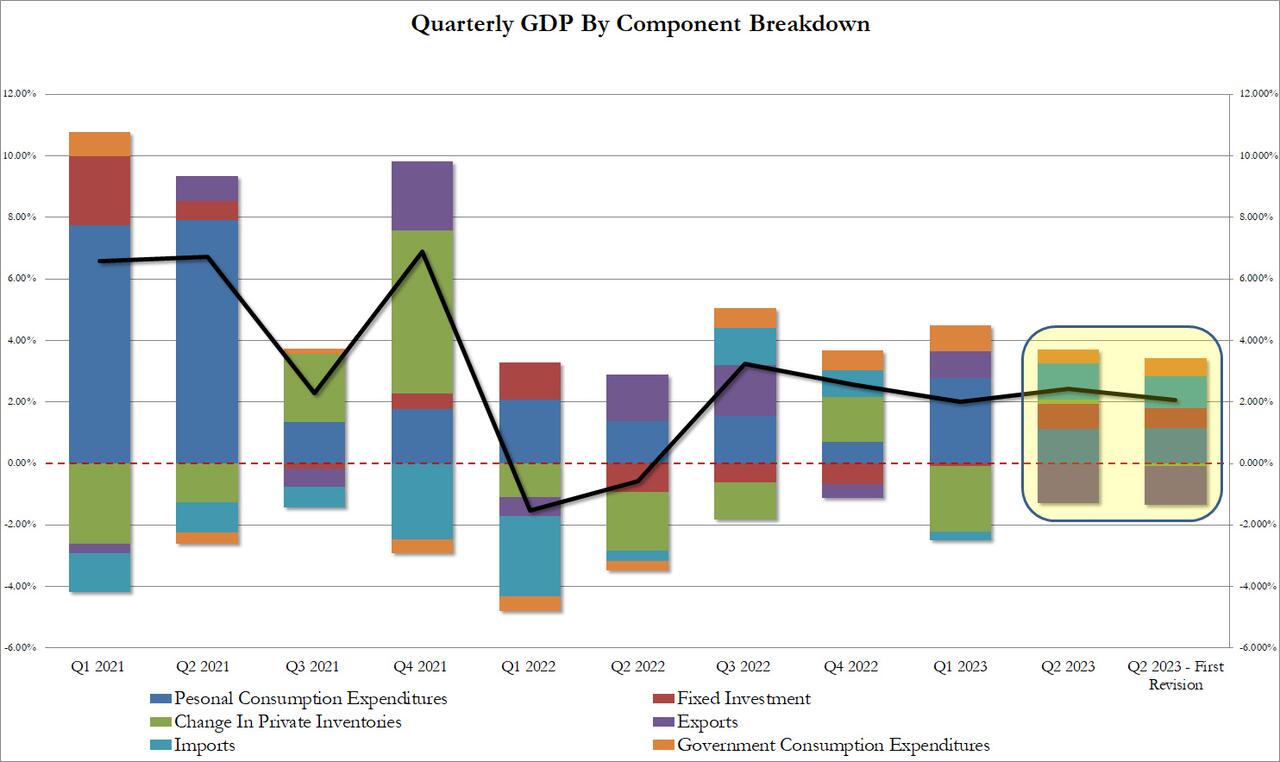
The GDP estimate released today is based on more complete source data than were available for the “advance” estimate issued last month. In the advance estimate, the increase in real GDP was 2.4 percent (refer to “Updates to GDP”). The updated estimates primarily reflecteddownward revisions to private inventory investment and nonresidential fixed investmentthat were partly offset by an upward revision to state and local government spending.
The increase in real GDP reflected increases in consumer spending, nonresidential fixed investment, state and local government spending, and federal government spending that were partly offset by decreases in exports, residential fixed investment, and private inventory investment. Imports, which are a subtraction in the calculation of GDP, decreased.
The revision according to the BEA, “reflected a smaller decrease in inventory investment and an acceleration in business investment. These movements were partly offset by a downturn in exports and decelerations in consumer spending and federal government spending. Imports turned down.” In short, everything was uglier,
Taking a closer look at the data, we find the following changes to the bottom line:
Personal consumption added 1.14% to the bottom line print or just over half, up from 1.12% in the original print; annualized this comes out to 1.7% which was below the 1.8% estimate.
Fixed investment contributed 0.66%, down from 0.83%
Change in private inventories now subtracting 0.09% from the bottom line number, a big swing from the positive 0.14% print in the original estimate. And it will be revised even lower next month as more of the “shrink” emerges.
Net exports were also revised lower, with gross exports trimmed from -1.28% to -1.26%, while imports were revised from 1.16% to 1.04%
Finally the ever handy plug that is government consumption (which is a garbage concept since the government does not actually create anything of economic value in the economy but merely allocated graft and embezzlement of public funding), actually rose from 0.45% to 0.58% (of bottom line GDP). Without this revision, Q2 GDP would have printed below 2.0%
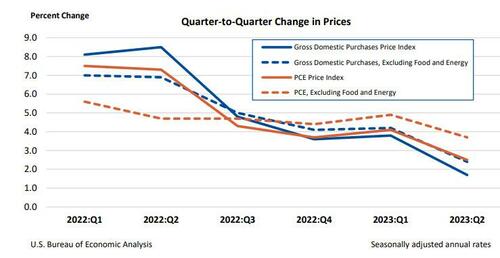
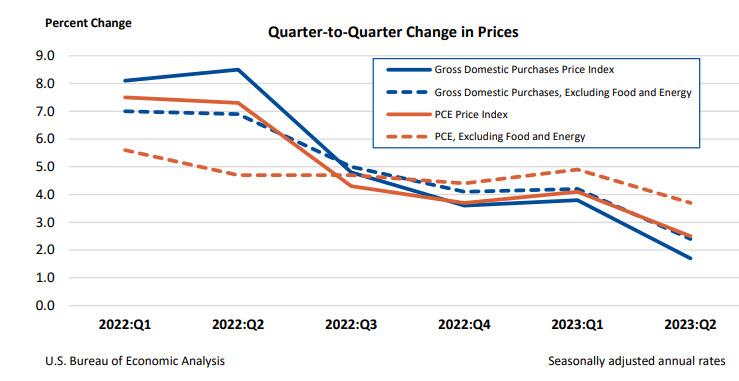
Separately, gross domestic purchases prices, the prices of goods and services purchased by U.S. residents, increased 1.7% in the second quarter after increasing 3.8 percent in the first quarter, above the 1.6% estimate last month but below the consensus 1.8%. Excluding food and energy, prices increased 2.4% after increasing 4.2%.
Personal consumption expenditure (PCE) prices increased 2.5% in the second quarter after increasing 4.1% in the first quarter. Excluding food and energy, the PCE “core” price index increased 3.7% after increasing 4.9%. This number was also revised lower from 3.8% and missed estimates of 3.8%.
Finally, the BEA reported corporate profits decreased 0.4% at a quarterly rate in the second quarter after decreasing 4.1% in the first quarter. Profits of domestic financial corporations decreased 12.1% after decreasing 2.3 percent. Profits of domestic nonfinancial corporations increased 0.9% after decreasing 5.0 percent. Profits from the rest of the world (net)increased 4.4 percent after decreasing 2.0 percent. Corporate profits decreased 6.5 percent in the second quarter from one year ago.
Needless to say, all this is a far cry from the rebound in corporate profits that companies themselves reported in their various GAAP and non-GAAP metrics, which is to be expected in a world where there is now an uncrossable chasm between economic data and its government fabrications.
Then we have M2 Money collapsing, down -3.7% in July. Longest, deepest contraction of money suppy since 1933.
Biden, making Zelenskyy rich again!! The US bought Zelenskyy a new villa! “The document indicates that the villa was purchased by Zelenskyy’s mother-in-law in May 2023. The price of the villa is 150,000,000 Egyptian pounds or approximately $4,850,000.” Thanks Biden!!! America last!
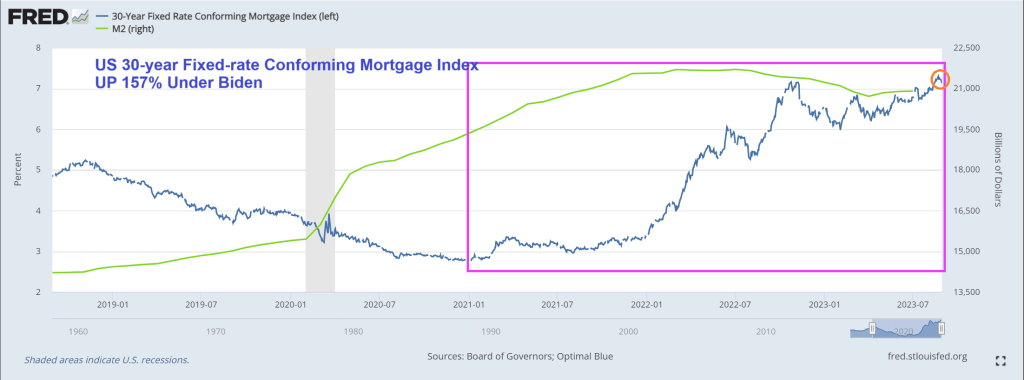
I wonder if Biden will use his writeboard to brag about the 30-year mortgage rate rising 157% under his economic Reign on Error? Aka, Bidenomics.
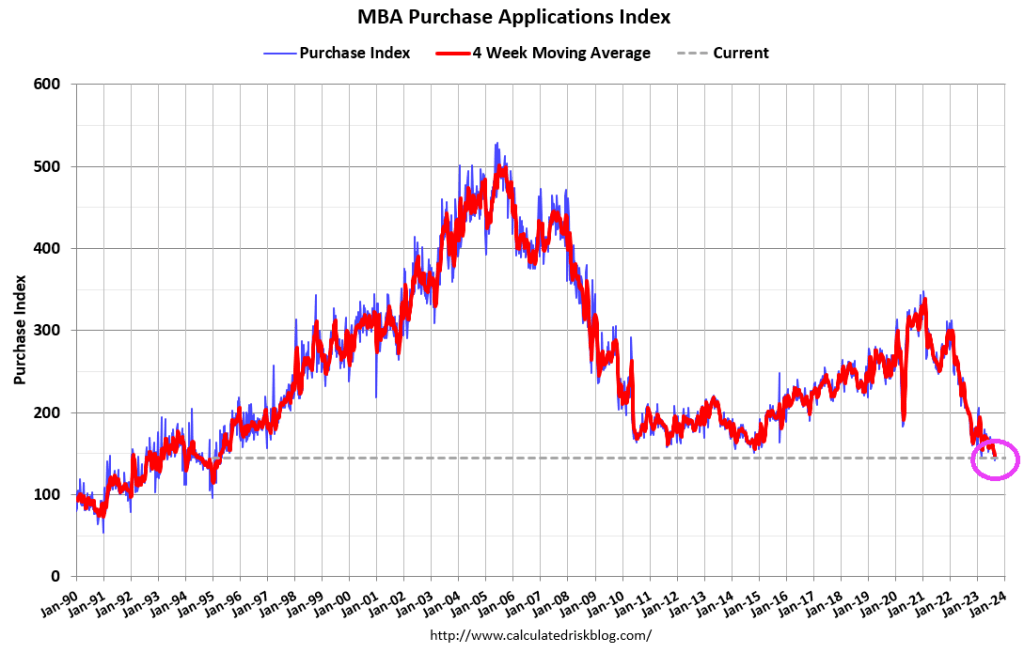
Mortgage applications increased 2.3 percent from one week earlier, according to data from the Mortgage Bankers Association’s (MBA) Weekly Mortgage Applications Survey for the week ending August 25, 2023.
The Market Composite Index, a measure of mortgage loan application volume, increased 2.3 percent on a seasonally adjusted basis from one week earlier. On an unadjusted basis, the Index increased 1 percent compared with the previous week. The Refinance Index increased 3 percent from the previous week and was 28 percent lower than the same week one year ago. The seasonally adjusted Purchase Index increased 2 percent from one week earlier. The unadjusted Purchase Index decreased 0.3 percent compared with the previous week and was 27 percent lower than the same week one year ago.
Joe Biden will always be remembered for lying about never raising taxes on households making under $400,000. Inflation is a permanent tax, mostly on those making under $400,000 per year. And household essentials are up substantially under Biden: gasoline prices are up 72%, rent CPI of Primary Residence is up 16%, and food at home CPI is up 20%! That is a HUGE tax on the middle class.
When CPI falls this does not mean that prices on goods and services are going down, it only indicates that prices are rising slower than they were the month or the year before.
Another misconception about CPI is that it measures the inflation rate accurately for regular consumers on common purchases. In reality, the CPI represents mean average price rate increase for a vast basket of goods; over 94,000 items and services with over 200 separate categories. Most of these items and services you will never use or rarely purchase in the span of a year. In other words, inflation declines in uncommon goods can dilute the numbers, making it seem like inflation is dropping while prices on daily necessities continue to spike.
The CPI is weighted according to consumer spending patterns, which is where the calculations can be “adjusted” to a certain extent in an arbitrary manner. Then there is outright government manipulation through various means. As we witnessed recently with the Biden Administration’s claims that “Bidenomics” has defeated the inflation threat, what these reports don’t mention is that Biden has been dumping US strategic oil reserves on the market for the past year. And since energy prices effect the inflation of so many other categories, Biden has artificially manipulated the CPI down using one key resource.
Now that his ability to dump oil reserves has ended, CPI will rise once again along with energy prices.
The point is, it’s impossible to get a sense of the real damage from inflation without looking at the cumulative inflation in necessities (the goods and services that people are required to purchase on a regular basis to live day to day). If we throw out the CPI distraction and look at common necessities since 2020, the economic picture is far more bleak.
Overall food prices have soared by 25%-30% in only three years (again, this means that you are now paying 30% more this year for food than you were paying at the beginning of 2020). Chicken is up from $3 per pound to $4 per pound. Beef is up from $3.50 to $6 per pound. Corn is up from $3.50 per pound to $4.70 per pound. Wheat is up from $5 per pound to $7 per pound. In 2019 the average American household was spending $8100 on food annually; with a 30% increase, in 2023 Americans will be spending at least $10,500 per household.
By the end of 2019, the average rental price of a single family home was around $1450 per month. This year the price is around $2000 per month. At the beginning of 2020, the median cost of a home was $320,000; by 2023 the price skyrocketed to an average of $416,000.
For gasoline, the price in early 2020 was around $2.50 per gallon. The price has fluctuated dramatically due to Biden’s manipulation of the market using strategic reserves, but still remains high today at $3.80 per gallon.
The cost of electricity has risen swiftly, holding steady around .13 cents per kilowatt hour for a decade, then spiking to at least .17 cents per kilowatt hour by 2023.
Remember, most of these costs are static and are difficult to reduce through household spending cuts. These are not items that are easily removed from a monthly budget and the expenditures add up to considerable pressure on consumer accounts. This is probably why around 74% of the public in polls say that the economy is getting worse, not better. It’s because government statistics are not highlighting the true inflationary crisis.
When we look at the cumulative climb of prices in necessities since before the inflation crisis officially began, the truth is that Americans now have to increase their wages by at least 25%-30% on average to maintain the same standard of living they had three years ago. This is a disaster not seen since the stagflationary event of the 1970s and early 1980s. If you have a strange feeling like your bank account is being rapidly drained in recent months, that’s because it is.
And the 30-year mortgage rate is up 163% under Middle Class Joe.
Preliminary benchmark revision smaller than some had projected
Biggest payrolls adjustment in transportation and warehousing
Are you surprised that the Biden Administration has been lying about job creation?? Not really since Biden compulsively lies about everything. Including his corruption.
US job growth was probably less robust in the year through March than previously reported, according to government data released Wednesday.
The number of workers on payrolls will likely be revised down by 306,000 for March of this year, according to the Bureau of Labor Statistics’ preliminary benchmark revision.
Even without the revision, job growth has slowed to 2.2% YoY in July as M2 Money growth slowed to -3.7% YoY.
Let see what our Overlords say at the Jackson Hole Fed symposium.
Thanks to the crippling effects of Bidenomics (Fed easing then tightening to combat inflation caused by insane green spending and a war in Ukraine), US mortgage rates (conforming 30-year) has increased 159%.
On the yield curve side, the US Treasury curve 10Y-2Y CMT fell from 99 basis points the day after Maui Joe was sworn-in as El Presidente to the inverted curve we see today (-63 basis points).
Dynamic Maui Joe looking less than happy trying to visit Maui while he could be partying with mega-donor Tom Steyer (a big green energy con artist).
At least Biden didn’t wear his aviator sunglasses or down an ice cream in a show of “empathy.” But, of course, he did find time to assault a child! Watch the hands Maui Joe!!!!


You must be logged in to post a comment.