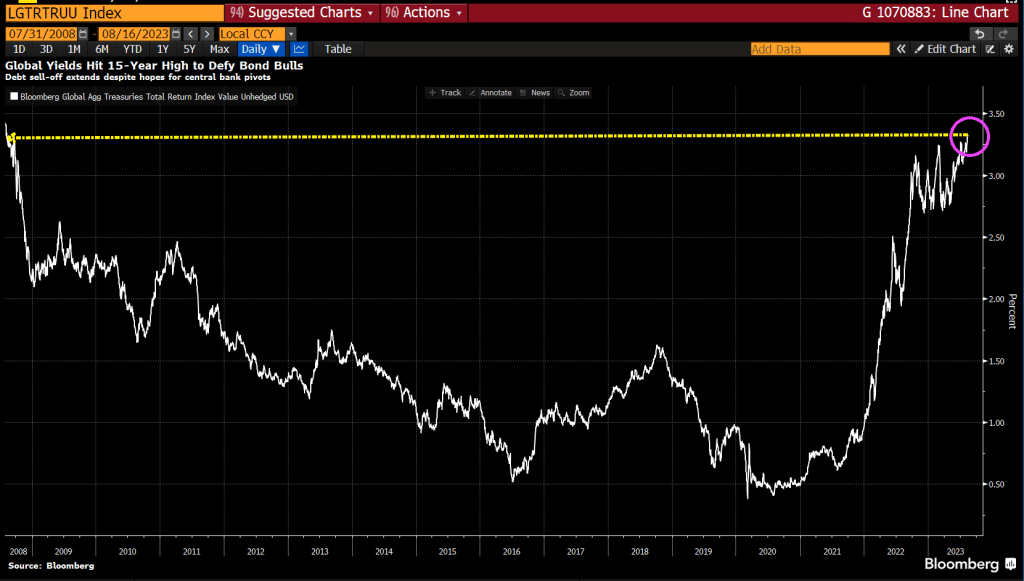
This is very strange. Global Treasury Yields just rose to a 15-year high (2008). This is primarily due to Central Bank moneta
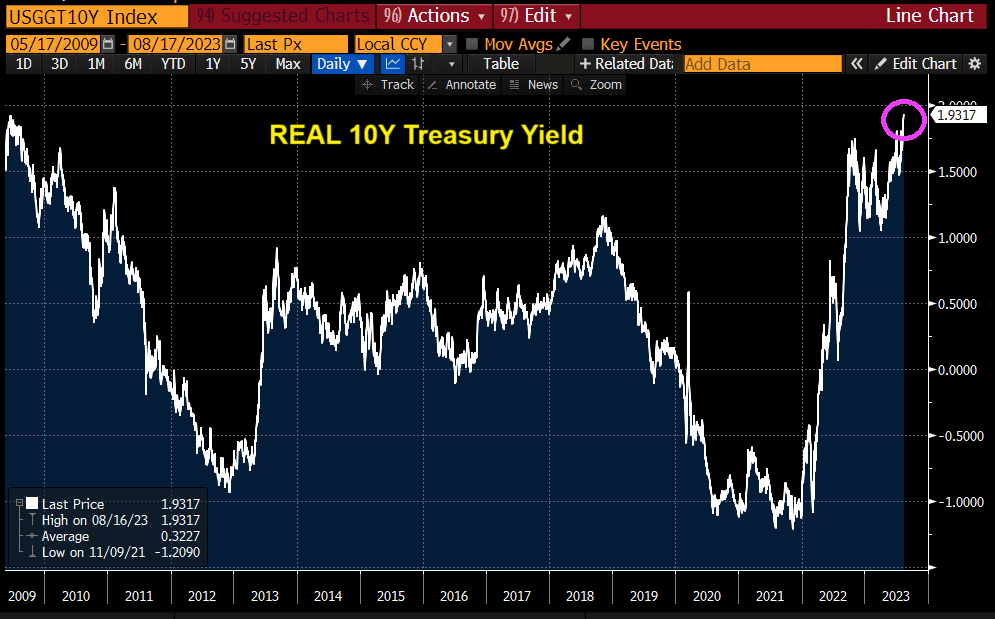
And REAL 10-year Treasury yields also the highest since 2009.
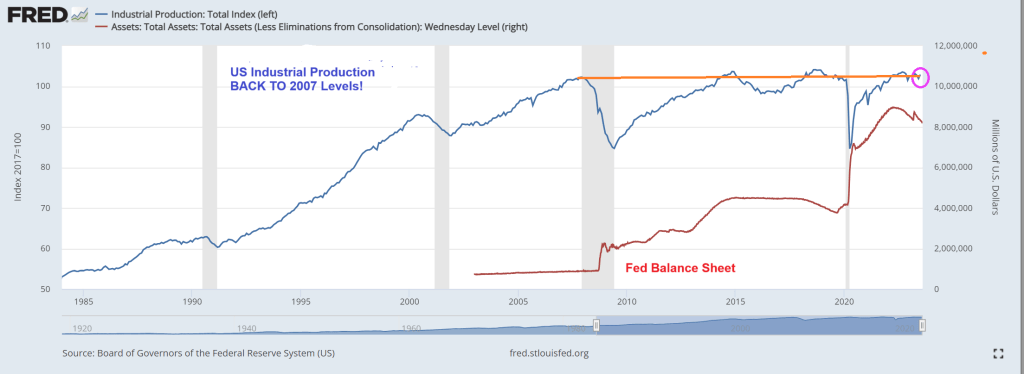
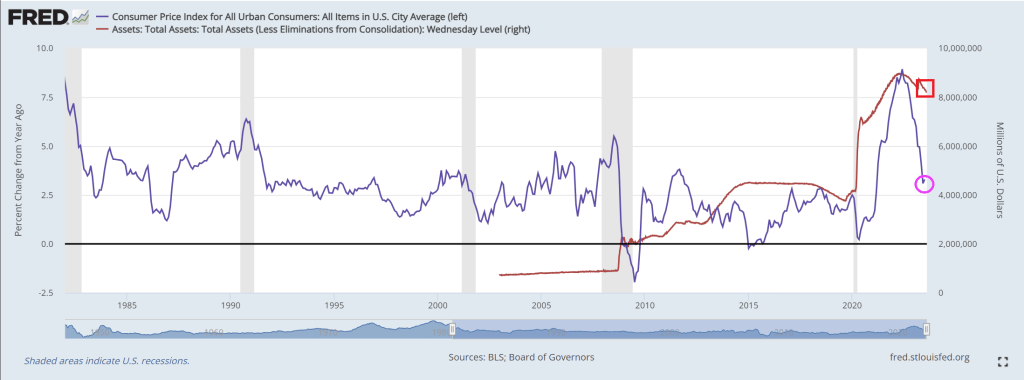
At the same time, US industrial production is at the same level as pre-financial crisis (2007). Despite Federal Reserve monetary stimulypto (remember, The Fed’s balance sheet remains abouve $8 trillion.
This is Obama/Biden/Yellenomics. Trillions of dollars of fiscal (green) stimulus and monetary stimulus only to have industrial production be at the same level BEFORE The Great Recession and financial crisis.
Well, its now August 2023 and US Industrial Production for July increased … to 2007 levels. This comes after the massive spending out of Washington DC and massive Federal Rerserve stimulus.
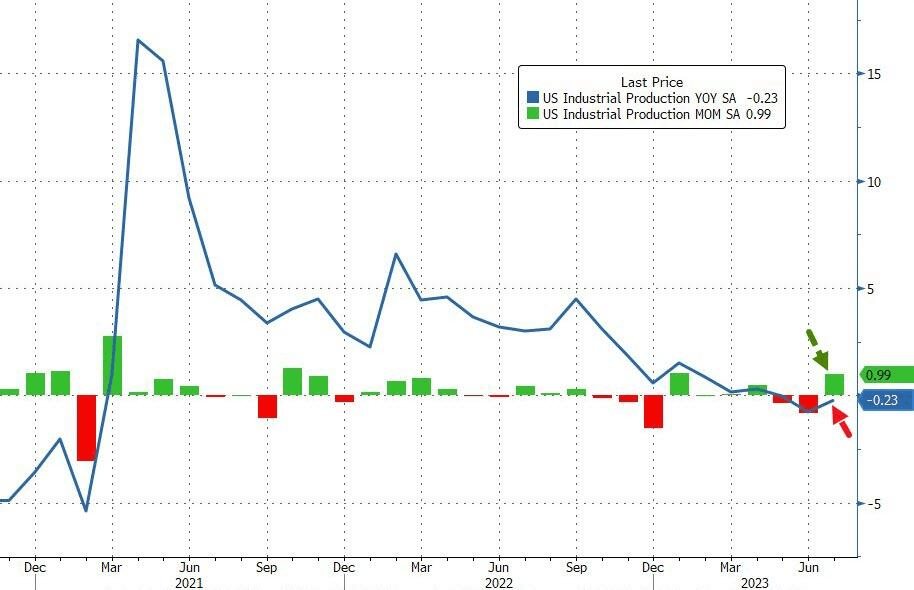
Is that all there is??
US Industrial Production is DOWN -0.23% YoY while up slightly in MoM terms.
As I said a couple of days ago, the Obama/Biden economic model is a Soviet/Chinese Communist Party (CCP) style of COMMAND economics, not free market DEMAND economics.
“Ice Cream Joe” Biden is at Lake Tahoe for a week, probably to avoid being asked questions about his tin-ear respoonse to the tragic Maui fires that have killed 106 people so far. Instead, Joe is inappropriately chuckling (showing he doesn’t care!) and taking photo ops of him eating ice cream. The Biden administration angered a lot of people when it was announced that households that have been affected by the fires would only be getting a one time emergency aid payment of $700 while he gives billions for Ukraine.
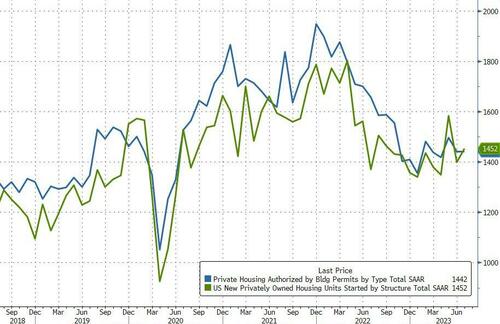
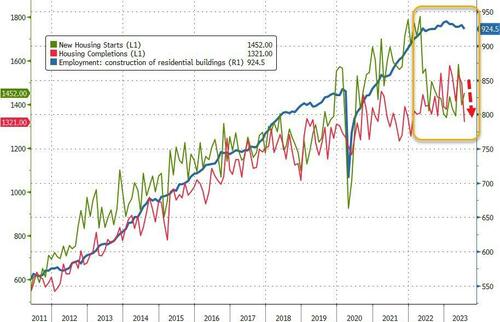
At least housing starts were up 6% year-over-year (YoY).
However, the picture was more mixed with starts rising 3.9% MoM (vs +1.1% exp), but that was impacted by a notable downward revision in June (from -8.0% to -11.7%).Building Permits rose just 0.1% MoM (well below the 1.5% MoM expected).
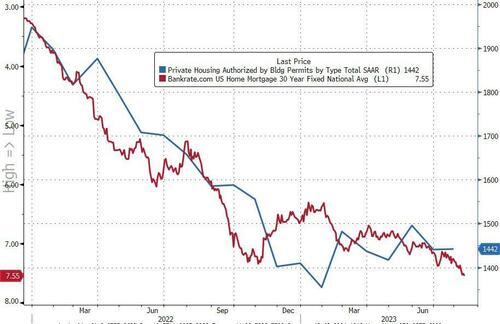
On a SAAR basis, Permits disappointed (1.442mm vs 1.463mm exp) while Starts were in line at 1.452mm (up from a significantly downwardly-revised 1.398mm in June).
Source: Bloomberg
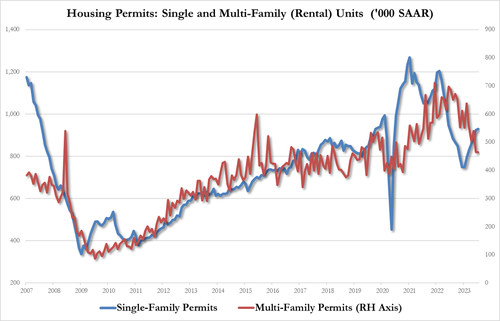
On the Permits side, single-family rose as multi-family fell:
Single-family up to 930K from 924K, highest since June 2022
Multi-family down to 464K from 465K, lowest since Oct 2020
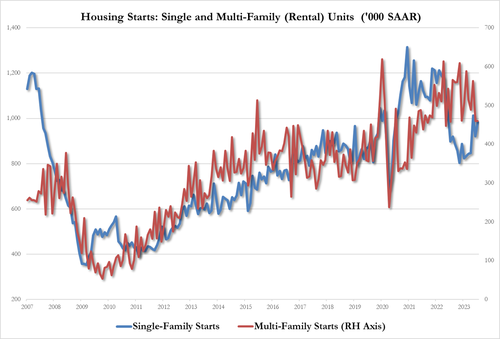
July Housing Starts data followed the same trajectory with rental units growth underperforming single-family:
single-family housing up 6.7% to 983K, up from 921K, highest since May
multi-family housing unch at 460K, tied for lowest since July 2022
Additionally, we note that while Housing Starts and Completions remain well off their 2022 highs, Construction Jobs remain very close to those highs…
Source: Bloomberg
Finally, we note that Mortgage Bankers Association data released earlier this morning showed applications for home purchases dropped again last week (back near 1996 lows) as the contract rate on a 30-year fixed mortgage surged above 7% (highest since Dec 2001).
Source: Bloomberg
This won’t end well.
Speaking of not ending well, mortgage applications decreased 0.8 percent from one week earlier, according to data from the Mortgage Bankers Association’s (MBA) Weekly Mortgage Applications Survey for the week ending August 11, 2023.
The Market Composite Index, a measure of mortgage loan application volume, decreased 0.8 percent on a seasonally adjusted basis from one week earlier. On an unadjusted basis, the Index decreased 2 percent compared with the previous week. The Refinance Index decreased 2 percent from the previous week and was 35 percent lower than the same week one year ago. The seasonally adjusted Purchase Index decreased 0 percent from one week earlier. The unadjusted Purchase Index decreased 2 percent compared with the previous week and was 26 percent lower than the same week one year ago.
Before I look at Berenson’s plea for more inflation, let’s see where Federal spending and Fed Monetary policies have left us. As of this morning, the REAL US Treasury 10-year yield (nominal yield less inflation), is now the highest since two crises ago, meaning The Great Recesssion and the first major overreaction of The Federal Reserve in late 2008.
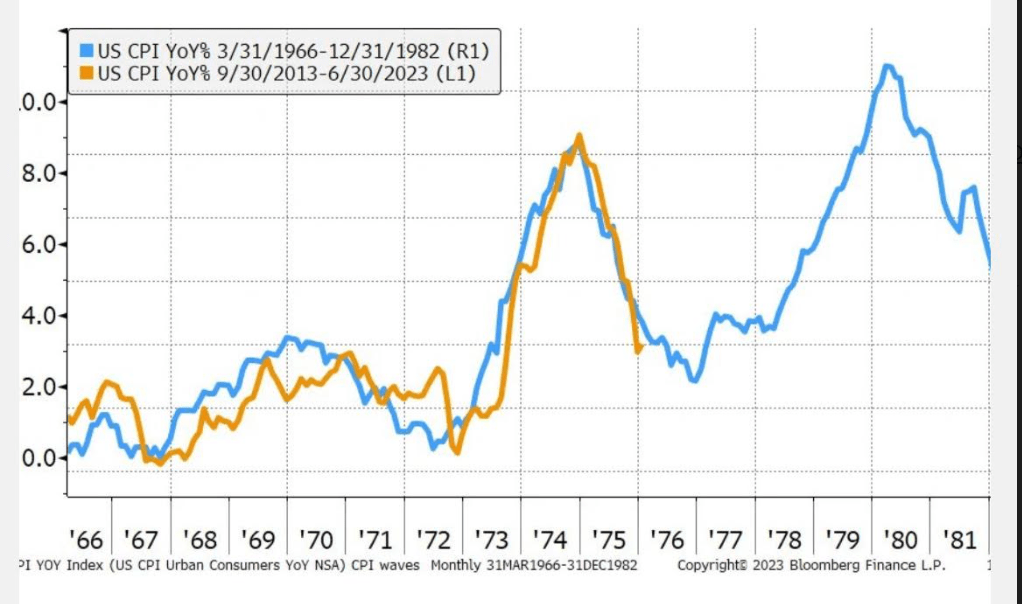
Here is Berenson’s chart showing changes in inflation (CPI YoY) from 1966-1982 compared with recent inflation (orange) from 9/30/2013 – 06/30/2023. A charist might get confused and assume that inflation is will start rising again. But it is far more complicated than a simple projection.
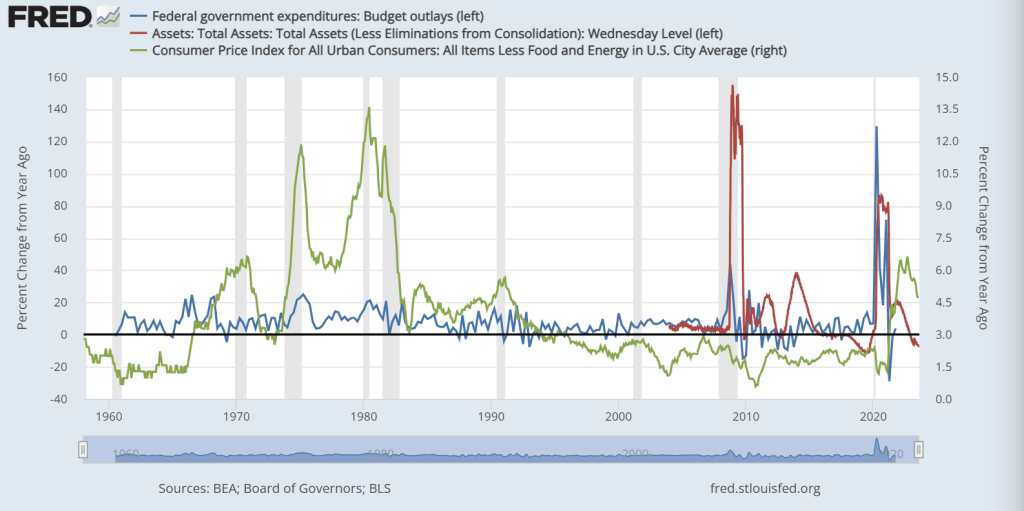
Since 1982 and the Carter recessions, we have seen incredible growth in Federal spending and when the proved insufficient, a massive increase in Fed monetary stimulus in late 2008 and then again in 2020 due to Covid. Remember Winston Churchill’s quote regarding water, “Never let a good crisis go to waste.” That has morphed into a battle cry for more government spending and regulation, not to mention Federal Reserve monetary policies.
Notice that core inflation under Carter (green line) was gut wrenching (yet Berenson just shrugs it off). Core inflation is still at a horrible 4.7% YoY. But you can see the spikes in Federal spending (blue line) and Fed Monetary stimulus (red line) associated with the financial crisis of 2008-2009 and Covid 2020-2021.
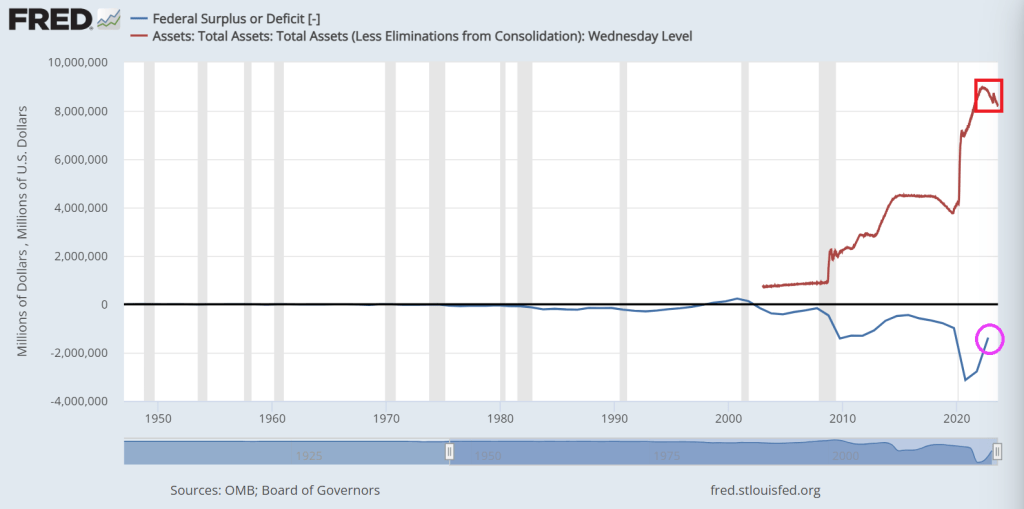
Then we have the Federal budget deficit, still over $1 trillion (despite perpetually confused President Biden claiming he got rid of the deficit). Meanwhile, The Federal Reserve still has over $8 TRILLION in monetary stimulus sloshing around the financial system.
Inflation is a horrifying by-product of Federal spending and Fed monetary policy (especially under Fed Chair Janet Yellen). Unfortunately, Yellen is now the US Treasury Secretary. For example, REAL average hourly earnings are declining thanks to inflation.
Berenson closes his piece with this sobering statement: “Ultimately, this pattern is why inflation is so problematic. It is addictive, and breaking the addiction means damaging the economy.”
Its Federal spending that addictive, and eventually Congress has to cut its insane spending levels. Even if it lowers GDP and increases unemployment. Take a look at China, a command economy, that is really suffering despite massive government spending.
Berenson is saying “all the Biden defenders are saying we’ve won the battle with inflation. But how can that be so with how much we’ve spent?” I agree, but will Washington DC ever learn? I doubt it.
Under Obama/Biden, the US economy is transitioning from a demand economy to a Soviet/Chinese-style command economy where central government directs economic traffic. We need to bite the bullet and return to a deamnd economy.
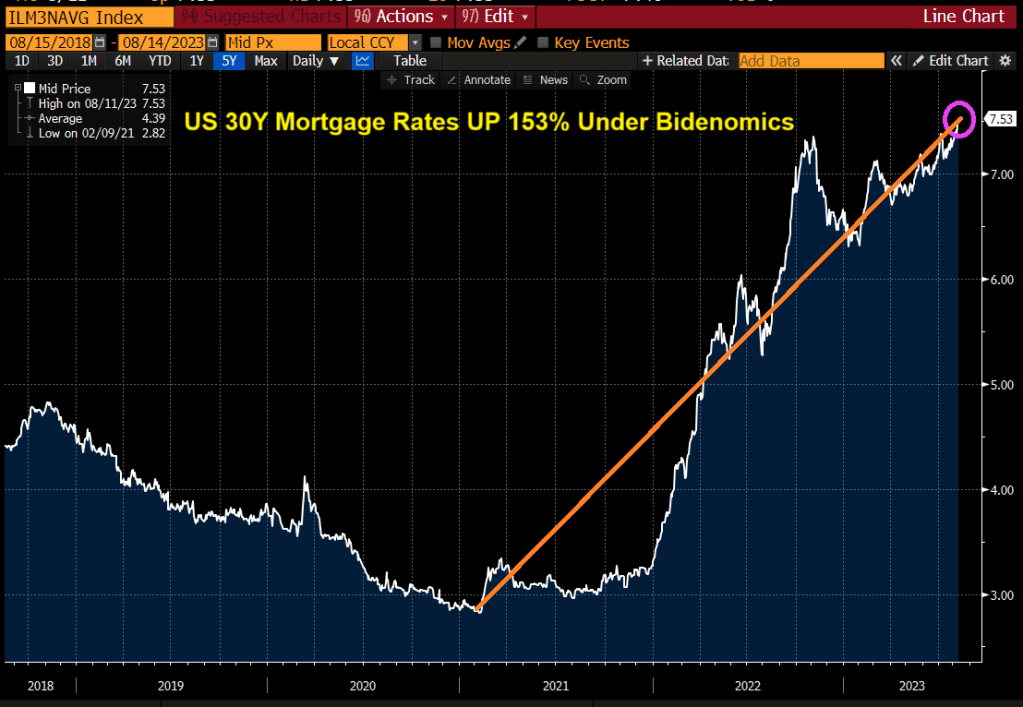
Rates on 30-year mortgages in the US are now the highest since 2000, at 7.53%. Mortgage rates are now up 153% under Bidenomics. Rates have gone from sub 3% to above 7.50% under Inflation Joe.
US Treasury yields are playing catch-up from Yellen’s “Too low for too long” monetary policies.
Yes, in part we are playing catch-up from Yellen’s Reign of Error as Fed Chair (keeping rates too low for too long). Only in Washington DC, does gross incompetance warrant a promtion to US Treasury Secretary. Career half-wit Mean Joe Biden is El Presidente and acting like a third world dictator.
Example? Take Checkable Deposits of the to 1% (blue line) of wealth compared to the bottom 50% of wealth (red line) after The Fed cranked up monetary stimulus to combat the Covid shutdowns.
On the wealth side, Covid-related monetary stimulus benefitted the top 1%.
But the middle class is expericing a tighening of credit coutesy of Cap’n Crunch (Fed Chair Powell).
We quickly found out in June that one downtown San Francisco office building sold for roughly 70% less than its previously estimated value, an ominous sign of what would come as the commercial real estate market dominos appear to be falling.
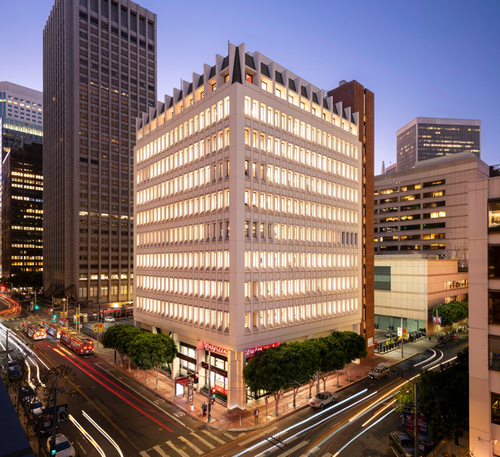
Now Sixty Spear St., an 11-story building that is 30% occupied and is expected to be entirely vacant by summer 2025, has been sold to Presidio Bay Ventures for $40.9 million, about a 66% discount versus the most recent assessed property value of $121 million, according to local media SFGATE.
“We acknowledge the formidable challenges that confront San Francisco,” Cyrus Sanandaji, founder and managing principal of Presidio Bay, who is now the office tower’s proud new owner. He remains a bull on the San Francisco office market and wants to expand the building’s square footage from 157,436 to 170,000 square feet and transform it into a “Class-A trophy office building with exceptional design and hospitality-driven amenities.”
All we have to say to Sanandaji’s CRE bet is good luck. The crime-ridden metro area covered in poop must come to terms with City Hall’s horrendous progressive policies that have entirely backfired and led to an exodus of businesses and people. Until Mayor London Breed can instill law and order once more — the ability for the downtown area to thrive once more will remain challenging.
Marc Benioff, the chief executive officer of Salesforce, the city’s largest employer and anchor tenant in its tallest skyscraper, warned last month that the metro area is in danger. He offered a grim outlook: The downtown area is “never going back to the way it was” in pre-Covid times when workers commuted to offices daily.
“We need to rebalance downtown,” Benioff said, adding Breed needs to initiate a program to convert dormant office space into housing and hire additional law enforcement to restore law and order.
… and documenting how the downtown area has rapidly transformed into a ghost town is Youtuber METAL LEO, who walks around with a video camera, revealing empty stores, malls, and towers.
Besides Sixty Spear, SFGATE provided data on other recent tower transactions:
The 13-story 180 Howard St. building, known for being the headquarters of the State Bar of California, sold for about $62 million after being expected to sell for about $85 million.
The offices at 350 California St. reportedly sold for roughly 75% less than its previously estimated value in May, and the 22-story Financial District edifice mostly sits empty. Just a few weeks later, nearby 550 California changed hands for less than half of what owner Wells Fargo paid for the building in 2005.
Things are so bad that some building owners are just walking away from properties:
If you’re curious where we could be in the CRE crisis cycle, a recent analysis by CoStar Group shows 55% of office leases signed before the pandemic that were active during Covid haven’t expired, meaning vacancies will continue to rise.
Here’s what could be next: The collapse of WeWork will only cause more pain for CRE markets nationwide. The coworking company occupies 16.8 million square feet across the US.
The US Federal Reserve has not created a CBDC … yet. Our woefully corrupt El Presidente Jose Biden (more of a Latin American, tinhorn Banana Republic dictator than as US President) has ordered the study of a CBDC. Since everything Biden touches reeks of “boodle” I am suspicious as to Biden’s motives.
There are some positives to a CBDC, mostly with WHOLESALE CBDCs. Wholesale CBDCs are similar to holding reserves in a central bank. The central bank grants an institution an account to deposit funds or use to settle interbank transfers. Central banks can then use monetary policy tools, such as reserve requirements or interest on reserve balances, to influence lending and set interest rates.
It is the RETAIL CBDC that is the cause for concern. Retail CBDCs are government-backed digital currencies used by consumers and businesses. Retail CBDCs eliminate intermediary risk—the risk that private digital currency issuers might become bankrupt and lose customers’ assets.
There are two types of retail CBDCs. They differ in how individual users access and use their currency:5
Token-based retail CBDCs are accessible with private keys or public keys or both. This method of validation allows users to execute transactions anonymously.
Account-based retail CBDCs require digital identification to access an account.
The real problem with CBDCs is that The Federal Reserve and Federal government can trace EVERY EXPENDITURE of a household. Including political contributions, firearm and ammo purchases, etc. With this much information at their disposal, this allows for DIRECT CONTROL of the population.
Given that we now know that Biden used social media platforms to pass false narratives and repress alternative views, can we trust The Federal Reserve with this much information about consumer spending? Of course not. This is a consolidation of censorship and repression of individual liberties.
Yes, paper and coin currency serve a purpose in society as an alternative to barter. Imagine trying to buy a Ford F-150 Lightning (LMAO!) using barter? Ok, we have a system of credit where you can obtain a car loan. But barter, an old system of exchange, is inefficient. That leaves us with physical currency (certain restaurants only allow payment in cash). But many consumers are using Debit Cards as a substitute for physical cash, so this is a giant step towards RETAIL CBDC already.
Alternatives to the US Dollar? Of course, gold and silver are popular choices historically. Then we have rise of the cryptocurrencie market, which some Congressional members want heavily regulated or banned. Why? First, there are some shady crypto activities (see Sam Bankman-Fried and his shady political contributions to Democrats). Second, cryptos are volatile. Why is this of any interest to Congress? Third, cryptos can be used for illegal activities (but so can cash. Just watch Netflix’s Narcos for the shipment of US Dollars to Columbia in mattresses, etc. No, the goal of some members of Congress is to overregulate or obliterate alternatives to the US Dollar … unless The Federal government does it, like The Fed’s CBDC!
With Biden’s Department of Injustic and several Democrat state Attorney Generals indicting Biden’s top political opponent Donald Trump with the intent of preventing him from campaigning for President (sounds so much like other Totalitarian regimes in history), trust in the Federal government and Federal Reserve are almost nonexistant.
Here is chart of the purchasing power of the US Dollar (blue line) since the creation of The Federal Reserve system and core CPI YoY which is still relatively high at 4.86%. That is over twice The Fed’s target rate of 2%.
I am sure that Billions Biden doesn’t understand moral hazard risk. For him, there is no risk, But for the middle class and lower wage worker class, CBDC represent a clear moral hazard risk, particularly if cash vanishes and Congress tries to ban cryptos.
The face of why so many Americans don’t trust The Fed. Or The Biden Administation.
Or this face, Urban Joe Biden (Stalin was Country Joe).
Bidenomics, which is also Yellenomics (the former Fed Chair and current Treasury Secretary) has The Good, The Bad and The Ugly to say for it.
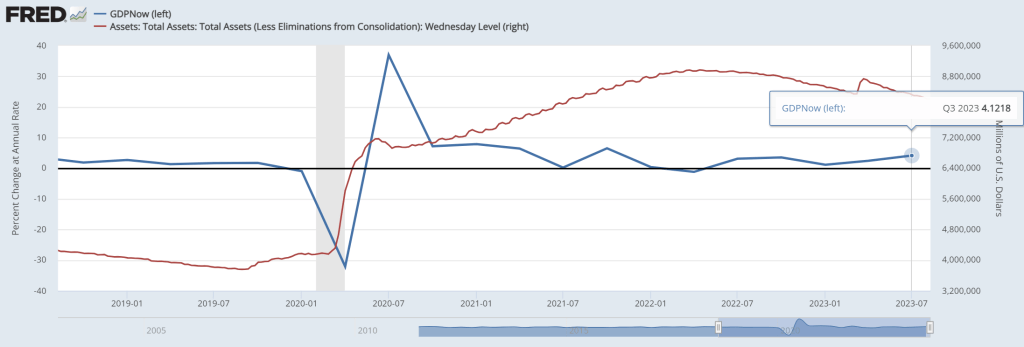
First, The Good! The Atlanta Fed’s GDP Now real time GDP tracker has Q3 GDP at … 4.12%. Pretty good, but bear in mind that there is still more than $8 trillion in Fed Monetary Stimulus outstanding (aka, Yellenomics).
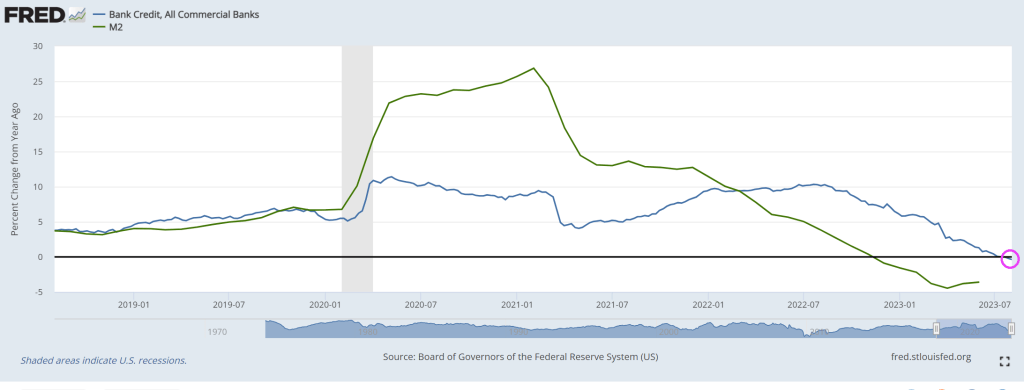
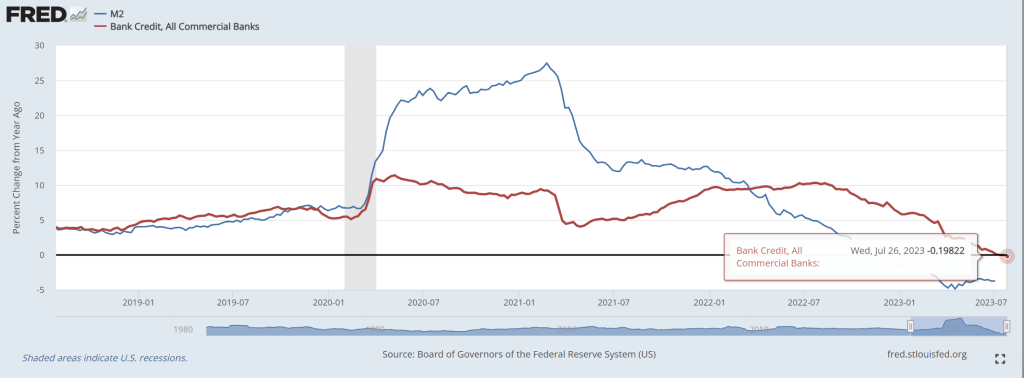
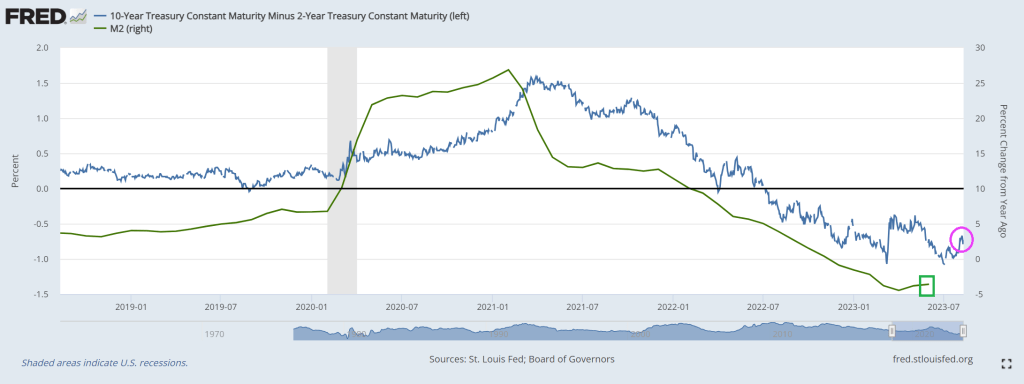
Second, The Bad. Bank credit growth is now negative.
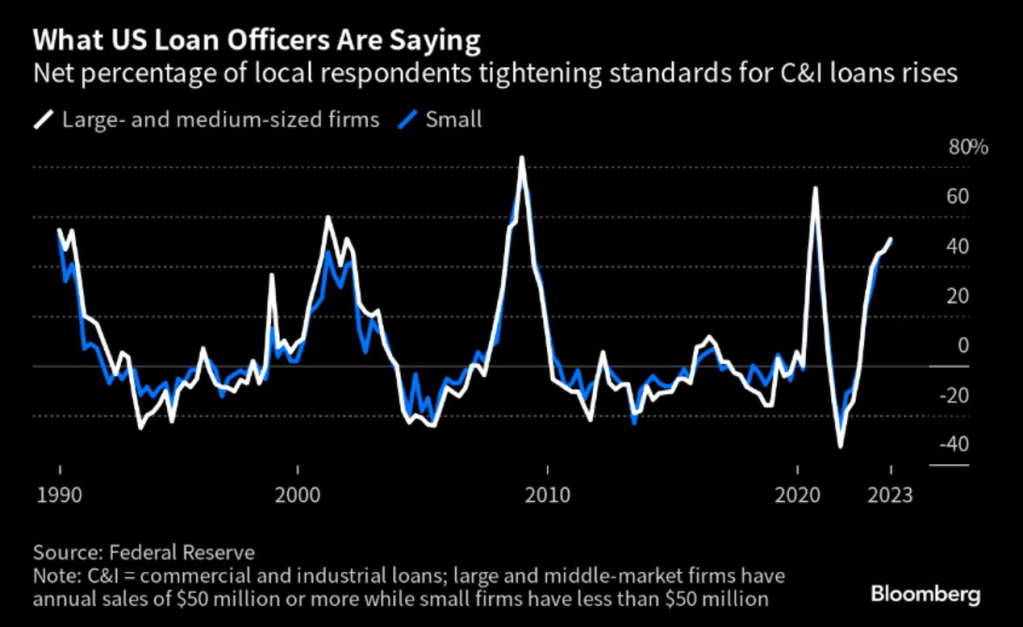
As lenders are tightening credit standards for commercial and industrial loans.
The ugly? There are several candidates for this dishonor.
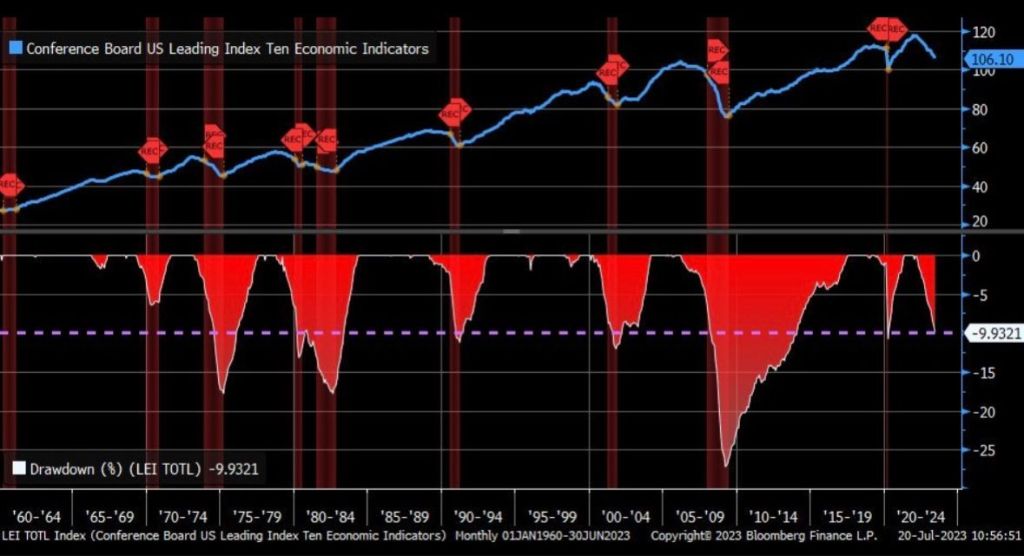
One, The Conference Board’s leading economic indicators is down -10.
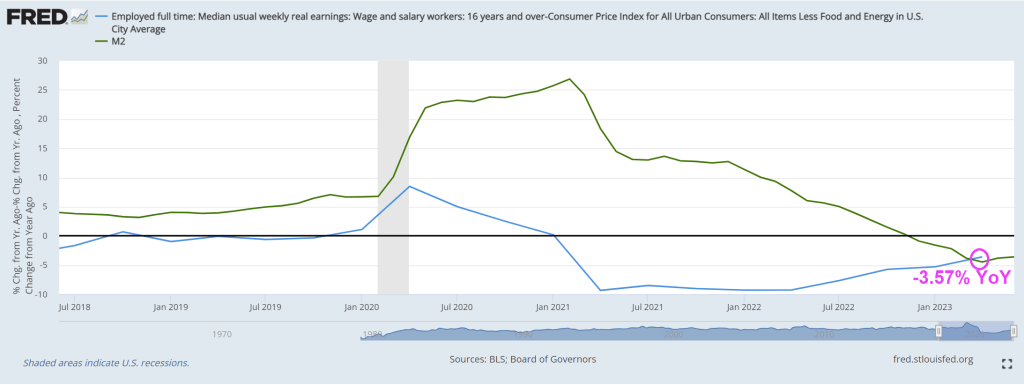
Two, REAL median weekly earnings growth remains negative at -3.57% YoY.
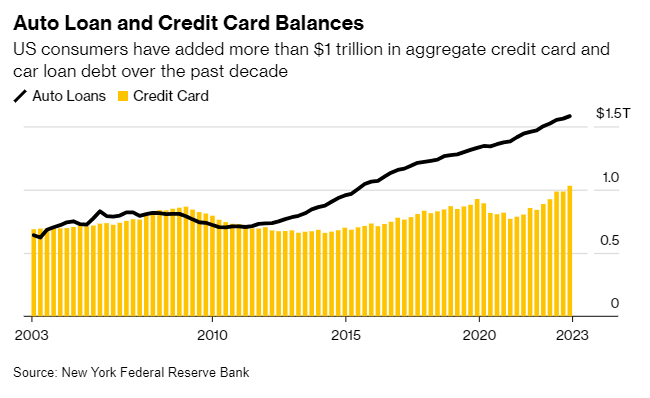
Third, auto loan and credit card balances are at $1.5 TRILLION making further consumer credit more difficult to finance GDP growth.
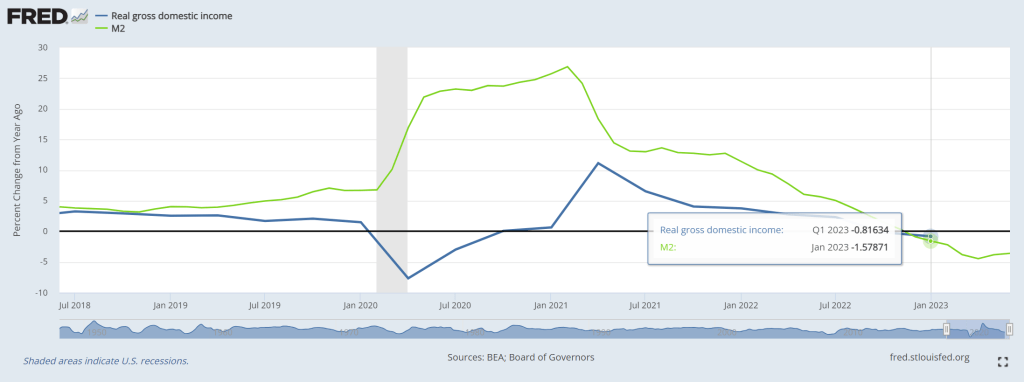
Fourth, Real Gross Domestic Income growth was negative in Q1 2023.
I could go on and on about the negatives of Bidenomics (e.g., massive distortion of Federal spending towards green energy and big donors). Isn’t the earth moving closer to the Sun in its elliptical orbit?? HOW is spending trillions on green energy work as we move closer to the Sun??
During the COVID-19 pandemic the occurrence of remote work jumped, out of sheer necessity. The technology was already available, but the pandemic accelerated its adoption and bypassed the hesitation of employers to allow people working from home. In many cases, remote work has been successful and therefore seems to have become a permanent feature, often in hybrid form. For employers, it has become an employee benefit to attract people in a tight labor market and it saves on office space costs. The flipside of the latter is that demand for office space has seen a structural downward shift. It is estimated that the underlying value of office space in New York City has permanently declined by 39%. This suggests that at current prices, there is a bubble in commercial real estate. In this special we are particularly interested in the implications for financial stability and the economic outlook. First we take a look at the development of commercial real estate prices and commercial real estate lending. Then we discuss the Fed’s recent stress test on large banks that included a large decline in commercial real estate prices. In contrast to the Fed’s exercise, we show that distinguishing between large and small banks provides a sharper picture of the vulnerabilities in the US economy. In particular, the connection between commercial real estate and small banks, through commercial real estate lending, could pose a threat to financial stability and make a recession worse.
Commercial real estate heading south
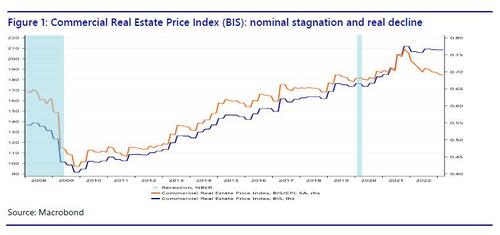
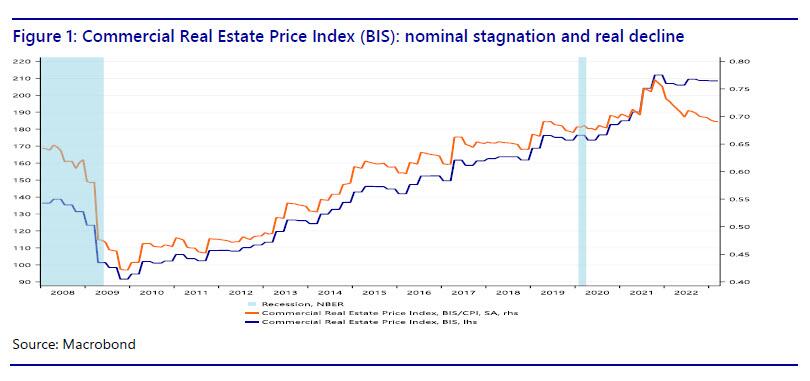
If we plot the BIS commercial real estate price index, it is clear that since the Great Recession, commercial real estate (CRE) prices have more than doubled in nominal terms (the blue line in Figure 1), but have moved sideways since 2021. This suggests that prices have reached a plateau. However, in recent years inflation has obscured the movement of CRE prices in real terms (the orange line), which shows a peak in 2021, but since then there has been a decline, almost to the level during the COVID-19 pandemic. In other words, CRE prices are already failing to keep up with inflation. Is this an indication that the CRE bubble is already deflating? With nominal CRE prices remaining elevated, most of the nominal price correction is likely still to come. If the 39% estimate by Gupta et al. for New York City is representative for the entire United States, we are heading for a major decline in CRE prices.
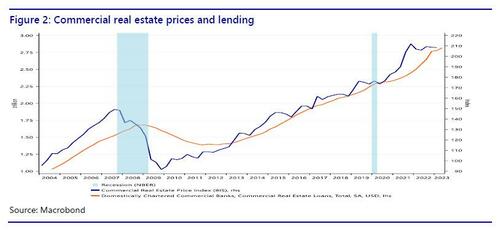
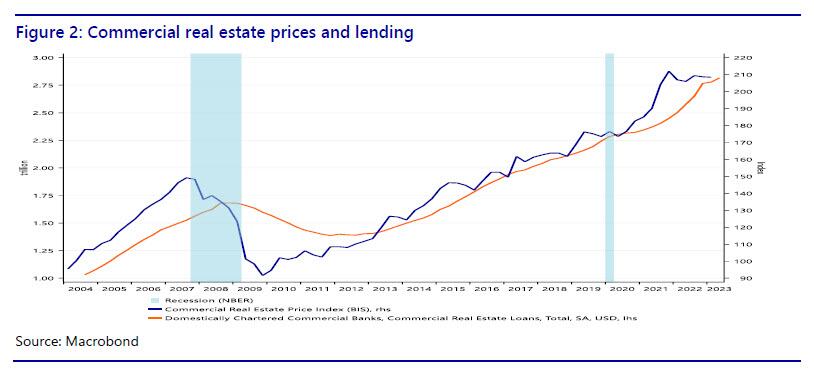
We can also plot the BIS index against CRE lending to show3 that rising prices for commercial real estate sparked a credit boom in commercial real estate (Figure 2). Given the academic literature linking financial crises to credit booms and busts, this should be cause for concern. Moreover, Minsky (1986) notes that an emphasis by bankers on the collateral value and the expected values of assets (instead of cashflows) is conducive to the emergence of a fragile (as opposed to a robust) financial structure.
If excess demand for office space pushed up commercial real estate prices, and if that increased CRE lending by banks, what does a structural downward shift in demand for office space mean? If CRE prices are deflating, what does that mean for the indebted CRE sector? Is this going to lead to defaults? And what does that mean for the banks that did the CRE lending? Is the deflation of the CRE bubble a threat to financial stability? Also note that due to the steep hiking cycle by the Fed, some companies in the CRE sector may find it difficult to refinance their loans at substantially higher rates.
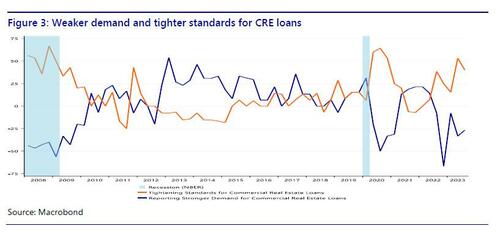
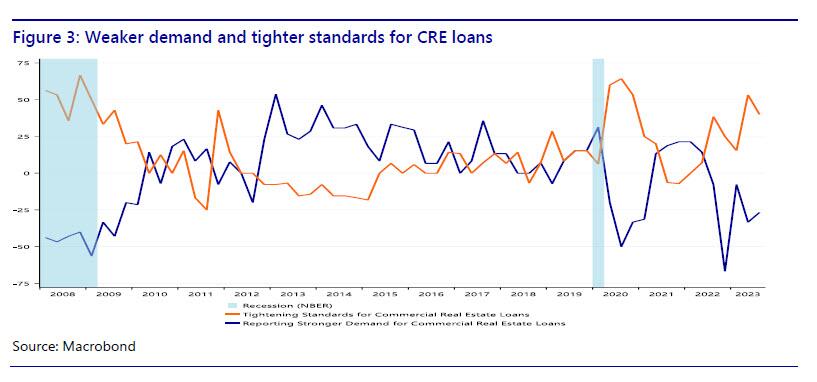
We can dig deeper by looking at the demand and supply developments in CRE lending. If we look at the Fed’s SLOOS data (figure 3), it is clear that demand for CRE loans strengthened especially between 2012 and 2017. Lending standards loosened between 2012 and 2015. This era coincides with a strong rise in the CRE price index, which may have motivated banks to expand CRE lending. Demand for CRE loans weakened during the pandemic, then bounced back as the economy reopened, but headed south again in 2022. Loan standards tightened during the pandemic, then loosened again when the economy rebounded, but have tightened since 2021. In other words, there seems to be a correlation between CRE prices and demand and supply developments in CRE lending. Currently, both are heading south, if we look at CRE prices in real terms and CRE lending in terms of net demand. It seems that rising CRE prices sparked a credit boom in CRE and now that the CRE price bubble is deflating, the CRE sector has less appetite to borrow and banks are tightening their lending standards.
The Fed’s incomplete stress test
CRE prices are falling in real terms and credit for the CRE loans is tightening. Does this pose a problem to the economy? Not if we believe the Fed’s June 28 press release that accompanied the annual bank stress test. The stress test looked at “a severe global recession with a 40 percent decline in commercial real estate prices, a substantial increase in office vacancies, and a 38 percent decline in house prices. The unemployment rate rises by 6.4 percentage points to a peak of 10 percent and economic output declines commensurately.” However, according to the Fed “all 23 banks tested remained above their minimum capital requirements during the hypothetical recession.” Therefore, the central bank concluded that “large banks are well positioned to weather a severe recession and continue to lend to households and businesses even during a severe recession.” However, one line in the press release reveals the main problem with the Fed’s stress test: “The banks in this year’s test hold roughly 20 percent of the office and downtown commercial real estate loans held by banks.” So where is the remaining 80%? If the stress test considers a huge decline in commercial real estate prices, it might be relevant to know how this affects the banks that hold 80% of the CRE loans made by banks. Therefore we take a closer look at CRE lending by large and small banks in the next section.
Bank lending: large vs small banks
We already saw in figure 2 that the rise in CRE prices until 2022 was accompanied by an increase in CRE lending. However, there is more to this story of we take a closer look at who has been doing the lending. So far we looked at aggregate bank lending to the CRE sector, without distinguishing between different types of banks. However, a closer look at the banking sector reveals a disturbing vulnerability that could be a threat to financial stability.
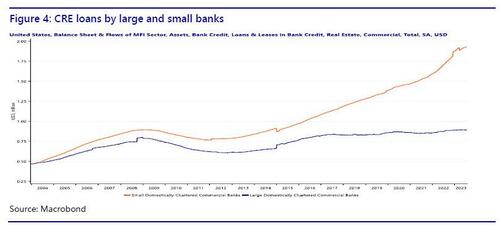
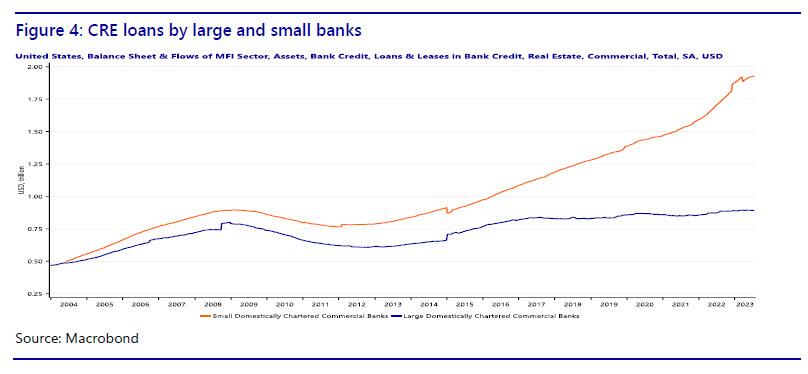
The Fed data on commercial banks distinguish between large and small banks. Large domestically chartered commercial banks are defined as the top 25 domestically chartered commercial banks ranked by size. Small domestically chartered commercial banks are defined as all domestically chartered banks outside of the top 25. Note that according to this definition a bank of say $80 billion would still be considered ‘small.’ In figure 4 we show how CRE lending has evolved, distinguishing between large and small banks.
It turns out that CRE lending by large banks has hardly increased in the last 15 years, while at the same time CRE lending by small banks has more than doubled. In other words, the growth in loans to commercial real estate has come from small banks. In fact, small banks have taken over the role of main provider of commercial real estate loans. Therefore, the Fed’s stress test omits the most relevant part of the banking sector for commercial real estate. While commercial real estate lending by large banks has remained stable since 2006, commercial real estate lending by small banks has increased rapidly. We could even talk of a credit boom in commercial real estate loans provided by small banks.
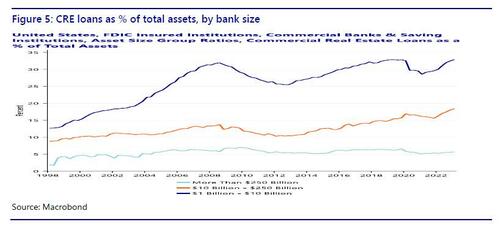
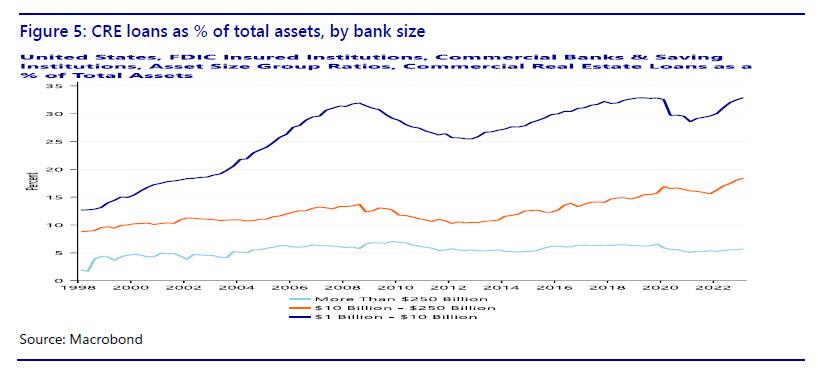
Whether the increased share of CRE lending by small banks is a problem also depends on the relative importance of CRE loans for small banks (Figure 5). FDIC data (Quarterly Banking Profile) distinguish at least three classes of asset size: more than $250 billion, $10-250 billion, and $1-10 billion. The first class contains only large banks as defined by the Fed stress test, the second class is a mix of large and small banks, the third class only contains small banks. While for the largest banks, CRE loans were only 5.7% of total assets in the first quarter of 2023, for the smallest banks this is 32.9%! For the intermediate-size banks the CRE loans are 18.4% of assets. So not only is 80% of the CRE bank loans made by small banks, these loans also make up a much larger fraction of the balance sheet of small banks.
Finally, it is important to note that small banks are regional banks. In fact, the US has so many small banks because for much of its history it was difficult for banks to open a branch in another state. This legislation has been abolished, and the amount of banks in the US has fallen, but there are still many small banks with predominantly regional clients. This means that CRE risk in small banks is also regionally concentrated. Instead of a diversified nationwide CRE loan portfolio, a small bank tends to make loans to local borrowers. Consequently, if commercial real estate in a region turns sour, the small banks in the area will be highly exposed. Bubble or not, any adverse development in the CRE sector is going to hit small banks harder than large banks.
The commercial real estate-small bank nexus brings together two vulnerable sectors that could rapidly deteriorate in a self-reinforcing loop. Small banks have already shown vulnerable to higher interest rates and deposit outflows in March and commercial real estate is high on the list of financial stability concerns of US regulators. We have shown that the two sectors are critically connected and in the next section we speculate on the feedback mechanisms that could arise and make things worse.
Roads to ruin: feedback mechanisms
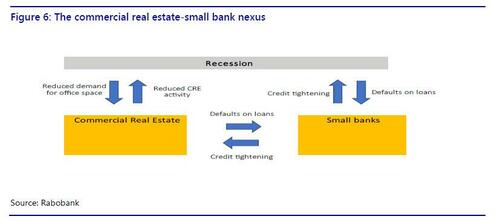
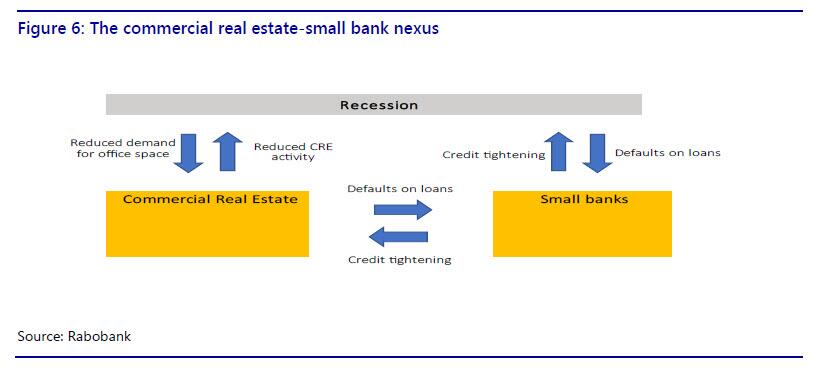
The commercial real estate-small bank nexus allows for several scenarios in which both sectors could be destabilized. In the first two scenarios, a crisis occurs in one sector, causing problems in the other sector. Tighter credit and reduced activity in the CRE sector could push the economy into a mild recession. In the third scenario, a mild recession causes problems in both sectors, which could then reinforce each other and make the recession worse.
In scenario 1, a small banking crisis leads to problems in CRE. Given that the majority of CRE loans have been made by small banks, continued problems for small banks, caused by or leading to deposit flight, could force them to tighten lending to the CRE sector. This would reduce the supply of credit to CRE, causing additional problems for the CRE sector, on top of office vacancies and stagnating prices.
In scenario 2, a CRE crisis causes small banks to collapse. Even if small banks stabilize in the near future from the recent deposit flight problems, they could subsequently be dragged down by a crisis in the CRE sector. Defaults in CRE will asymmetrically hurt small banks rather than large banks, because of the concentration of CRE risks at small banks. This could lead to a new round of deposit flight from small banks to large banks and money market funds. The losses on loans and loss of funding could be lethal to small banks.
In scenario 3, a mild recession could cause a small banking crisis and a CRE crisis. In turn, this could lead to a more severe recession. A mild recession, for example caused by the Fed’s hiking cycle, will hurt the banking sector and the CRE sector at the same time. In particular, a recession would further reduce demand for office space. This will add to the problems in the CRE sector. Increased CRE defaults will hurt banks, especially the smaller ones with relatively more exposure to CRE. Losses on CRE loans will force banks to tighten credit, including for the CRE sector. The self-reinforcing problems in the two sectors could further drag down the overall economy, making the initially mild recession more severe. Specifically, tighter credit and reduced activity in the CRE sector will drag down GDP growth further.
We summarize the specific feedback mechanisms in the commercial real estate-small bank nexus in figure 6.
More broadly, we already saw in March how problems at small banks had an immediate adverse impact on financial markets. In combination with a faltering CRE sector this could severely undermine confidence among investors, consumers and businesses. This would have a broad-based negative impact on GDP growth.
Conclusion
COVID-19 appears to have a lasting negative impact on demand for commercial real estate. The federal regulators are aware of the risks in commercial real estate, but the Fed’s stress test provides a false sense of security. The finding that large banks are able to absorb losses on CRE loans in case of a CRE crisis is encouraging, but the bulk of CRE bank loans has been provided by small banks. In fact, while CRE lending by large banks has been stable, there has been a credit boom in CRE loans provided by small banks, more than doubling the amount since 2006. What’s more, small banks are more vulnerable to the CRE sector in terms of exposure and have already been hit by deposit outflows earlier this year. The commercial real estate-small bank nexus exposes the US economy to a vulnerability that could threaten financial stability and either cause a recession or make a recession more severe.
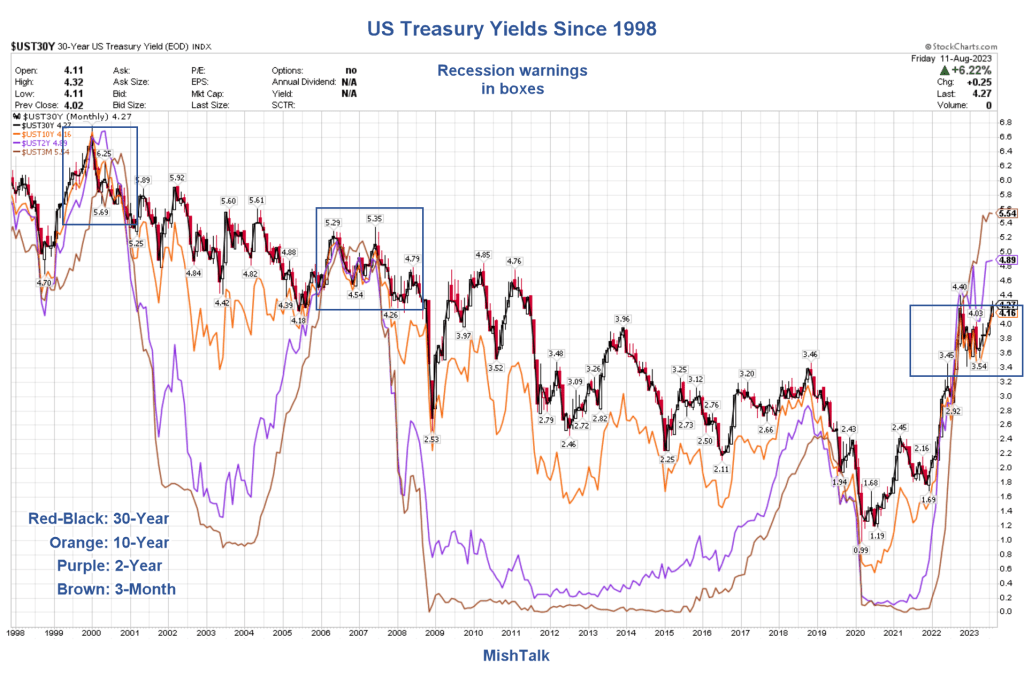
And another day, another inverted 10Y-2Y yield curve!
This chart goes along with negative bank credit growth.
Lastly, we have the Conference Board’s leading index plunging to -10!
Thanks in part to Cap’n Crunch, Fed Chair Jerome Powell!


You must be logged in to post a comment.