32 Tons! Corporate Bankruptcies Reach Highest Level Since 2010, Bank Term Funding Program At $102 BILLION (Total Debt & Unfunded Liabitilies = $224.5 TRILLION)

The US has passed the 32 trillion mark in national debt, and is going much, much higher. More like 32 tons on the back of taxpayers. When we add unfunded liabilities like Social Security, Medicare and Medicaid, the tab soars to $224.5 TRILLION.

New data show that a growing number of U.S. firms are collapsing under the weight of higher interest rates as corporate bankruptcies reached their highest first-half levels since 2010.

In the first six months of 2023, there were 340 corporate bankruptcies, topping every other comparable span in 13 years, according to S&P Global Market Intelligence. This is up 93 percent from the same time a year ago and higher than in 2020, when there was a spike during the early days of the coronavirus pandemic.

There were 54 recorded corporate bankruptcy filings in June, unchanged from the 54 bankruptcies in May. Last month, some of the most notable companies to submit filings were Lordstown Motors, Rockport Co., Instant Brands Acquisition Holdings, and iMedia Brands.

“Lordstown Motors Corp. filed for bankruptcy June 27, with plans to restructure its business and seek a buyer, according to a company release. The electric vehicle manufacturer’s assets include its Endurance pickup truck and related resources,” S&P noted in the July 6 report.

“Instant Brands Acquisition Holdings Inc. also sought bankruptcy protection June 12. The tightening of credit terms and higher interest rates had impacted the company’s liquidity levels, according to an official release. The company has also already secured $132.5 million from existing lenders and plans to continue discussions with its financial stakeholders.”

Year-to-date through June, 15 companies with more than $1 billion in liabilities filed for bankruptcy, such as Cyxtera Technologies, Diebold Holding, Bed Bath & Beyond, Diamond Sports Group., and Party City.

Epiq Bankruptcy, a U.S. bankruptcy filing data provider, confirmed that 2,973 total commercial Chapter 11 bankruptcies were filed in the first half of 2023, up 68 percent from the same period in 2022.

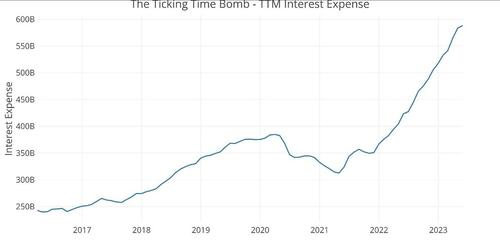
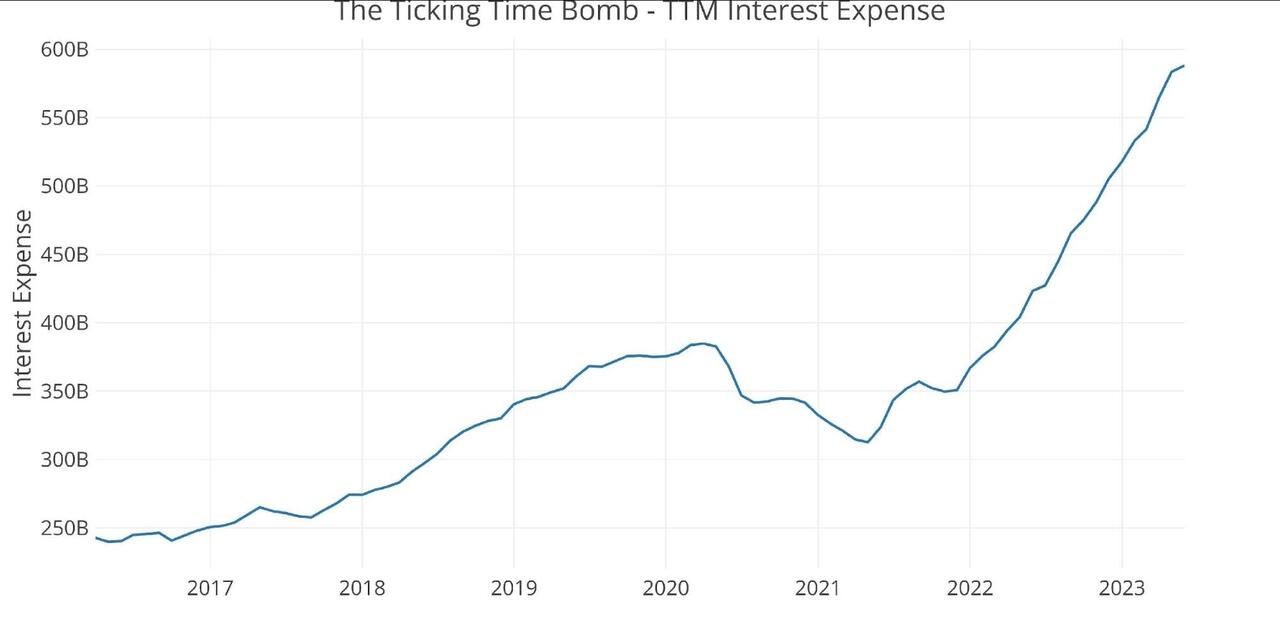
Higher Interest Rates Impacting Businesses

Banking experts purport that higher interest rates are the leading cause of the increase in corporate bankruptcies. Many businesses either maintain vast debt loans that will require refinancing or need more liquidity to stay afloat.

“The increase in commercial and individual bankruptcy filings during the first half of 2023 underscores the economic challenges faced by businesses and individuals,” said Mr. Gregg Morin, Vice President of Business Development and Revenue at Epiq Bankruptcy, in the report. “Our objective is to provide bankruptcy professionals with timely and accurate data necessary for analyzing stakeholder volumes and trends for making informed business decisions.”

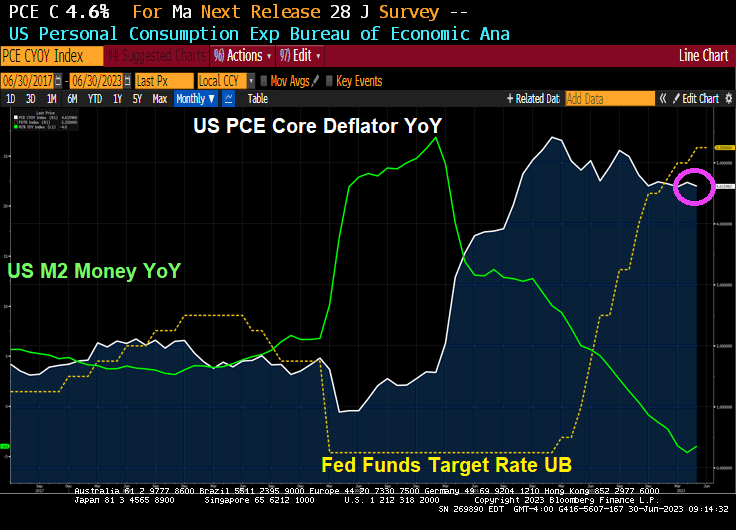
The situation could be exacerbated should the Federal Reserve pull the trigger on two more rate hikes this year. The futures market is penciling in a quarter-point boost to the benchmark fed funds rate at this month’s Federal Open Market Committee (FOMC) policy meeting.

Meanwhile, according to a recent Fitch Ratings report, the corporate default rate is projected to climb to as high as 4.5 percent in 2023, up from the previous forecast low of 2.5 percent. The updated projections reflected “the tighter lending conditions and capital access resulting from stress in the banking sector and inflation uncertainty.”

However, some argue that corporate bond market indicators are “less ominous.”

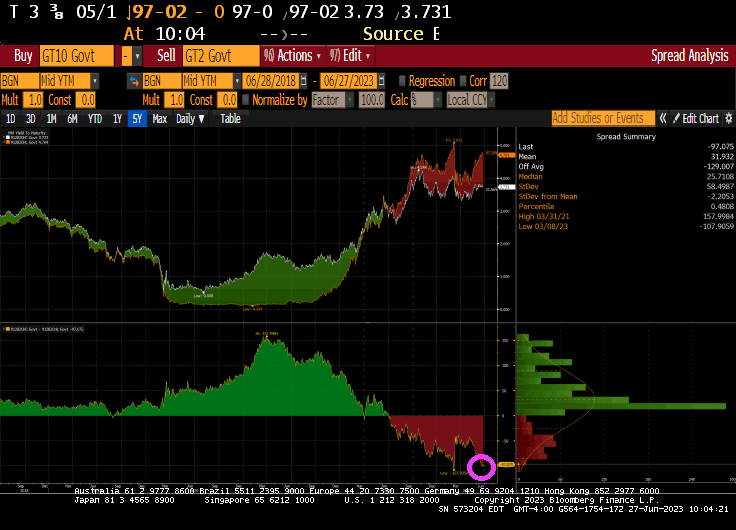
“The interest rate differentials, or spreads, between the 10-year U.S. Treasury note and investment grade (IG) and high yield (HY) corporate bonds continue to hover within their average width over the past 25 years, a bond market signal indicating the likelihood of a less severe recession, with traders pricing in fewer corporate defaults,” wrote John Lynch, the CIO at Comerica Wealth Management, in a research note.

Economists contend that the worst corporate bankruptcies typically occur one or two years into a recession. Today, they are happening before the official start of an economic downturn as the U.S. economy is still expanding.

What’s happening?

“Simple,” says Mr. Pete St. Onge, a Heritage Foundation economist, “banks aren’t lending.”

“Banks are battening down the hatches, hogging their bailout money instead of lending it out,” he said in a recent podcast. “That credit crunch means not only do we get bankruptcies like in any recession, on top of that, we get a lending wall that cuts off even the healthy businesses. Of course, their jobs go down with them.”

Since the Federal Reserve launched the Bank Term Funding Program (BTFP) following the Silicon Valley Bank collapse in March, financial institutions have kept tapping into these emergency lending facilities. After hitting a record high at above $103 billion at the end of June, it remains elevated at $102 billion.


32.5 trillion in debt and $192 trillion in unfunded liabilities which means a total of $224.5 total debt + liabilities.

This is Bidenomics. Spend trillions, borrow trillions, promise entitlements. Rinse, repeat.

Recession: It’s Already Here! US Household Net Worth Growth Goes Negative For 3 Consecutive Quarters (Worse Growth Since The Great Recession And Financial Crisis)

To quote Bill Paxton’s character from Twister: “It’s Already Here!”

The feared recession, that is.

The year-over-year growth rate in Household Net Worth has been negative for 3 consecutive quarters, the worst growth since The Great Recession and Financial Crisis of 2008/2009.

Of course, the Biden family household net worth is off the charts. As is the household net worth for other Washington DC politicians like Nancy Pelosi (Communist-CA). And AOC (Communist – NY).

Biden Drains Strategic Petroleum Reserve For 14th Straight Week (SPR Down -46% Under Bidenomics, Reg Gas Price UP 48%, Diesel Fuel UP 47%) Hunter In The West Wing With A Straw!

What is Bidenomics? It isn’t what Press Secretary Karine Jean Pierre thinks. She said Biden hates “trick down economics”. Instead, Biden prefers a Soviet-style command economy where The Federal Government spends trillions of dollars and directs where the money goes. We also have the Socialist Federal Reserve that relies on rate manipulation to achieve policy results.

A good example of Biden’s Soviet-style “Bidenomics” is his use of the Strategic Petroleum Reserve (SPR). Biden has now drained almost 50% of the SPR from when he was sworn in as President. And has drained the SPR for 14 straigth weeks to manipulate gasoline and diesel fuel prices in an effort to lower fuel prices ahead of the 2024 Presidential election. Watch Biden suddenly stop caring about fuel prices once he wins reelection!

After last week’s huge draw, expectations were for a smaller draw (which API showed last night), but the actual crude draw was smaller – just 1.5mm barrels. Stocks at the Cushing hub fell 400k barrels and products also saw notable draws..

At least we now know who left cocaine in the White House!

Bidenomics! US Factory Orders Decline YoY For First Time Since Oct 2020 As Fed Retreats (Economy Is Slip, Slidin’ Away!)

The closer we get to the 2024 Presidential election, the more the economy is slip slidin’ away.

As Powell and The Gang raise interest rates, the more the economy is … slip slidin’ away. US Manufacturers New Orders YoY in May declined -1.0% for the first time since Covid.

But as M2 Money growth slows, its getting late in the election cycle.

Too soon?

Bidenomics At Work! UMich Buying Condition For Houses Rises … To 67% Lower Under Biden Than Pre-Covid Trump (Bitcoin Cash UP 21.5%, Gold/Silver Up Slightly)

The University of Michigan consumer survey results are out and there is good news! Sort of.

The UMich Buying Conditions for Houses rose to 47 in July! That is the good news. The bad news? It was at 142 in the last month before Covid and the economic/school shutdowns.

That is -67% lower than under pre-Covid Trump.

Nothing has been the same since Covid (aka, the Wuhan China Lab virus) where our corrupt politicians and lame street media (aka, government cheerleaders) show no interest in finding out what really happened.

Bitcoin cash is up 21.5% today.

Gold and silver are up today. Too bad I can’t buy nickel coins.

The Walking Dead’s Megan. The honorary symbol of Bidenomics.

The Core! US PCE Core Deflator Remains High At 4.6%, Spending Slows (Taylor Rule Suggests Fed Funds Target Rate Of 10%, Halfway To Target!!)

The film “The Core” was a silly film, but core inflation in the US is a serious problem for the middle class and low-wage workers. It remains elevated despite Treasury Secretary Janet “The Marxist Gnome” Yellen saying it was “transitory.” Looks pretty permanent to me!

The Federal Reserve’s preferred measures of US inflation cooled (slightly) in May and consumer spending stagnated, suggesting the economy’s main engine is starting to lose some momentum. 

The personal consumption expenditures price index rose 0.1% in May, Commerce Department figures showed Friday. From a year ago, the measure eased to the slowest pace in more than two years.

Consumer spending, adjusted for prices, was little changed after a downwardly revised 0.2% gain in April. From February through May, household spending has essentially stalled after an early-year surge. Spending on merchandise dropped, while outlays for services increased.

Excluding food and energy, the so-called core PCE price index increased 4.6% from May 2022. That’s in line with annual readings back to late 2022 and shows minimal relief from elevated price pressures. Economists consider this to be a better gauge of underlying inflation.

IndicatorActualEstimate
PCE price index (MoM)+0.1%+0.1%
Core PCE price index (MoM)+0.3%+0.3%
PCE price index (YoY)+3.8%+3.8%
Core PCE price index (YoY)+4.6%+4.7%
Real consumer spending (MoM)0.0%+0.1%

Under the hood of the government report, a key metric flagged by Fed Chair Jerome Powell showed a welcome slowdown. Services inflation excluding housing and energy services increased 0.2% in May from a month earlier, the smallest advance since July of last year, according to Bloomberg calculations. The figure was up 4.5% from a year ago. 

The Taylor Rule now suggests a target rate of 10%. We are just halfway to target!

Meanwhile, Yellen Plans July China Trip, While US Preps Investment Curbs. Trying to convince China that the US won’t default on its $32 TRILLION and growing debt?

Biden Meal! Treasury Bill Barrage Is Just a Prelude to Longer-Term Debt Deluge (Ticking Time Bomb Of Debt With Interest Payments Skyrocketing!)

Jay Leno once quipped about the Obama meal. “Order anything you want and hand the bill to the person standing behind you.” Biden, like his boss Obama, is praciticing a similar strategy. Spend like a drunken sailor and just keep borrowing until the whole thing breaks.

The barrage of fresh Treasury bills poised to hit the market over the next few months is merely a prelude of what’s yet to come: a wave of longer-term debt sales that’s seen driving bond yields even higher.

Sales of government notes and bonds are set to begin rising in August, with net new issuance estimated to top $1 trillion in 2023 and nearly double next year to fund a widening deficit. The Treasury is already in the middle of an estimated $1 trillion bump in bills as it seeks to replenish its cash coffers in the wake of the debt-limit deal. 

It’s an explosive mix for borrowing costs as debt sales are swelling and the Federal Reserve continues to reduce its balance sheet at a time when traditional buyers of Treasuries overseas are discouraged by currency hedging costs.

“A worsening fiscal profile, amid fairly modest spending cuts, suggests that the upcoming supply deluge will not be limited to T-bills,” wrote Anshul Pradhan, head of US rates strategy at Barclays Plc. “The Treasury will soon need to increase auction sizes meaningfully across the curve. We believe the rates market is too complacent.”

Barclays strategists predict the net rise in coupon-bearing debt from August to year-end will be nearly $600 billion. And that would only ramp up in 2024, they say, with an annual figure of $1.7 trillion. That would be nearly double this year’s expected debt issuance.

Pradhan says he doesn’t think the market appreciates the increase in issuance that’s going to be needed due to wide budget deficits and the fact the Treasury won’t want bills to become a substantial share of the total debt.

Total net new bill sales are set to bring their share of US debt to about 20%, according to JPMorgan Chase & Co. The issuance would hit a threshold seen by the Treasury Borrowing Advisory Committee as the upper limit for the US to fund deficits at the least possible cost to taxpayers.

Bank of America Corp. says the supply deluge could result in a “demand vacuum” for longer maturity bonds that could push yields higher and tighten financial conditions.

The problem isn’t purely a function of more debt. The bigger issue is that this new debt comes with a much steeper price tag. Interest on the national debt is rising at an alarming clip.

The trailing 12-month (TTM) interest on the debt clocked in at just under $600 billion in May. This was up from $350 billion at the start of 2022, less than 18 months ago. The government has added an extra $250 billion in expenses per year on just debt service.

This is just the beginning of an upward trend. Based on the current interest payments, the Treasury is paying less than 2% interest on the total debt. But a lot of the debt currently on the books was financed at very low rates before the Federal Reserve started its hiking cycle. Every month, some of that super-low-yielding paper matures and has to be replaced by bills, notes and bonds yielding much higher rates. That means interest payments will quickly climb much higher unless rates fall.

Looking at the Treasury sale on June 26 reveals the extent of the problem. The Treasury sold $162 billion in securities, with $120 billion in short-term Treasury bills with high yields.

  • $58 billion in six-month bills at an investment yield of 5.45%
  • $62 billion in three-month bills at an investment yield of 5.34%.
  • $42 billion in two-year notes at a high yield of 4.67%, amid very strong demand. Longer-term yields are still far below short-term yields.

With this flood of Treasury bills, the share of short-term paper underpinning the debt is approaching 20%. That’s considered the upper limit, meaning the Treasury will soon have to turn to issuing longer-term notes and bonds. That means the Treasury will be locking in higher interest rates for the long term.

Tweedle dee and tweedle dum(ber).

Bidenville! Case-Shiller National House Price Index Decreased 0.2% Year-over-Year in April As Liquidity Evaporates (Miami Rises 5.18%, Seattle Down -12.43%, San Francisco Down -11.14%)

Wasting away again in Bidenville!! Looking for my lost national housing market.

The S&P CoreLogic Case-Shiller U.S. National Home Price NSA Index, covering all nine U.S. census divisions, reported a -0.2% annual decrease in April, down from a gain of 0.7% in the previous month. The 10-City Composite showed a decrease of -1.2%, down from the -0.7% decrease in the previous month. The 20-City Composite posted a -1.7% year-over-year loss, down from -1.1% in the previous month.

The winners in April? Miami and … Chicago?

The biggest losers in April? Seattle and San Francisco both suffered YoY losses over -11%.

The US Treasury 10Y-2Y yield curve remains steeply inverted at -97 basis points.

Silverado! US Treasury 10Y-2Y Yield Curve Remains Inverted At -102.7 (244th Straight Days Of Inversion) As Liquidity Evaporates (Silver UP >1%) Bitcoin CASH UP 12% This AM

Silverado! No, not the Chevy full-size pickup truck, but the precious metal Silver is up over 1% this morning!

The US Treasury 10Y-2Y yield curve remains inverted at -102.7 basis points for the 244th straight day as M2 Money YoY (aka, liquidity) evaporates.

Silver is up over 1% this morning.

Bitcoin Cash is up12.39% this morning.

Speaking of Silverado, a fully loaded new 2023 Chevy Silverado 1500  ZR2 costs around $100,000. Thanks Biden and Powell (BiPow?). Try financing that purchase with auto loan rates soaring!

Fed Inferno! US M2 Money-Supply Growth Falls To Depression-Era Levels For Second Month In April (As M2 Money Velocity Remains Near Historic Lows)

It is truly a Fed Inferno!

Money supply growth fell again in April from Jerome Powell And The Fed, plummeting further into negative territory after turning negative in November 2022 for the first time in twenty-eight years.  April’s drop continues a steep downward trend from the unprecedented highs experienced during much of the past two years.

Yes, The Fed is printing money like it is going out of style! The war on Covid was similar to other wars fought where the US printed boatloads of money to pay for WWI. WWII, Korea and Vietnam wars. And the war against the middle class (known as The Best Depression). Apparently, The Fed is still waging war against the middle class.

US M2 Money VELOCITY (GDP/M2) is near an all-time low after The Fed went berserk with money printing to combat the Covid economic and school shutdowns.

Then with The Fed’s massive monetary expansion and sudden contraction, we have REAL average weekly earnings growth YoY in negative territory for 25 straight months.

The Walking Dead’s Negan, the poster child for The Federal Reserve.