The US Silent Depression! Horrible Jobs Market, Soaring Debt, REAL Wages Down 4.4% Under Biden, Soaring Budget Deficits (And All Biden Can Talk About Is Funding Ukraine While Leaving Our Borders Wide Open To Invasion)

Silence is not golden. Particularly when it comes to a silent DEPRESSION. Talking is cheap, people follow like sheep. Particularly when are told by Biden, Press Secretary Karine Jean-Pierre and NY Times economic spinster Paul Krugman say its the best economy in decades. It isn’t. In fact, the US is in a silent depression.

Typically, a recession is defined as two consecutive quarters of negative GDP growth. If we use 2 consecutive quarter of negative GDP growth, we are not in a recession. But ….

Challenges include increasing part-time employment in recent months, declining household employment in three of the last four months for a net decline of 398,000 job holders, mounting public debt burdens, and declining real wages, which have fallen by 4.4 percent since January 2021. Again, just look at the WORST jobs report from January.

Why these results? Bidenomics is based on costly Keynesian boom-and-bust policies. With so much whiplash, it’s no wonder people are conflicted about the economy.

In the latest jobs report for January, a net increase of 353,000 nonfarm jobs from the establishment survey appears robust, as it was well above the consensus estimate of 185,000 new jobs. But let’s dig deeper. 

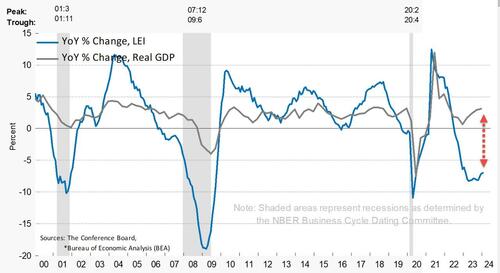
Last month, household employment declined by 31,000, contradicting the headlines. The divergence of jobs added between the household survey and the establishment survey has widened since March 2022. This period coincides with declining real gross domestic product in the first and second quarters of 2022 (usually that’s deemed a recession, but it hasn’t been yet). Indexing these two employment levels to 100 in January 2021, they were essentially the same until March 2022, but nonfarm employment was 2.5 percent higher in January 2024.

While this divergence mystifies some, a primary reason is how the surveys are conducted. 

The establishment survey reports the answers from businesses and the household survey from individual citizens. The establishment survey often counts the same person working in multiple jobs, while the household survey counts each person employed. This likely explains much of the divergence, as many people work multiple jobs to make ends meet. The surge in part-time employment and more discouraged workers underscores

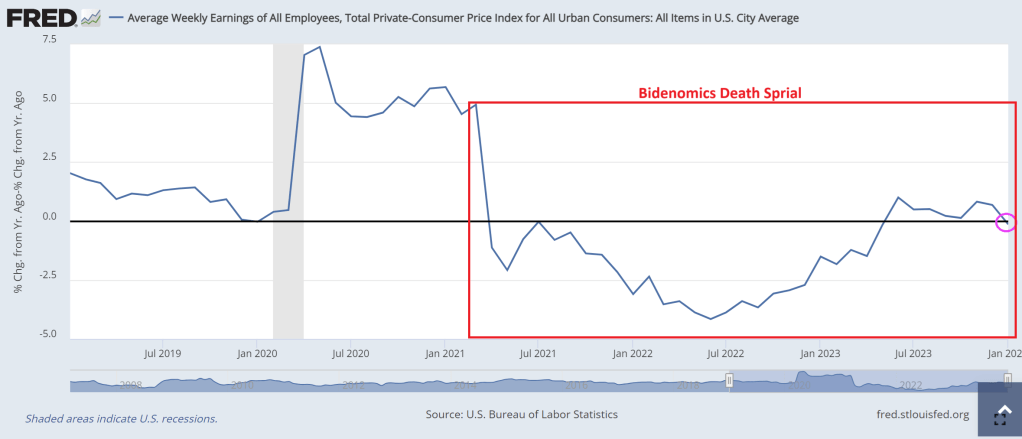
Though average weekly earnings increased by 3 percent in January over a year prior, this is below inflation of 3.1 percent. Real average weekly earnings had increased for seven months before falling last month. And there had been declines in year-over-year average weekly earnings for 24 of the prior 25 months before June 2023. These real wages are down 4.4 percent since Biden took office in January 2021.

As purchasing power declines, mounting debts become more urgent. 

Total US household debt has reached unprecedented levels, with credit card debt soaring by 14.5 percent over the last year to a staggering $1.13 trillion in the fourth quarter of 2023. Such substantial growth in debt raises concerns about the current (unsustainable?) consumption trends, business investment, and a looming financial crisis.

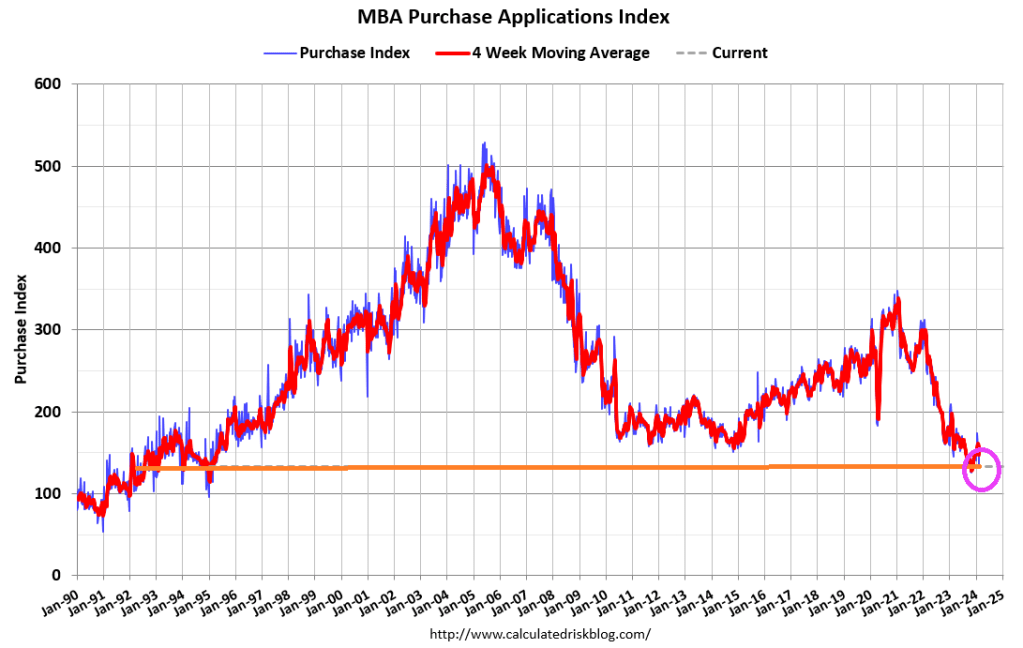
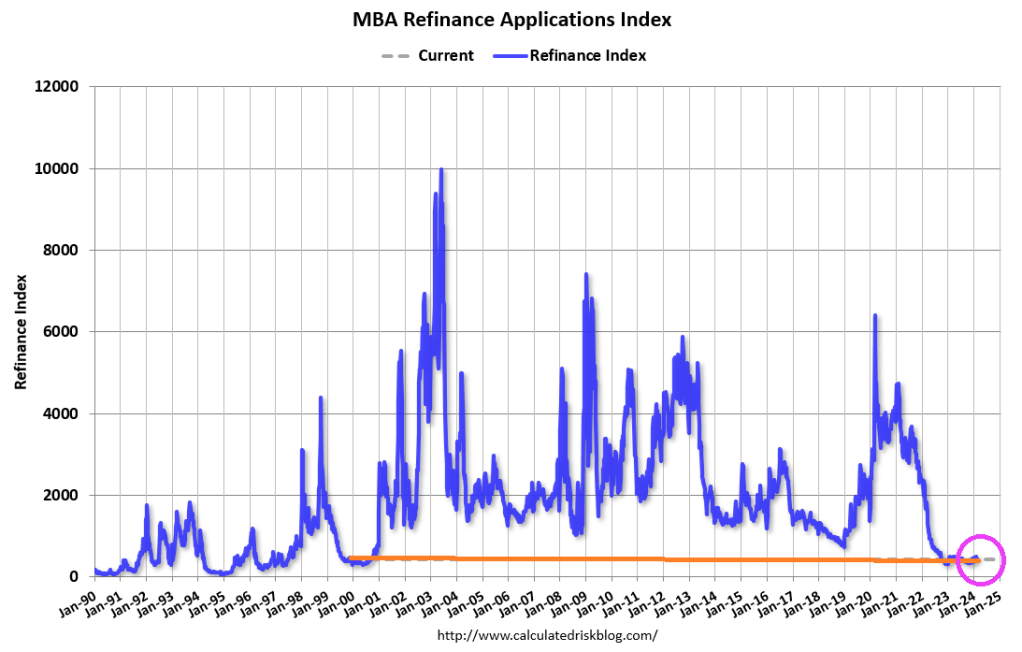
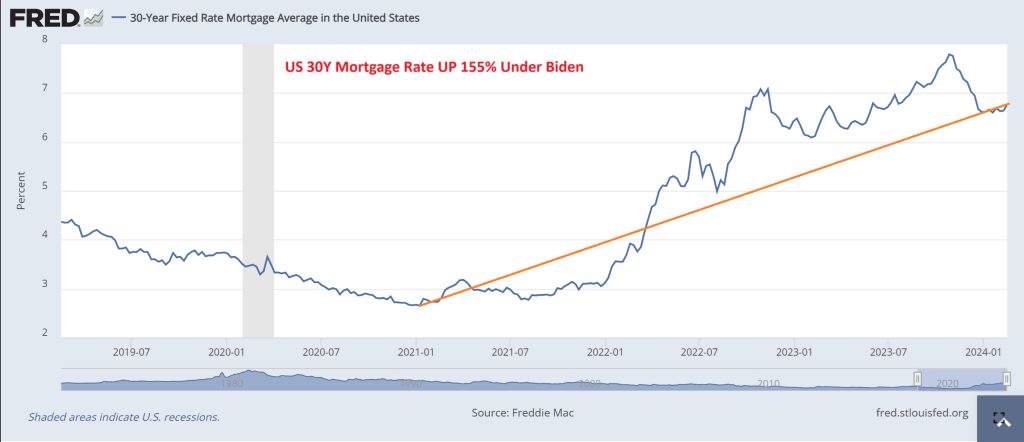
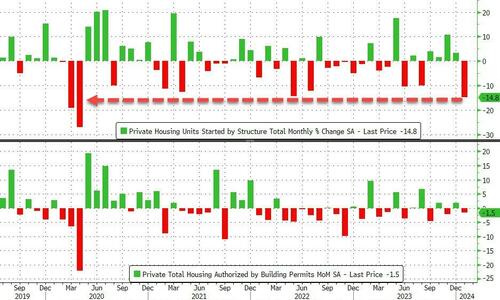
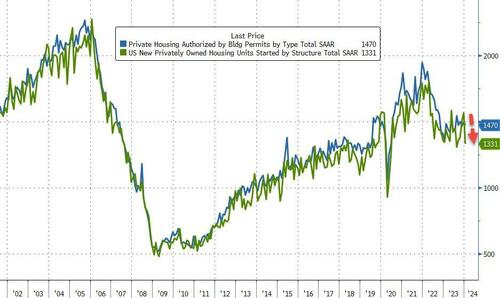
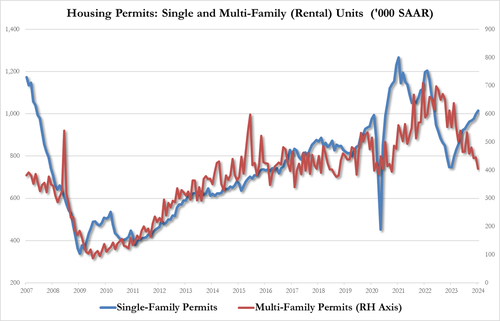
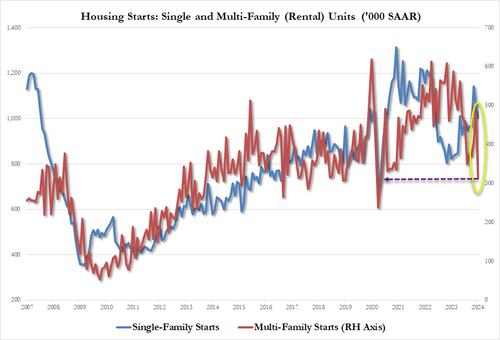
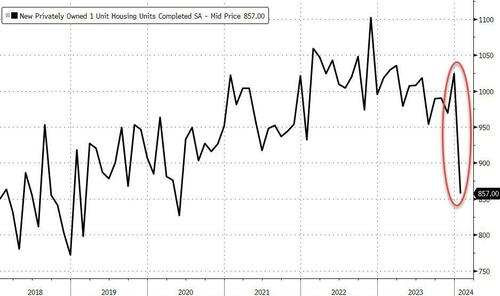
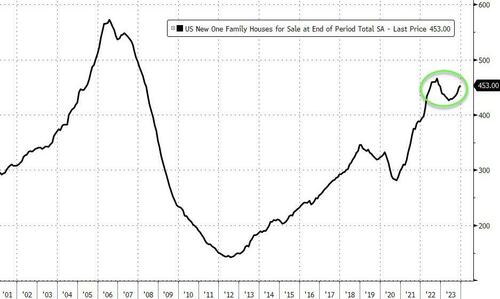
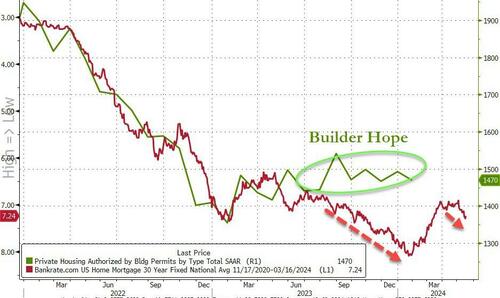
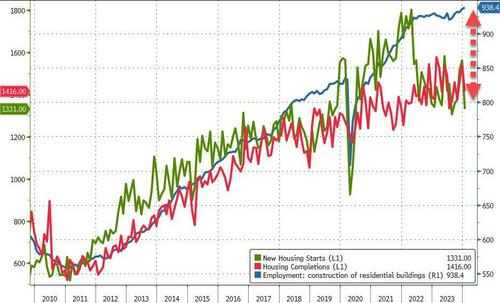
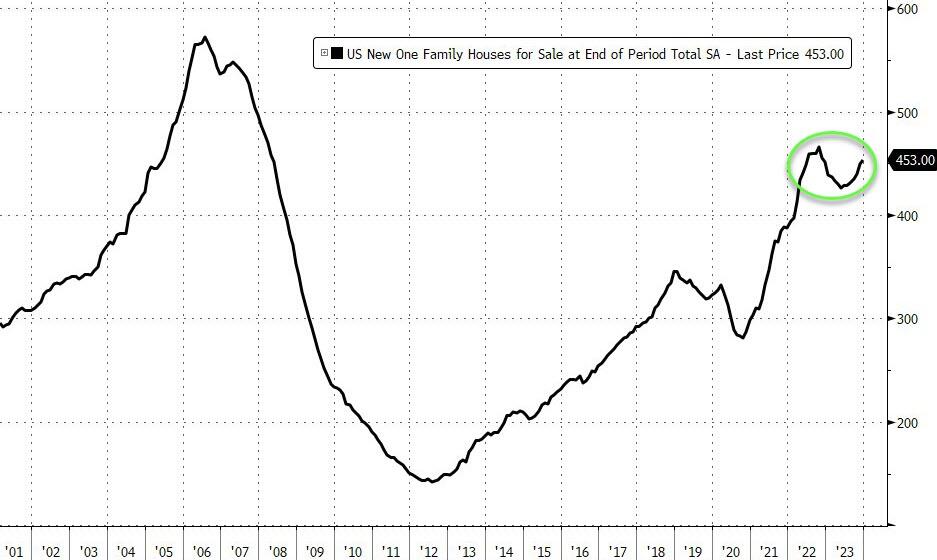
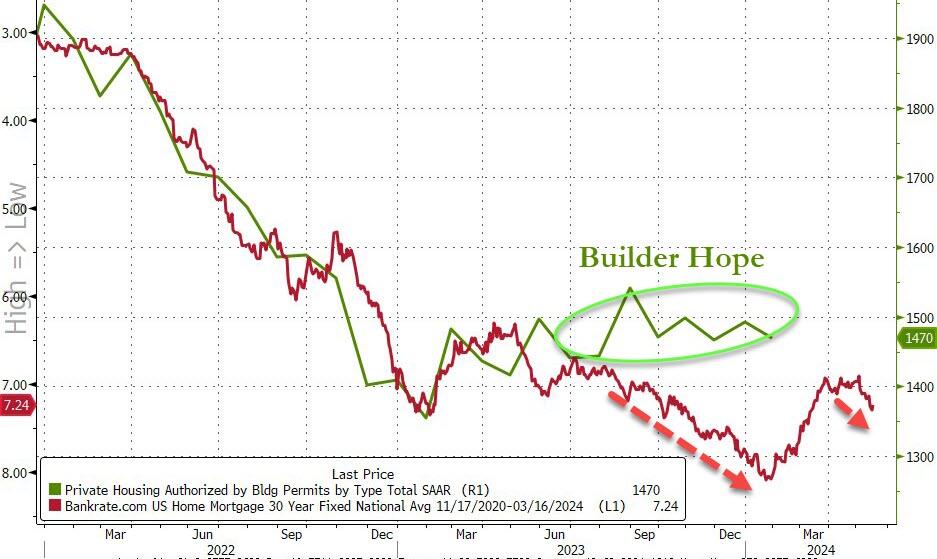
The surge in mortgage rates to over seven percent for the first time since December and rising home prices exacerbate housing affordability challenges, particularly for aspiring homeowners. An integral component of what some consider the “American Dream,” housing affordability is a major factor discouraging Americans.  Remember, Bidenomics has seen a 155% increase in mortgage rates.

The euphoria surrounding the January 2024 jobs report is misplaced. Policymakers should heed these warning signs and enact meaningful reforms to address root causes. 

Biden’s policy approach undergirds most of these difficulties. Bidenomics focuses on his Build Back Better agenda that picks winners and losers by redistributing taxpayer money for supposed economic gains through large deficit spending (and most of the gains went to political donors).

We haven’t seen an agenda of this magnitude since LBJ’s Great Society in the 1960s or possibly since FDR’s New Deal in the 1930s. Both were damaging, as the Great Society dramatically expanded the size and scope of government, contributing to the Great Inflation in the 1970s, and the New Deal contributed to a longer and harsher Great Depression.

Just since January 2021, Congress passed the following major spending bills upon request of the Biden administration

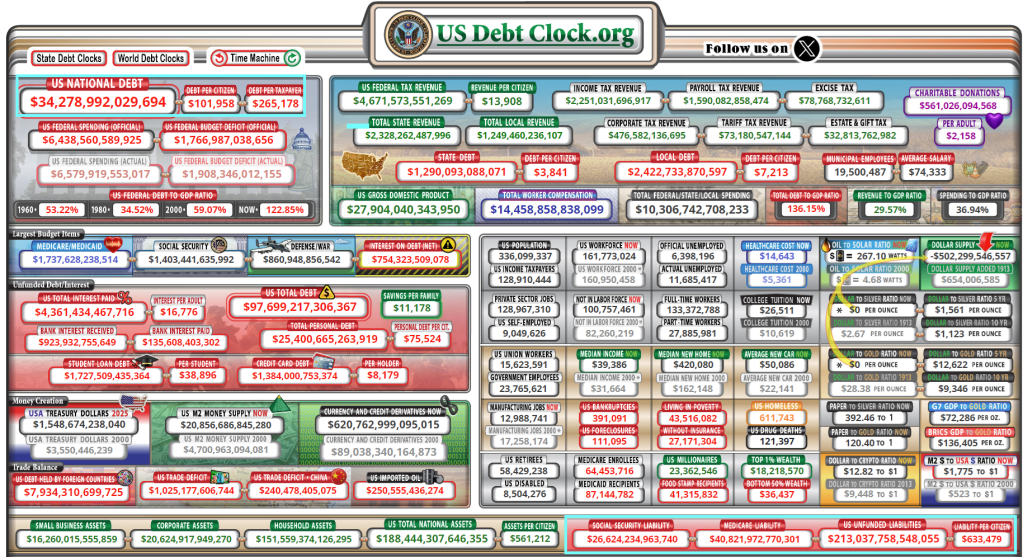
These four bills will add nearly $4.3 trillion to the national debt. But at least another $2.5 trillion will be added to the national debt for student loan forgiveness schemes, SNAP expansions, net interest increases, Ukraine funding, PACT Act, and more. In total over the past three years, excessive spending will lead to more than $7 trillion added to the national debt, which now totals $34 trillion — a 21 percent increase since 2021. There seems to be no end to soaring debt with the recent discussions of more taxpayer money to Ukraine, Israel, the border, and the “bipartisan tax deal,” collectively adding at least another $700 billion to the debt over a decade.

Record debts accrued by households and by the federal government (paid by households) are not signs of a robust economy. This will likely worsen before it improves, as household savings dry up. And with interest rates likely to stay higher for longer because of persistent inflation, debts will crowd out household finances and the federal budget.

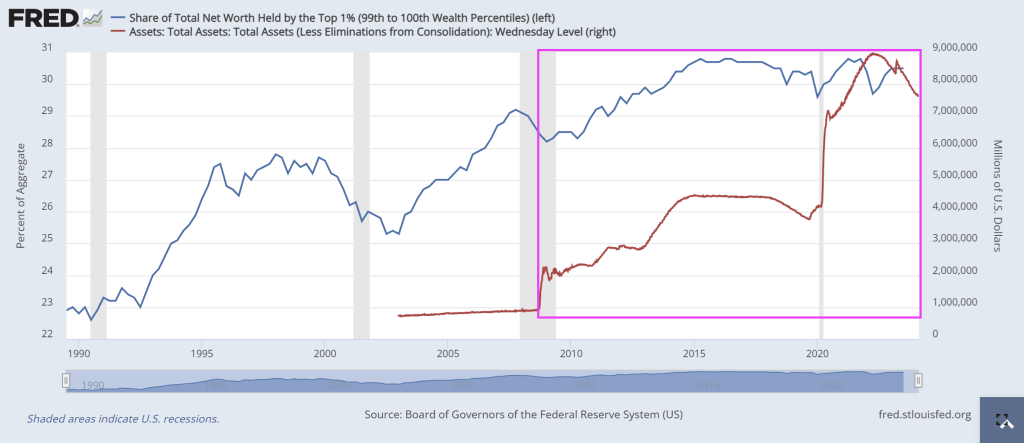
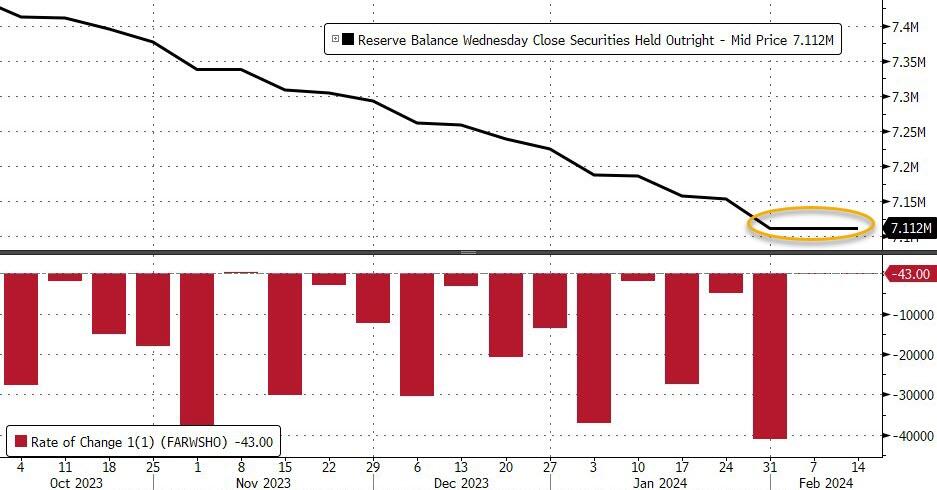
The Federal Reserve has monetized much of this increased national debt over the last few years by ballooning its balance sheet from $4 trillion to $9 trillion and back down to a still-bloated $7.6 trillion. This helps explain persistent inflation, massive misallocation of resources, and costly malinvestments across the economy, keeping the economy afloat yet fragile. 

Excessive deficit spending weighs heavily on future generations, saddling them with unsustainable debt levels they have no voice in. Today, everyone owes about $100,000, and taxpayers owe $165,000, toward the national debt. Of course, these amounts don’t include the hundreds of trillions of dollars in unfunded liabilities for the quickly-going-bankruptwelfare programs of Social Security and Medicare. 

Future generations will be on the hook for even more national debt if Bidenomics continues and Congress doesn’t reduce government spending now. This is why the national debt is the biggest national crisis for America. We’re robbing current and future generations of their hopes and dreams.

Fortunately, there’s a better path forward if politicians have the willpower. This path should be chosen before we reap the major costs of a bigger crisis. Look at Argentina’s president Javier Milei who managed to balance the budget in 60 days and generate a whopping SURPLUS of $589,000,000. How? By cutting massive government waste and closing agencies and programs.

In short, we need a fiscal rule of a spending limit covering the entire budget based on a maximum rate of population growth plus inflation. There should also be a monetary rule that ideally reduces and caps the Fed’s current balance sheet to at least where it was before the lockdowns. My work with Americans for Tax Reform shows that had the federal government used this spending limit over the last 20 years, the debt would have increased by just $700 billion instead of the actual $20.2 trillion. That’s much more manageable and would point us in a more sustainable fiscal and monetary direction

Together, fiscal and monetary rules that rein in government will help reduce the roles that politicians and bureaucrats have in our lives so we can achieve our unique American dreams. If not, we will have wasted many dreams on Bidenomics that can make things look good on the surface, but cause rot underneath.

Clarification: When Biden and various members of Congress tout Biden as having created more jobs that previous Presidents, that is the ultimate gaslighting of the American people. Trump actually saw more job creation than Biden until Covid struck and politicians shut down the economy (and schools closed). Then like magic, after Biden was elected, many jobs returned. Biden and his lackies take credit for the incredible job market, but NEW jobs (rather than simply old jobs returning) had nothing to do with Biden’s Keynesian policies. Rather, Biden’s policies have helped destroy the jobs market.

And yes, the US is under invasion by the United Nations who are helping millions of migrants ILLEGALLY cross the US border, creating horrible stress on the economy and helping keep inflation high. Not to mention soaring crime. Its as if Biden (and his master Obama) are using the Cloward-Piven strategy of overwhelming the economy so it breaks.

All we hear about from Biden and Schumer (and their ilk) is about spending billions MORE on Ukraine and their oligarchs to “protect their borders” while Biden and Mayorkas (Cuba Pete) leave American borders over to invasion.

Yes, Democrats like The Clintons, Obamas and Bidens LOVE the Cloward-Piven strategy. Hey, they are all multi-millionaires and are insulated from all the damage they inflict on the middle class and low wage workers.

And by the way, Donald Trump is NOT an isolationist. He is a Jacksonian Nationalist, much reviled by the globalists in Washington DC and the World Economic Forum.

Sundown For Mortgages? Mortgage Purchase Demand (Applications) Down 6% From Previous Week, Down 13% From Same Week Last Year (Mortgage Rates UP 155% Under Biden)

Is it sundown for the US mortgage market?

Mortgage applications decreased 10.6 percent from one week earlier, according to data from the Mortgage Bankers Association’s (MBA) Weekly Mortgage Applications Survey for the week ending February 16, 2024.

The Market Composite Index, a measure of mortgage loan application volume, decreased 10.6 percent on a seasonally adjusted basis from one week earlier. On an unadjusted basis, the Index decreased 8 percent compared with the previous week. The seasonally adjusted Purchase Index decreased 10 percent from one week earlier. The unadjusted Purchase Index decreased 6 percent compared with the previous week and was 13 percent lower than the same week one year ago.

The Refinance Index decreased 11 percent from the previous week and was 0.1 percent higher than the same week one year ago. 

One reason why mortgage demand is so low is that mortgage rates are up 155% under Biden.

Is it sundown for the US mortgage market? And when will it improve?? Probably won’t improve in New York City after Judge Engmoron’s idiotic fine of Donald Trump and family for non-crimes.

Newsom’s Fiscal Inferno! California’s Budget Crisis Worse Than Newsom Projected (State Watchdog Warns Deficit Could Reach Record $73B!)

Newsom’s Fiscal Inferno!

When Arnold Schwarzenegger was Governor California, his budget chief, a former high school pal of mine, called me to look at California’s budget. He sent me his spreadsheets with forecasts and asked me what I thought. Even back then, I called back and said “California is on an unsustainable fiscal path and seems to be committing suicide.” He agreed, but noted that Schwarzenegger would not like that conclusion. I told him to blame me for the report, as an unpaid consultant to The Golden State. But even back then, I could foresee the absolute mess that the California State legislature would make, particularly if they elected a Democrat governor.

Fast forward to today. Another “glamorous” governor (Newsom does have a great smile and great hair), but even a far worse fiscal path. California’s budget deficit could reach a record $73 billion!

California’s budget deficits look a lot like Biden’s (call him Newsom’s elderly intellectual grandpa) budget deficits where Biden and Congress went on a spending spree from “the honey pot” (US Treasury) and borrowed funds.

California’s budget crisis is projected to expand more than previously thought and could hit a record deficit of $73 billion, according to a new report from the state’s nonpartisan Legislative Analyst’s Office (LAO).Her

The LAO laid out the grim forecast in a Tuesday report that cautions that a $24 billion “erosion in revenues” corresponds to a $15 billion increase in the state’s budget problem. Due to this, the budget deficit, which last month was estimated to hit $58 billion, could now go as high as $73 billion.

“The actual increase in the state’s budget problem will depend on a number of factors, including formula-driven spending changes, most notably Proposition 98 spending requirements for schools and community colleges,” the report said.

H.D. Palmer, the deputy director of the California Department of Finance and Newom’s spokesperson on budget matters, responded to the new LAO report by telling Fox News Digital that their budget shortfall differs from the $38 million they estimate.

“From now through April, more than $51 billion in income and corporate tax receipts are forecast to come in,” Palmer said. “No one can say today with certainty how those numbers may change the budget estimate of a $38 billion shortfall.”

“A responsible step would be for the Legislature to act now on the early action budget measures needed for $8 billion in solutions to help close this gap,” he added.

The projected bad news comes as Newsom has worked to increase his profile nationwide. It also occurred as California experienced a mass exodus.

California saw its first-ever population decline in 2020 when the state imposed rigid lockdowns during the COVID-19 pandemic. From January 2020 to July 2022, the state lost well over half a million people, with the number of residents leaving surpassing those moving in by almost 700,000.

Census data has shown that Texas is the most popular destination for residents fleeing the state, followed by Arizona, Florida, and Washington. (Of course, Arizona where I used to live has flipped from a Red state to a Blue state with immigration and Democrats are working hard to flip Texas to a Blue state. Washington, has already flipped Blue. Florida remains a Red state under Ron DeSantis).

Here is Biden’s budget deficit chart under the hilariously termed “Bidenomics.” Ah, so maybe Governor Newsom is a perfect fit for the wild spenders in Washington DC.

Lest we forget, Biden/Congress can borrow endless funds and stick the bill to Gen Zers and the unborn.

And remember, US politicians have promised $213 TRILLION in unfunded payments that will require cuts (LOL!) or a massive increase in Federal debt.

Biden and Newsom could sing “Fiscal inferno” together! “Here is my demented, doddering grandfather!”

That’s Bidenomics! US Leading Indicators Decline For 22nd Straight Month, Back To March 2006 Levels

That’s Bidenomics for you!

The Conference Board’s Leading Economic Indicators (LEI) continued its decline in January, dropping 0.4% MoM (notably worse than the -0.1% MoM expectations), and December’s 0.1% declin e was revised down to a 0.2% decline.

  • The biggest positive contributor to the leading index was stock prices (again) at +0.10
  • The biggest negative contributor was average workweek at -0.18

This is the 22nd straight MoM decline in the LEI (and 23rd month of 25) –  equaling the longest streak of declines since ‘Lehman’ (22 straight months of declines from June 2007 to April 2008)

“The U.S. LEI fell further in January, as weekly hours worked in manufacturing continued to decline and the yield spread remained negative,” said Justyna Zabinska-La Monica, Senior Manager, Business Cycle Indicators, at The Conference Board.

“While the declining LEI continues to signal headwinds to economic activity, for the first time in the past two years, six out of its ten components were positive contributors over the past six-month period (ending in January 2024).

As a result, the leading index currently does not signal recession ahead.

While no longer forecasting a recession in 2024, we do expect real GDP growth to slow to near zero percent over Q2 and Q3.”

While the Conference Board seems optimistic, we are struggling to see any signs of hope! tumbling back below the peak in March 2006…

And on a year-over-year basis, the LEI is down 7.0% (down YoY for 19 straight months) – still close to its biggest YoY drop since 2008 (Lehman) outside of the COVID lockdown-enforced collapse (but starting to inflect)…

The annual growth rate of the LEI remains deeply negative and decoupled from Real GDP…..

Finally, the massive easing of financial conditions in the last few months suggests a turn in LEI is imminent…

And hence the ‘soft landing’ mission is accomplished… so no need for rate-cuts? (Except for the banking crisis that looms in March).

Here is the roadmap for Bidenomics.

The Sisyphus Economy! Top 1% Of Earners Gaining Wealth Relative To Middle Class Thanks To The Federal Reserve And Federal Government Policies (Top 1% Have More Wealth Than The Middle Class)

According to mythology, Hades made King Sisyphus roll a huge boulder endlessly up a steep hill in Tartarus. Unfortunately, the modern day version of Sisyphus is the middle class pushing a boulder endlessly up a steep hill while the top 1% (the elite class) horde more and more wealth.

An example of the Sisyphus economy? The top 1% of earners (blue line) have seen an incredible increase in net worth, particularly after Fed Chair Alan Greenspan’s big rate cuts (green line) from 2000 to 2004. Each subsequent rate cuts under Bernanke (2007-2008) and Yellen (who just kept rates too low for too long). The end result? In the red box, the top 1% made out like bandits.

The end result? The top 1% of earners now have more wealth the the middle class.

Of course, asinine Federal government policies (like open borders and making donors wealthy with green energy spending) and the lack of a serious approach to corruption have complicated matters.

So the working class, middle class and low wage workers, are the ones pushing the boulder up a hill while government insiders like Biden make millions through influence peddling. So, unlike the Sisyphus legend, the middle class and low wage workers are being punished by simply existing.

The Fed’s balance sheet has had a similar effect, particularly since the financial crisis of 2007-2008 when The Fed truly became unhinged under Janet Yellen. So of course, Yellen was made Secretary of Treasury, the largest honey pot in the world, so she could continue growing the elites power while minimizing the wealth of all others.

Should we end The Fed? Of course! But we can’t even have a rational discussion on why we are funding a war in Ukraine (to protect their border?) while we leave our borders open to invasion?

Here is one of the 1% who made a fortune by simply having a big mouth and being in politics.

White House Plans Downshift In Electric Vehicle Transition As Demand Slides (A Tesla 4-module Battery Pack Costs $20,000 To $28,000 BEFORE Labor!)

Burn on, Bidenomics!

The Biden administration is reportedly considering easing tailpipe emissions regulations, a move that was designed to force Americans from gas and diesel-powered vehicles to electric vehicles, according to The New York Times, citing three people familiar with the plan. This potential policy adjustment is in response to concerns from major automakers and labor unions and comes amid sliding EV demand, recently prompting companies such as Ford Motor Company to reduce EV production and lay off workers. 

“Instead of essentially requiring automakers to rapidly ramp up sales of electric vehicles over the next few years, the administration would give car manufacturers more time, with a sharp increase in sales not required until after 2030,” the people said.

This policy change comes after 3,900 auto dealers penned a letter to President Biden at the end of 2023, warning the president to reconsider the pace of EV mandates, citing a severe decline in demand for these vehicles. 

“Currently, there are many excellent battery electric vehicles available for consumers to purchase. These vehicles are ideal for many people, and we believe their appeal will grow over time. The reality, however, is that electric vehicle demand today is not keeping up with the large influx of BEVs arriving at our dealerships prompted by the current regulations. BEVs are stacking up on our lots,” the dealers said. 

They warned: “Already, electric vehicles are stacking up on our lots which is our best indicator of customer demand in the marketplace.” 

Last month, Ford Motor’s electric vehicle sales ran out of juice as the automaker was forced to slash production of its all-electric F-150 Lightning to April “to achieve the optimal balance of production, sales growth and profitability.” 

A recent note by RBC analyst Tom Narayan said the EV slowdown is far from over:

“Key takeaways thus far from earnings season are that the EV slowdown is not showing any evidence of an inflection, Level 4 autonomy headwinds continue to persist, and fears over supplier inventory overbuild are likely overblown.”

Analyst Adam Jonas at Morgan Stanley suggested consolidation is coming to the industry:

The EV bubble is no match for elevated interest rates, and no fiscally conservative American is trying to survive the era of failed Bidenomics with a +$1,000 EV car payment. 

Plus, Toyota’s chairman and former CEO, Akio Toyoda, will likely be proven right: EV cars will never dominate the global market, adding hybrids are the future

If the alleged climate crisis is as urgent as portrayed by radicals in the White House and woke corporate media, then why does the Biden administration feel the need to move the transition goalposts if banning gas cars saves the planet? 

Biden would likely sound more sincere if he dumped his gasoline-powered Corvette for a lousy electric car. On a personal note, I own at Volvo XC-60 hybrid and HATE the damn thing!!!

Recession In Mid 2024? Bank Credit And Deposit Growth NEGATIVE After The Stimulus Has Worn Out (EU Ordered To Accept 75 Million More Migrants)

This headline from Zero Hedge makes me so glad I have eaten heart-healthy Quaker Oats and Cheerios every morning for the last 20 years! Study Finds 80% Of Americans Exposed To Fertility-Lowering Chemicals In Cheerios, Quaker Oats. The chemical (chlormequat chloride) was detected in “92 percent of oat-based foods purchased in May 2023, including Quaker Oats and Cheerios.” But that was nothing compared to this Zero Hedge headline: EU “Suicide Pact” Threatens To Flood Continent With 75 Million More Migrants. Makes me wonder if Biden/Mayorkas are under orders from the UN/WEF/Soros to let immigrants pour across our southern border (including 20,000+ Chinese military age males). But back to the economy.

Both bank credit growth year-over-year (YoY) and bank deposit growth (YoY) are NEGATIVE. Covid resulted in massive Federal government stimulus spending (and Federal Reserve hyper stimulus) in 2020, but as the stimulus wears out, so does bank lending and deposits.

Having seen The Fed’s QT appear to stall in February, as Reverse Repo liquidity withdrawal accelerates, all eyes are once again back on the situation on bank’s balance sheets and how deposits are standing up (‘adjusted’ by The Fed’s magical seasonals).

And after the prior week’s miraculous surge in deposits (again, according to The Fed), last week saw total bank deposits (seasonally-adjusted) drop $57BN – the biggest weekly drop since October…

This data is from the week when Regional bank shares shit the bed thanks to NYCB…

Interestingly, on a non-seasonally-adjusted basis, total bank deposits declined about the same as SA -$58BN (and are down $180BN YTD)…

And, excluding foreign banks, domestic deposits dropped $52BN SA (Large Banks -$40BN, Small Banks -$12BN), and tumbled $65BN NSA (Large Banks -$57BN, Small Banks -$$8BN)

As the chart above shows, on an NSA basis, domestic banks have only seen one week of inflows in 2024.

As one might expect, loan volumes shrank during that week by just over $9BN (Large banks -$4.6BN, Small banks -$4.4BN)…

And finally, as a reminder – despite the rebound off the lows again this week in regional bank shares, which must mean everything is awesome, right? – the regional bank crisis is still very much alive as evidenced by the red line below (without The Fed’s imminently expiring BTFP facility)…

…what else are big banks (green line) going to do with all that cash burning a hole in their pockets?

The bottom line is – this looks a lot like a ‘Small Bank’ crisis. The last time this happened, the crisis sparked a sudden $300BN ‘run’ in small bank deposits…

Is The Fed ‘hoping’ for a controlled bank-run this time – so as many small bank deposits are drained voluntarily, before they are drained all at once in a panic (and the Reverse Repo facility is empty, unable to provide any cushion)?

It is looking like a recession in mid-2024 as Covid Stimulypto has run its course. Is the US economy so lame that is requires constant Federal government and Federal Reserve manipulation??

Joe Biden (President of the top 1% of Americans) and his likely replacement “Greasy Gavin” Newsom, wrecker of the California economy. Two economy wreckers on the same stage.

Remember when Democrats were the party of the working man and Republicans (like George HW Bush) were called “Country Club Republicans”? Now Biden and Democrats represent the elitist top 1% of wealth and Trump/Republicans (that Biden snidely calls “Maga Republicans”) represent the bottom 99%. Who woulda thunk??

BTW. Congrats to Iowa’s Caitlin Clark who set the all-time NCAA women’s scoring record with a PERFECT shot.

Climate Interruptus? Financial Giants JPMorgan Chase And State Street Pull Assets From ESG Group (ESG Is A Losing Game!)

ESG (Environmental, social, and corporate governance is a losing game.

Two of the world’s largest financial institutions cut ties Thursday with Climate Action 100+, delivering the latest setback to the world’s biggest coalition of investors pressuring corporations to ditch fossil fuel assets.

The asset management arms of JPMorgan Chase and State Street dropped out of Climate Action 100+, home to more than 700 investment firms totaling $68 trillion in assets under management.

BlackRock, the world’s largest asset manager, with more than $10 trillion in assets, distanced its U.S.-based operations from Climate Action 100+ by transferring its membership to BlackRock International.

The coalition, founded in 2017, revealed plans last year to hold members more accountable by encouraging them to disclose more details about their investment decisions. Some high-profile members raised legal concerns about maintaining their fiduciary duties.

State Street said the changes jeopardized the company’s independence. Climate Action 100+ officials say they need the disclosure standards to chart a better course for corporations to reach net-zero emission portfolios by 2050.

“After careful review, State Street Global Advisors has concluded the enhanced Climate Action 100+ Phase 2 requirements for signatories will not be consistent with our independent approach to proxy voting and portfolio company engagement,” State Street spokesman Randall Jensen said. “As a result, we have decided to withdraw from Climate Action 100+.”

JPMorgan suggested that its in-house guidelines for environmental, social and corporate governance, or ESG, investing already exceeded the Climate Action 100+ goals.

Aka, MARXISM.

Ford learned that their ESG Ford F-150 Lightning Electric pick up truck was NOT in demand, so production is being curtailed. Harvard (which should be renamed Harvurd thanks to President Gay’s horrible record of plagiarism) and Biden’s leadership team of unqualified but ESG-friendly faces (“Admiral” Rachel Levine, formerly Richard Levine) symbolizes the failure of ESG.

Thunderstruck! Housing Starts Collapse In January As Producer Prices Soar (Back In Red?)

Its as if the US economy is thunderstruck! US housing starts collapsed in January as Producer Prices soared. NOT a good sign for the US economy.

After single-family home starts plunged in December, analysts did not expect much of a bounce back in January as rates remain high and some regions were affected by weather.

Analysts were way off. Housing Starts puked 14.8% MoM in January (vs unchanged exp), but December’s 4.3% MoM decline was revised up to a 3.3% MoM rise. Building Permits also tumbled, down 1.5% MoM (vs +1.3% exp) and well down from the +1.8% MoM in December…

Source: Bloomberg

This pushed the Housing Starts SAAR back near post-COVID lows…

Source: Bloomberg

DO NOT BLAME THE WEATHER! It’s January – we know there are weather issues and that should be more than ‘priced-in’ on a seasonal adjustment basis.

Multi-family permits cratered to their lowest since Oct 2020. Permits for one-family homes edged higher after rising consistently throughout 2023

And multi-family starts were even worse, plunging from 489k SAAR to 314k SAAR – the lowest since May 2020 (when the economy was closed)…

The government’s report showed housing starts fell in all four of the nation’s regions, led by the Midwest and Northeast. The number of single-family homes completed plunged to the lowest level since May 2020.

They built it, but no one came… the inventory of new houses for sale remains elevated and suggests builders may be cautious about beginning new projects.

Don’t expect Permits to be reaccelerating anytime soon as mortgage rates have started to rise once again…

Source: Bloomberg

Which is not good news for CPI either as it suggests there is little rent relief coming soon.

And finally, there is a record gap between what the government tells us about construction employment and actual construction activity…

Makes you wonder, eh? Did builders all suddenly get massively less productive? Or is the BLS just making shit up as usual?

And then we have producer price spiking in January.

After the hotter-than-expected CPI (which has been shrugged off entirely by the stock market), Producer Prices were expected to rebound very modestly MoM but continue to slow on a YoY basis in January. Instead, like CPI, it re-accelerated with headline rising 0.3% MoM (+0.1% MoM exp), which left PPI up 0.9% YoY (down from December but hotter than the +0.6% exp)…

Source: Bloomberg

The picture was even worse under the hood with PPI ex food and energy up 0.5% MoM (vs +0.2% prior and +0.1% exp) and ex-food, energy, and trade up 0.6% MoM (vs +0.1% exp).

This was the biggest ‘beat’ for Core PPI since Jan 2021…

In fact, core PPI reached a new record high (reminder, disinflation does not mean lower prices), now up 17.4% since Biden was elected…

Services PPI soared MoM, and energy continues to be a driver of deflation (but is losing its power)…

Source: Bloomberg

And on a YoY basis, Services PPI is also re-accelerating (+1.47% from +1.14%). Energy continues to be the deflationary driver…

Source: Bloomuberg

This is not good news for the disinflationistas. And it will stop President Biden’s narrative that ‘prices are coming down’…

Looks like the US economy is back in red.

The Empire Strikes Out! NY Empire Manufacturing Survey Declines To -2.4 In February (Treasury Yield Curve Remains Inverted For 420 Straight Days)

The Empire State Manufacturing Survey struck out in February.

The Empire State manufacturing survey was down -2.4 in February.

Note how expectations are always higher than realized figures.

The US Treasury 10Y-2Y yield curve remains inverted, now for 420 straight days.