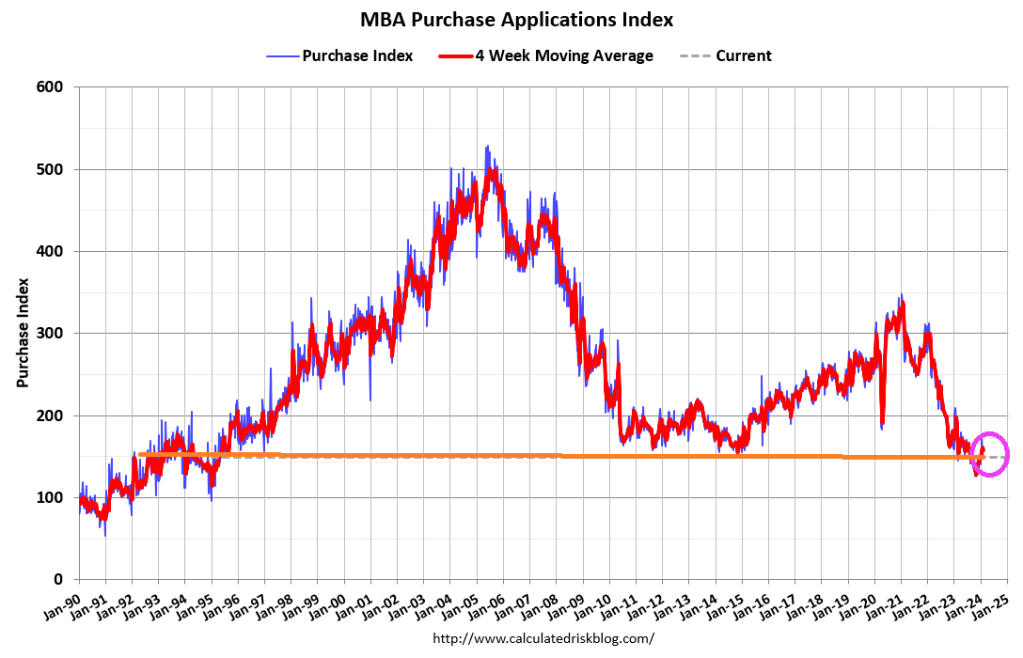
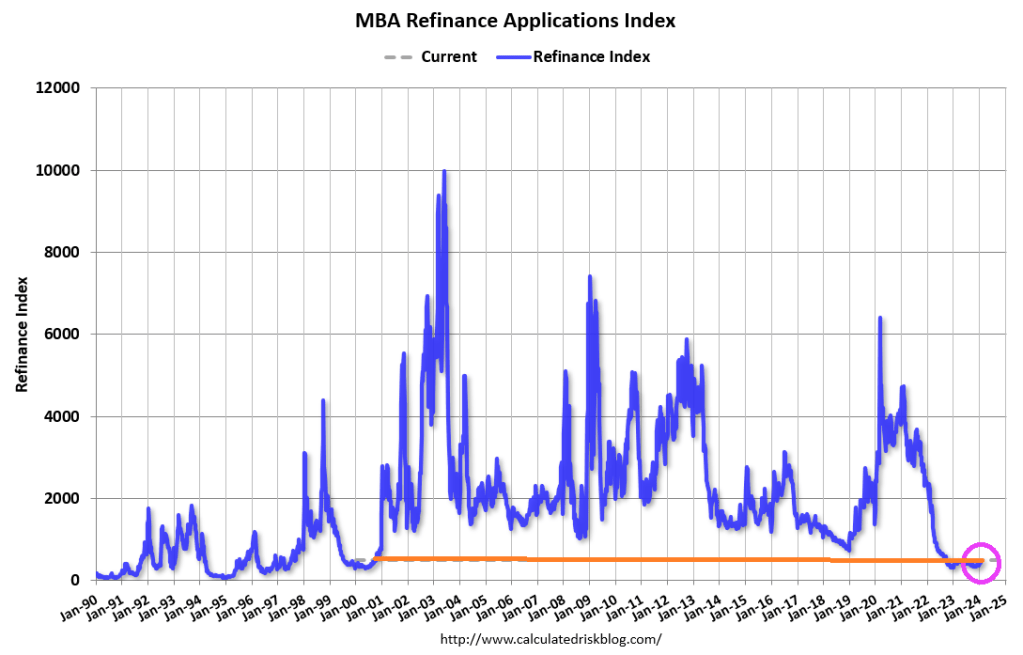
Mortgage applications decreased 2.3 percent from one week earlier, according to data from the Mortgage Bankers Association’s (MBA) Weekly Mortgage Applications Survey for the week ending February 9, 2024.
The Market Composite Index, a measure of mortgage loan application volume, decreased 2.3 percent on a seasonally adjusted basis from one week earlier. On an unadjusted basis, the Index increased 2 percent compared with the previous week. The seasonally adjusted Purchase Index decreased 3 percent from one week earlier. The unadjusted Purchase Index increased 4 percent compared with the previous week and was 12 percent lower than the same week one year ago.
The Refinance Index decreased 2 percent from the previous week and was 12 percent higher than the same week one year ago.
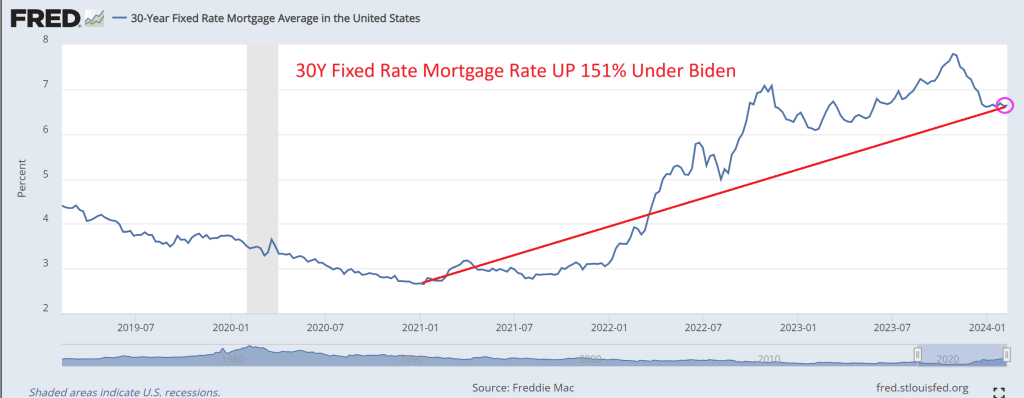
Mortgage rates (30Y fixed) are up 151% under Bidenomics.
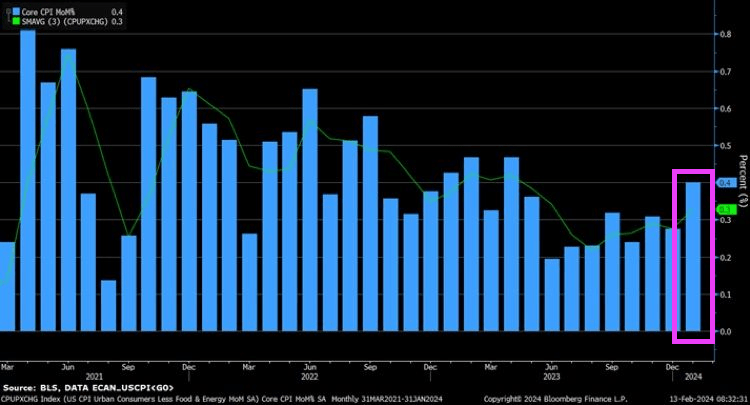
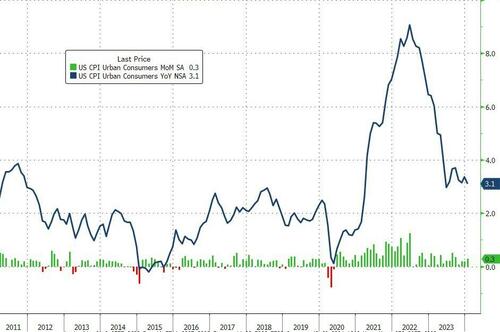
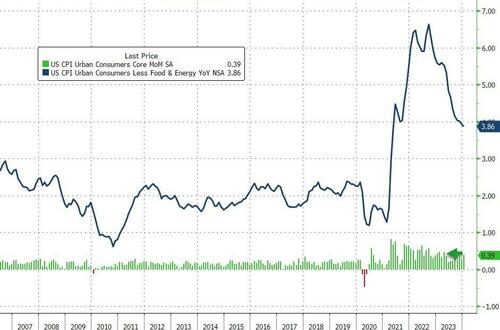
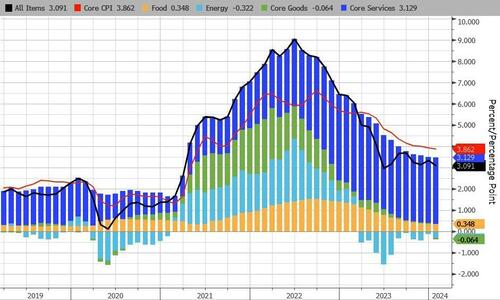
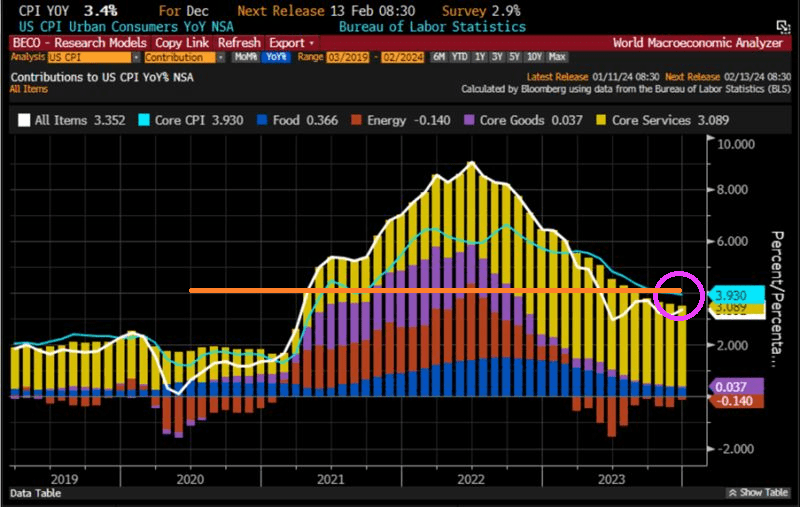
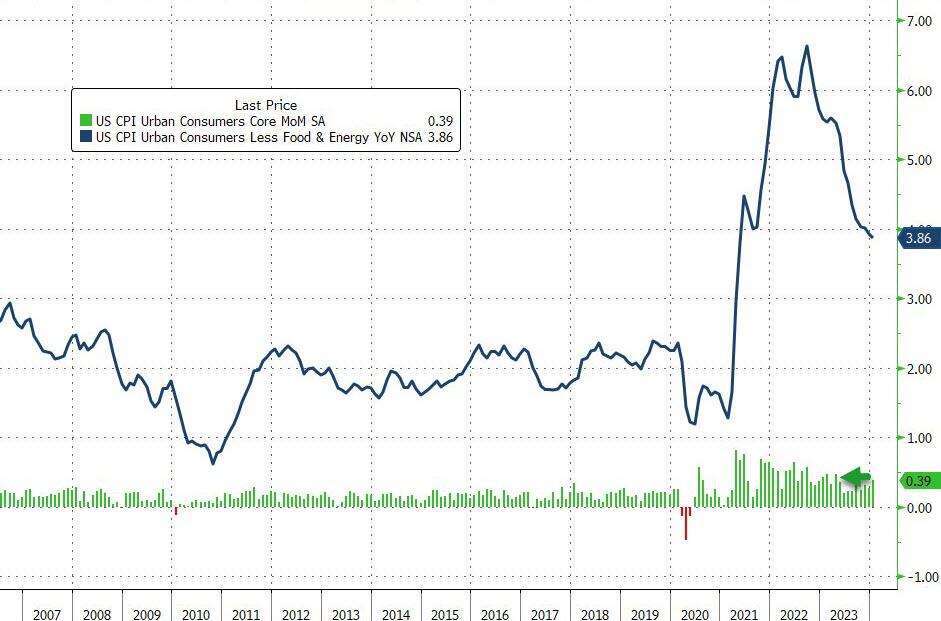
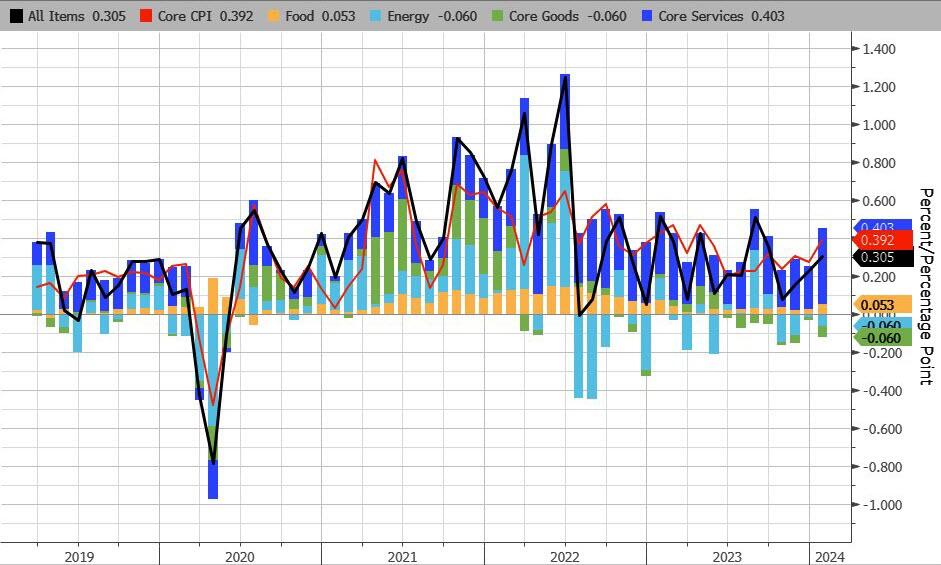
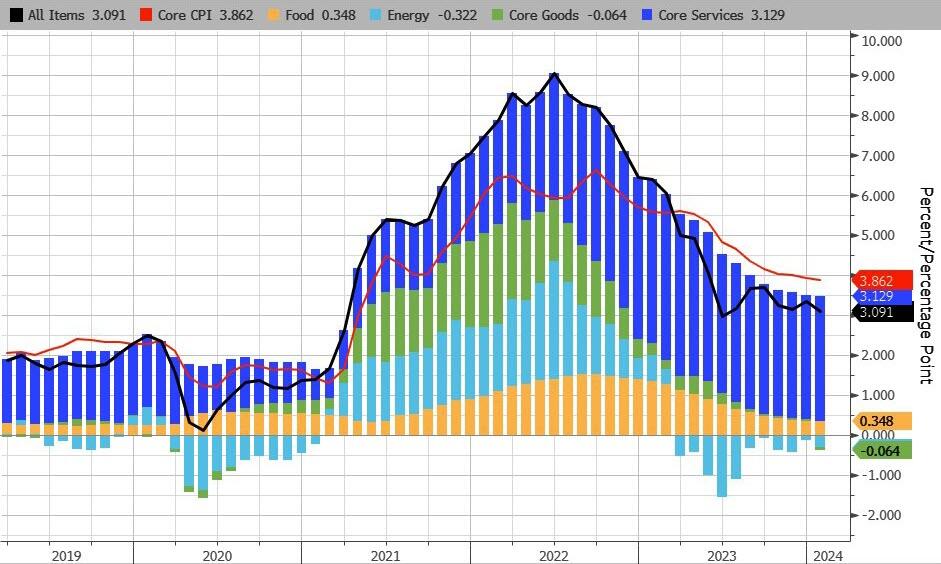
Core CPI fell below 4.00% YoY for the first time since May 2021, but the +3.86% YoY print was hitter than the 3.7% exp (with prices rising 0.4% MoM – the biggest jump since April 2023)…
Source: Bloomberg
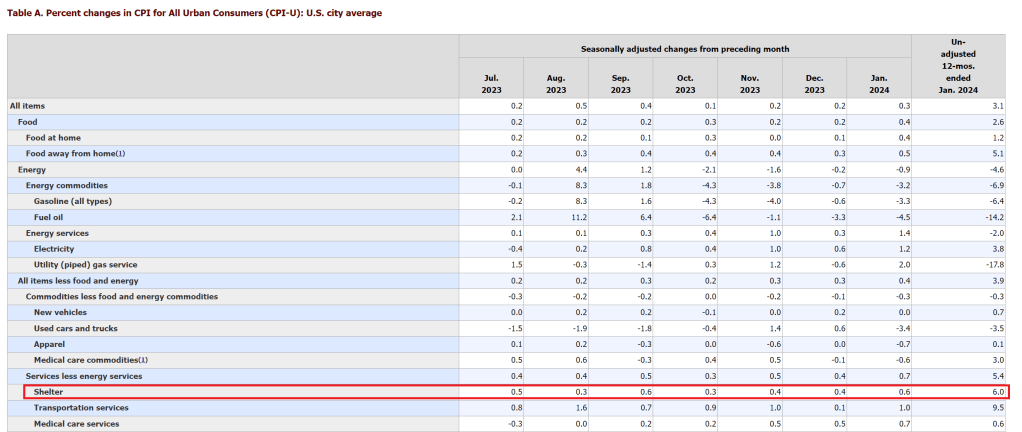
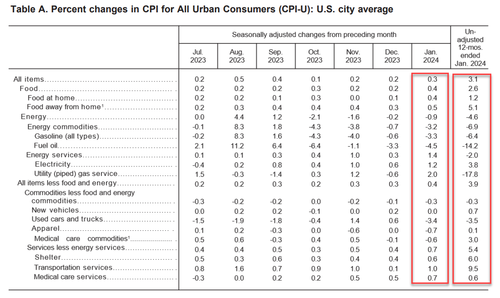
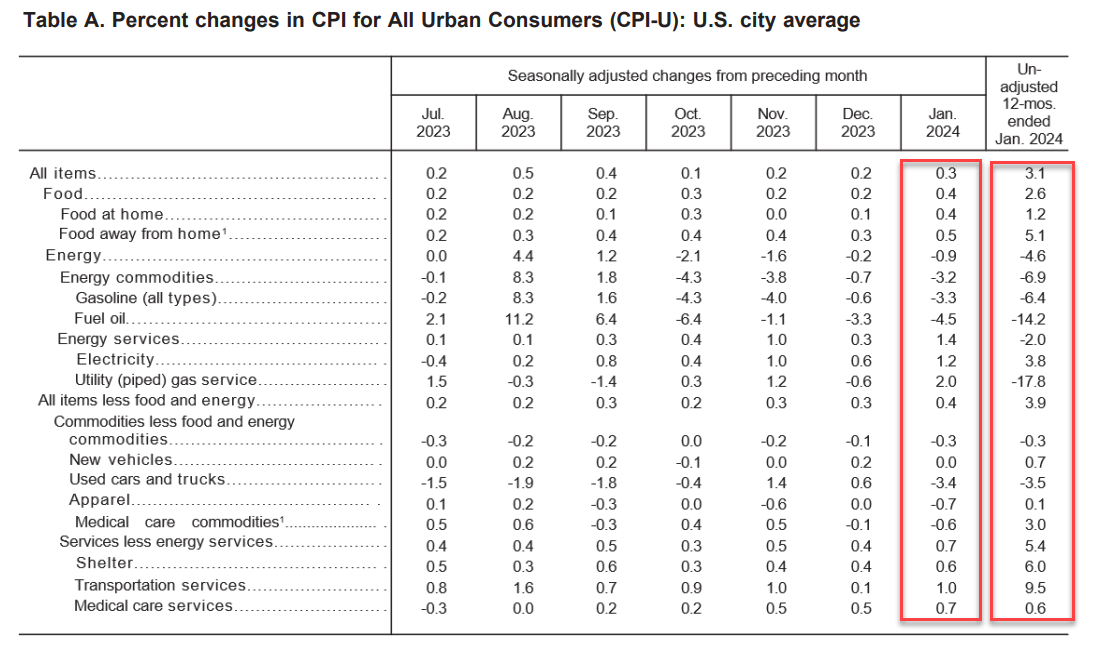
CPI Core: The index for all items less food and energy rose 0.4 percent in January.
The shelter index increased 0.6 percent in January, and was the largest factor in the monthly increase in the index for all items less food and energy.
The index for owners’ equivalent rent rose 0.6 percent over the month, while the index for rent increased 0.4 percent.
The lodging away from home index increased 1.8 percent in January. The motor vehicle insurance index increased 1.4 percent in January, and the recreation index rose 0.5 percent in January.
Among other indexes that rose in January were communication, personal care, airline fares, and education.
The medical care index rose 0.5 percent in January.
The index for hospital services increased 1.6 percent over the month and the index for physicians’ services increased 0.6 percent.
The prescription drugs index fell 0.8 percent in January.
The index for used cars and trucks fell 3.4 percent in January.
The index for new vehicles was unchanged in January.
The apparel index also decreased, falling 0.7 percent over the month.
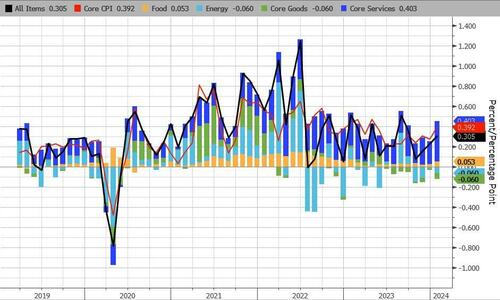
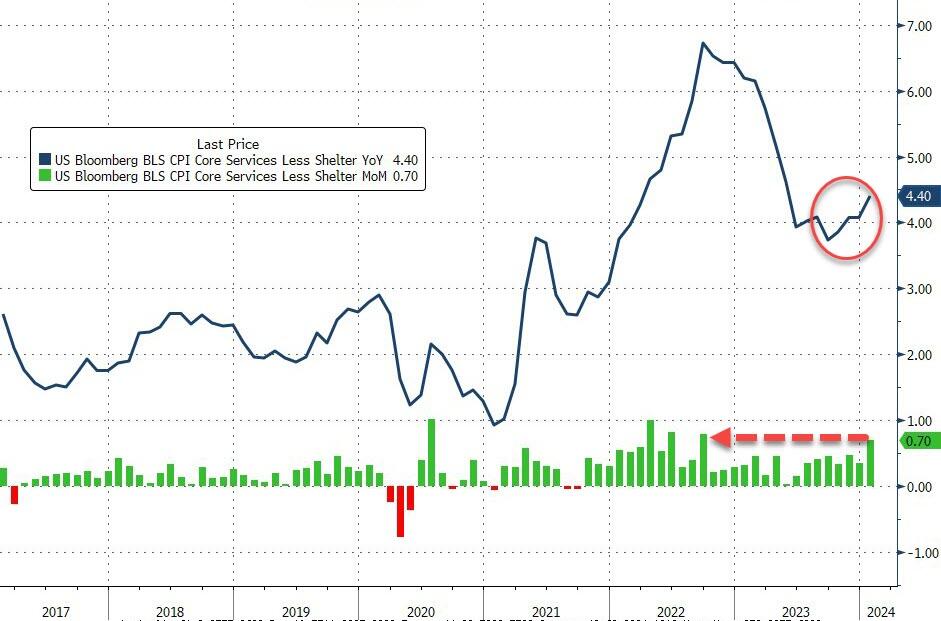
Core Service inflation picked up MoM…
..and accelerated YoY
Source: Bloomberg
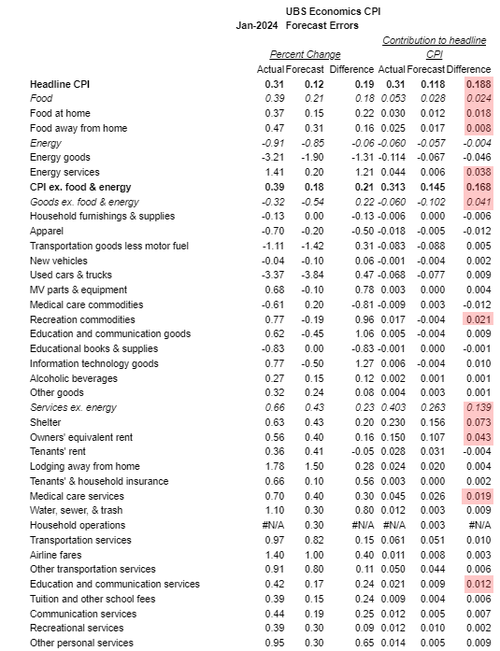
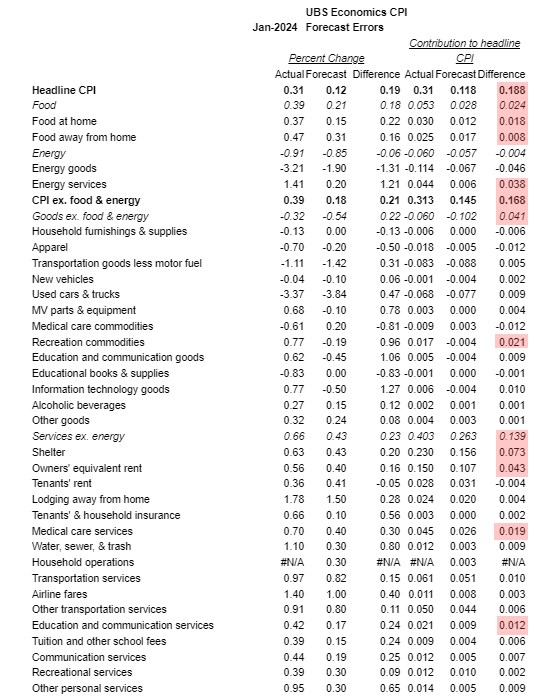
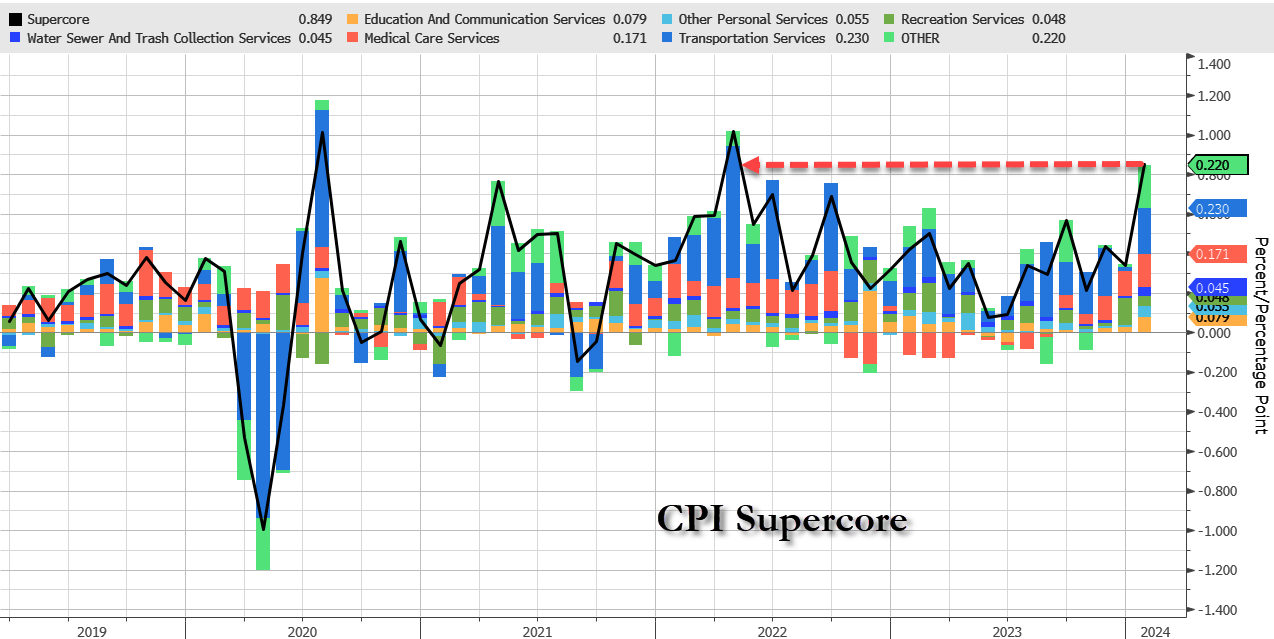
Under the hood, food and Energy services costs jumped MoM along with transportation services…
Here’s the biggest component upside surprises…
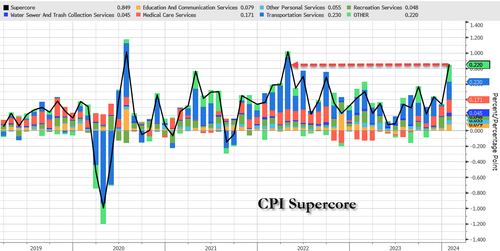
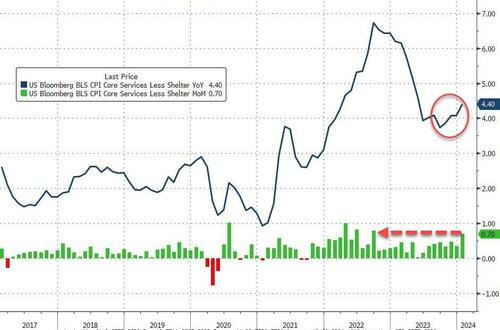
And one step deeper – the so-called SuperCore: Core CPI Services Ex-Shelter index – soared 0.7% MoM (the biggest jump since Sept 2022…
… driving the YoY change up to +4.4% – the hottest since May 2023….
Source: Bloomberg
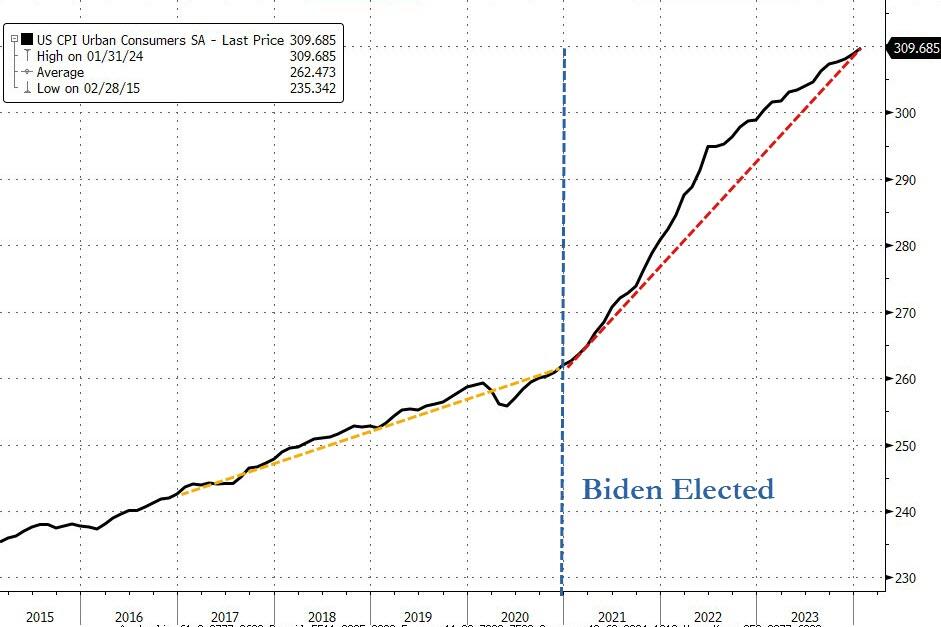
Finally, as a reminder, lower inflation does not mean lower prices.
Source: Bloomberg
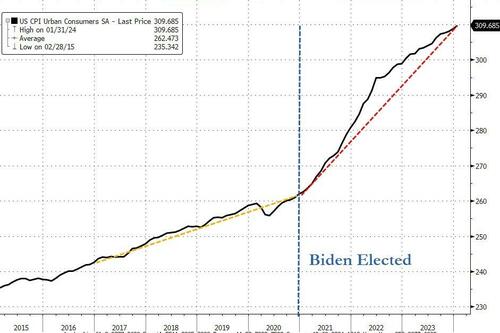
The actual index of consumer prices hit a new record high this month – and is up over 18% since President Biden’s term began(it was up 8% over President Trump’s full four year term).
And it gets worse…
Source: Bloomberg
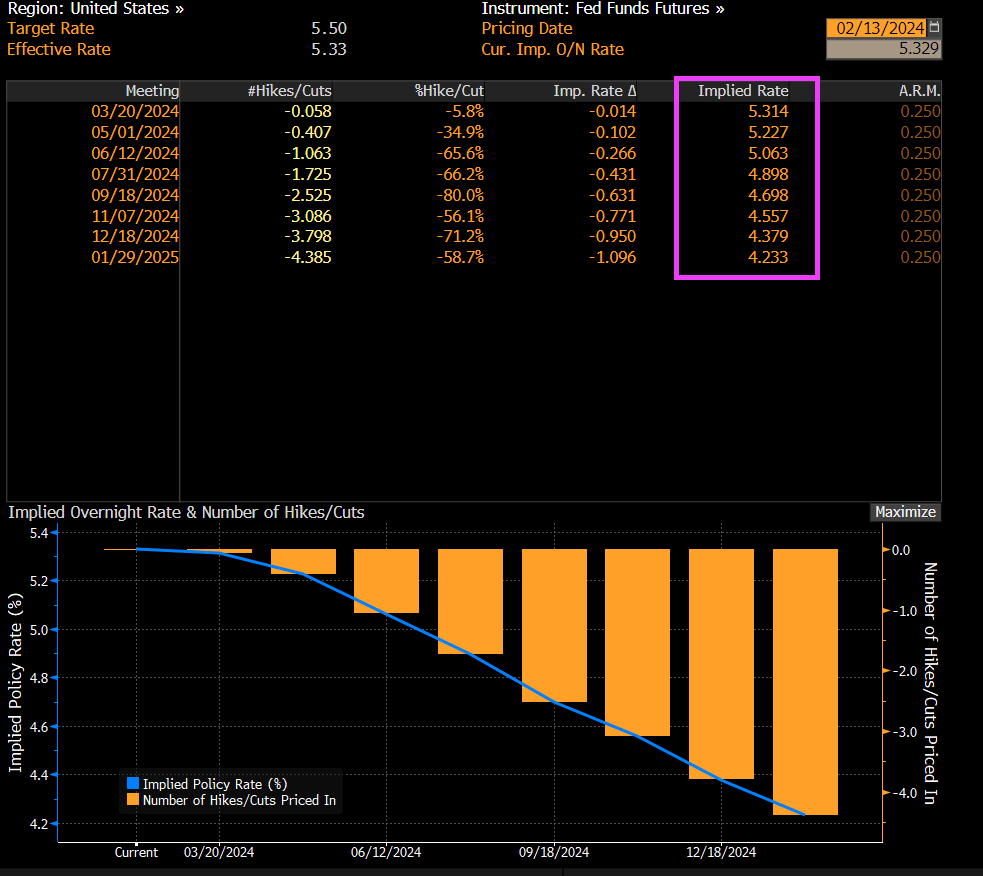
And on the higher than expected inflation report, we are still seeing bets on Fed Funds rate falling from 5.50% to 4.233% over the coming year.
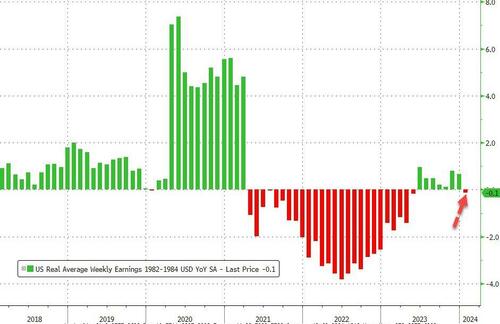
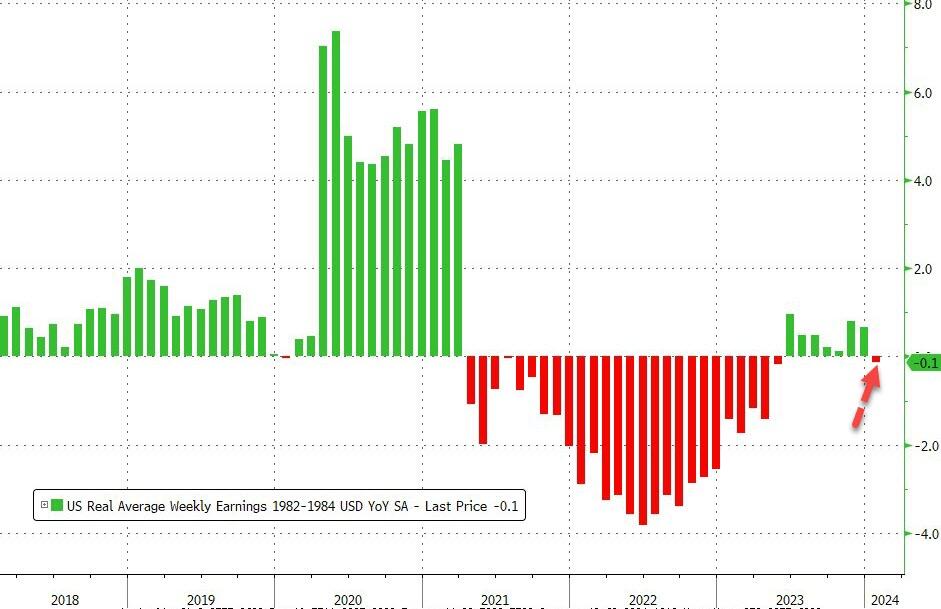
The re-accleration of inflation means wage growth is back in the red relative to prices.
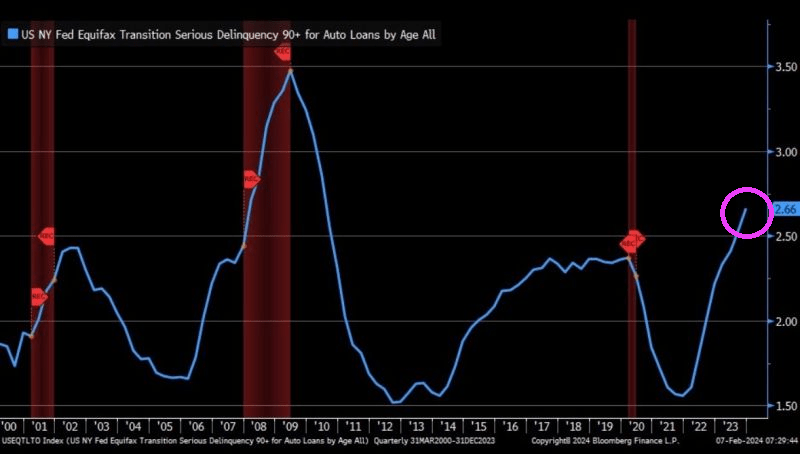
And with the God awful jobs report, serious delinquencies on auto loans is SOARING. To the highest rate since The Great Recession.
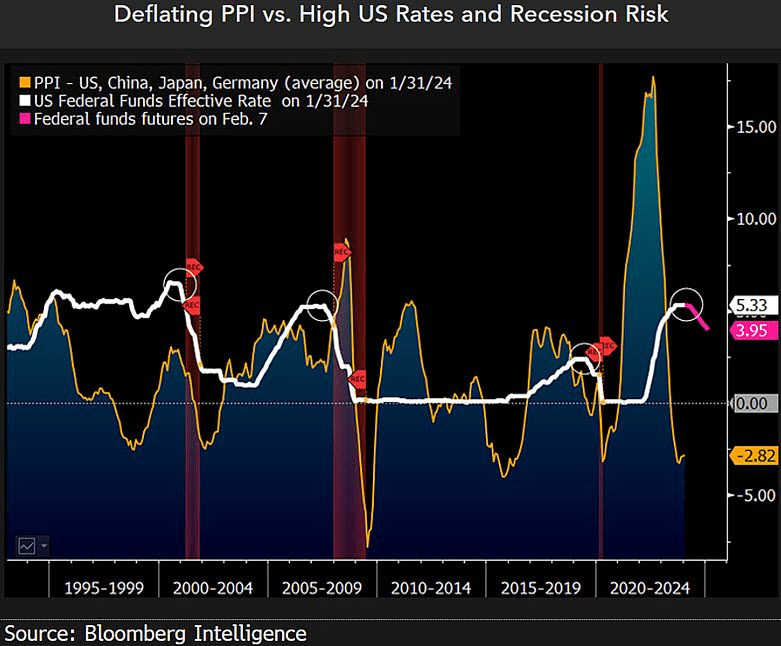
The Producers Price Index is deflating.
At least inflation is cooling down, but still higher than under he that can’t be mentioned on The View, Rachel Maddow or Morning Joe, Donald Trump, the Left’s Voldemort.
I admit, Travis Kelce should have been benched for shoving Head Coach Andy Reid during The Super Bowl. “Damn it, Taylor (Swift) flew here from Tokyo to watch me play and you aren’t throwing enough to me!” Welcome Travis Kelce to the elitist 1% who think the rules don’t apply to them. And your 2.0 GPA at University of Cincinnati certainly qualifies you to opine on the economy … on The View or MSNBC.
“That doesn’t tend to happen in economies, except in very negative circumstances. What you will see, though, is inflation coming down,” explained the Fed Chairman, the average American neither understanding nor caring about the nuance.
Bitcoin raced upward, its market cap roughly half of Nvidia. The market now values this remarkable maker of the semiconductor chips necessary to create an artificial life form at roughly twice the value of the most secure network in human history.
Fidelity added Bitcoin to a model portfolio, spurring investors to consider what happens to the price of a digital asset, whose supply is fixed at 21mm for all eternity, once passive investment products start really stacking Satoshis.
You see, the supply of everything in the universe expands as its price increases, but no matter how high the price of Bitcoin goes, its pre-defined pace of production will only ever decrease.
Nvidia (or any other stock) can be created at the click of a new issuance, or an executive equity option grant for that matter. The average investor neither understands this yet, nor cares for the nuance.
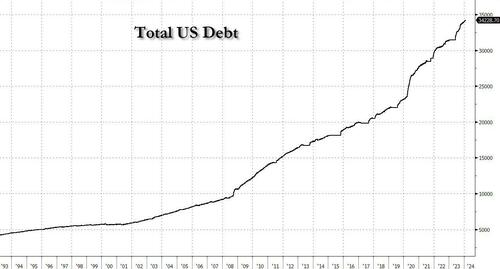
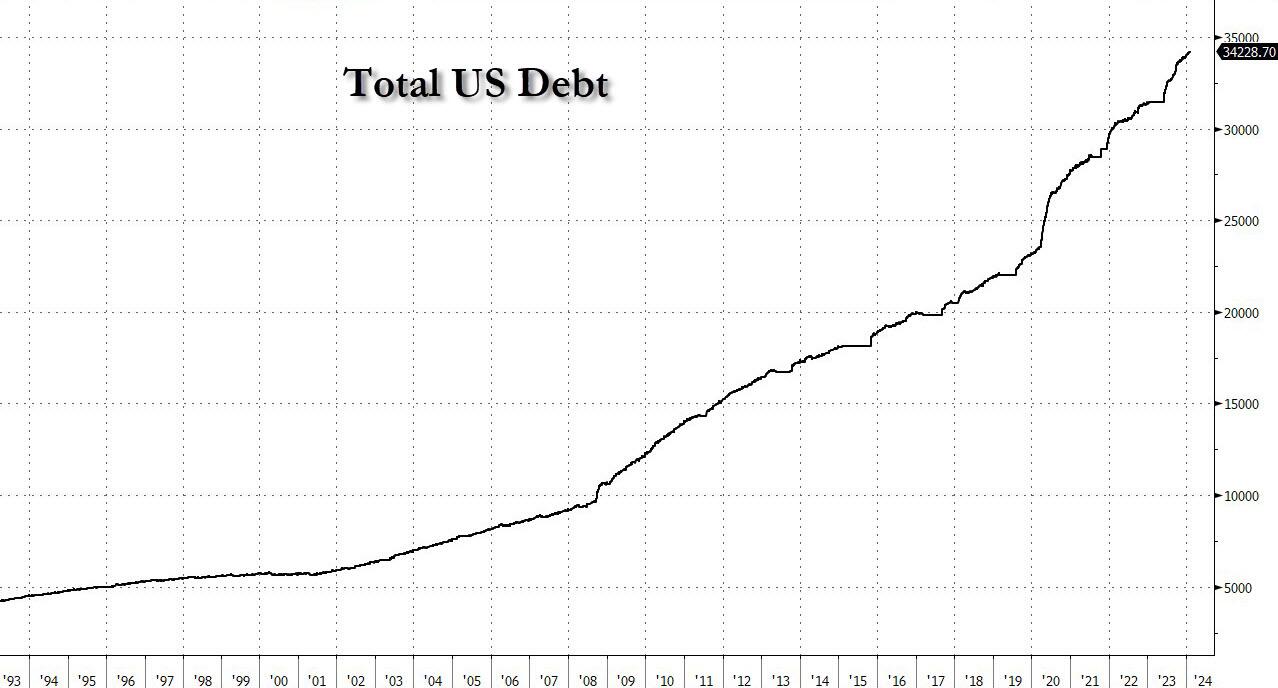
“I would say this. In the long run, the US federal government is on an unsustainable fiscal path,” said Powell, pointing out one of the most important top-down investment themes of the coming decade.
“And that just means that the debt is growing faster than the economy. So, it is unsustainable. I don’t think that’s at all controversial. And I think we know that we have to get back on a sustainable fiscal path. And I think you’re starting to hear now from people in the elected branches who can make that happen,” he added, without naming names, because there really aren’t any.
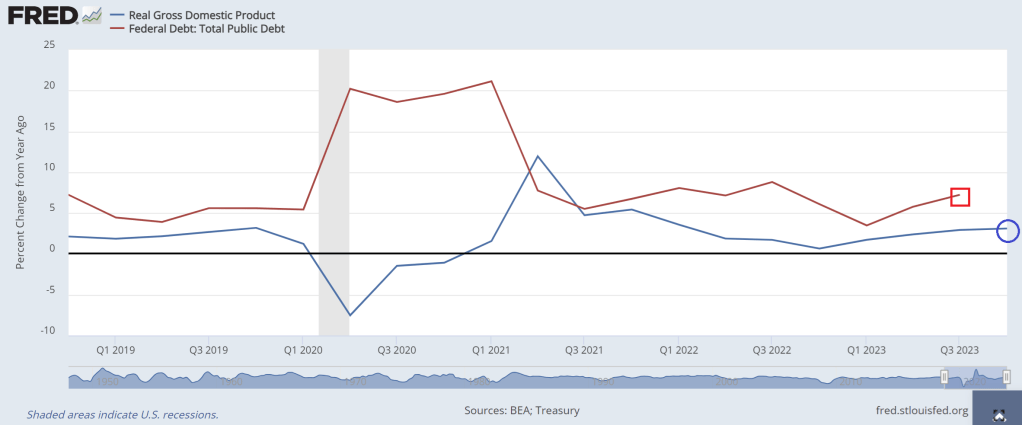
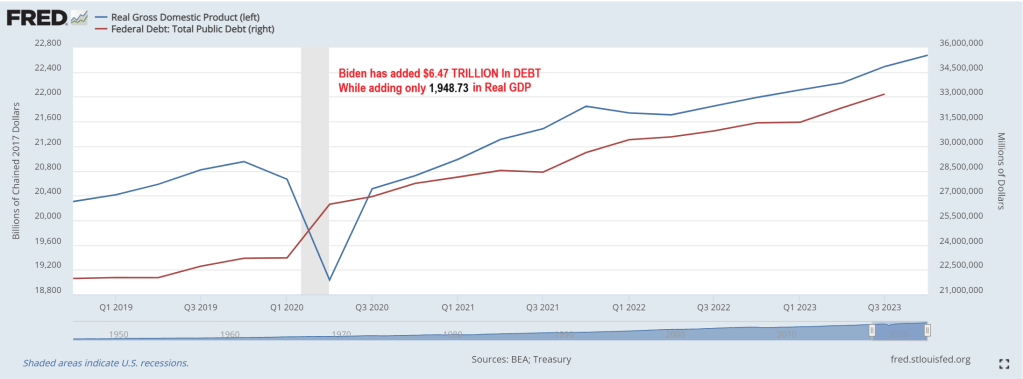
Under Brainless Joe and Dr. Janet Yellen, the US economy has experienced real GDP growth YoY only once (Q1 2021). Otherwise, debt growth YoY has always exceeded real GDP growth under Biden.
I admit I am rooting for the SF 49ers over the Kansas City Swifties. At least we won’t have to listen to Brainless Biden ramble on during the Super Bowl, unless they issue a pre-recorded propaganda piece for half time similar to the John Gill character from Star Trek.
Blank stares matter should be Biden’s new campaign slogan!
I watched Tucker Carlson’s interview with Russian President Vladimir Putin. Putin is an amazing contrast to our 81-year old President with dementia who can barely speak while Putin was articulate. Not at all what Hillary Clinton was raving about (she is still furious about losing to Trump after losing to Obama). One thing that caught my attention was Putin talking about The Fed’s endless printing of money. Well, THAT is how the US grows GDP these days. Borrow and spend with the private sector as an after thought.
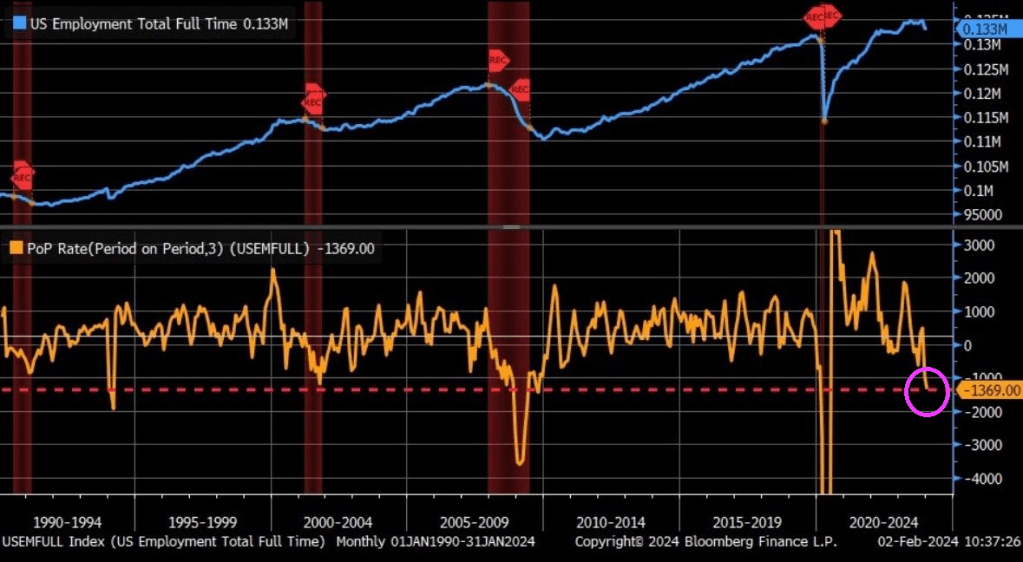
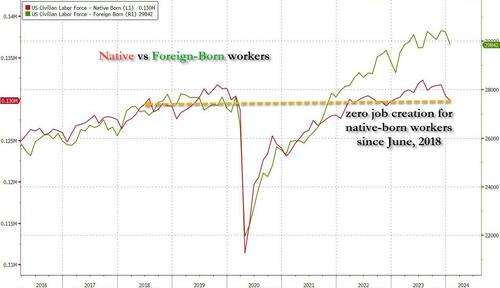
Let’s revisit the HORRIBLE jobs report from December. Not only were all job gains in the past year entirely thanks to part-time workers, but native-born workers plunged by a another whopping 560 thousand, bringing the two-month total drop to just under 2 million.This meant that not only has all job creation in the past 4 years been exclusively for foreign-born workers, but there has been zero job-creation for native-born American workers since July 2018 (don’t believe us? go ahead and check the data directly from the Fed).
So, the Federal government is borrowing trillions of dollars so that 1) part-time jobs are created and 2) foreign born workers have jobs, but not native born Americans?? (Blogger Paul Krugman thinks that immigration will add $7 trillion in real GDP over the next 10 years and this will save Social Security and Medicare. Huh? I admit, millions of immigrants will spend money, but many will be on the Federal and State doles, so its tax dollars going to immigrants to spend.) This seems like Obama/Biden are using Cloward-Piven tactics to overwhelm Social Security, Medicare and other social services, NOT grow the economy as Krugman projects.
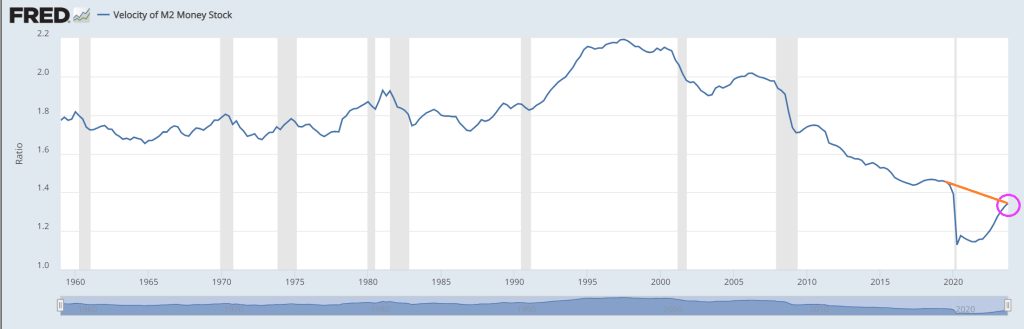
Typically, economists look at measures like M2 Money Velocity (Real GDP/M2). M2 Money Velocity is rising … but still remains below where it was pre-Covid under Donald Trump.
But a more relevant velocity is the velocity of DEBT. As in GDP/Debt. Under Biden, the US has added almost $6.5 TRILLION in debt while real GDP has risen by only $1.949 trillion. That amounts to a DEBT velocity of 0.30. Meaning that the US gets an anemic $30 in real GDP for every $100 in additional Federal debt.
Yes, the US economy is broken and requires endless money printing and debt financing to pay for endless wars and now millions of illegal immigrants getting on “the dole.” Then we have Biden’s forgiving student loan debt (inappropriately) and now Big Tech wants $7 trillion to develop AI (in a normal economy, tech companies would develop AI themselves, but under Obama/Biden, we are not in a normal economy).
Here is Daddy (Ukraine) Warbucks Biden with his biting dog and daughter Ashey.
Remember the Chicago Bears’ “Super Bowl Shuffle”? Well, Joe Biden is thedemented (according to Hur) shuffler so a Super Bowl shuffle video featuring Biden talking about how he is reducing prices.
A week out from kickoff, rooms at five-star hotels like the Bellagio, Aria, and The Venetian started at $1,500 or more per night for Super Bowl weekend, according to Expedia. Travelers seeking an affordable stay on the Las Vegas Strip, such as at Excalibur, can find an average nightly rate of $88 on Priceline for this weekend. That jumps to $486 during Super Bowl weekend, an increase of 426 percent. Prices do dip a bit if Super Bowl fans want to stay away from the Strip’s hotels and casinos. Downtown and hotels away from the main drag do offer some cheaper options, with some hotels charging around $200 per night on Fremont Street. Circa, which contains one of the most popular sportsbooks in Las Vegas, is an exception. Rooms this weekend are going for $179 per night on Priceline. That shoots up to $1,232 per night, with only a few rooms remaining at that price, for Super Bowl weekend.
And then, of course, there are the costs of getting there and subsisting. Intrepid drivers looking to travel from San Francisco to Los Angeles (a trip of between 8 and 9 hours) will do so with gasoline prices at $3.66/gallon. That’s down markedly from the mid-2022 spike, but still vastly above levels before the pandemic. Like hotel and ticket prices, airfare into and out of Las Vegas around the big game has alsovaulted in price, although a number of carriers have increased capacity to meet surging demand.
Celebrating at Home Of course, the vast majority of Super Bowl LVIII viewers will not be in Allegiant Stadium, which holds 65,000 spectators. The remainder of viewers, averaging north of 100 million people, will be watching at home or in their hometown sports bars and restaurants. But the persistent inflation of the past three years extended the financial burden into that seemingly more affordable alternative: hosting or attending Super Bowl parties at home. What was once a casual affair of chips, dips, and budget-friendly beverages has transformed into a costly endeavor, as the price of groceries, alcoholic beverages, and even party supplies have surged, affecting the way fans plan to experience one of America’s most iconic sporting events.
The top Super Bowl snacks and dishes include chicken wings, guacamole, potato skins, and deviled eggs, so a look at the recent price trends in chicken, beef, pork, avocados, eggs, beans, potatoes, eggs and condiments is relevant. Pizza, alcoholic beverages, and soft drinks are other popular choices prices have been creeping up.
Below are the prices of a handful of foodstuffs and ingredients which feature prominently in Super Bowl festivities, as well as the price changes from the pre-pandemic period to the most recent data (December 2019 to December 2023). The prices are provided by the US Bureau of Labor Statistics Average Prices by Product series, not seasonally adjusted:
Dec-19 to
Dec 2019
Dec 2023
Dec-23
Grade A Large Eggs
$1.54
$2.51
63.30%
White Sugar All Sizes
$0.59
$0.96
62.30%
Price Frozen Concentrate OJ
$2.34
$3.72
59.10%
Coffee
$4.05
$6.09
50.30%
White Bread
$1.36
$2.02
48.50%
All Ham Ex Canned and Slices
$3.04
$4.40
45.00%
Chocolate Chip Cookies
$3.58
$5.12
42.80%
Grapefruits
$1.25
$1.78
41.90%
Potato Chips
$4.53
$6.41
41.40%
Long Grain White Rice
$0.71
$0.99
38.70%
All Uncooked Beef Steaks
$7.71
$10.65
38.10%
Sirloin Steak Boneless
$8.48
$11.69
37.80%
All Other Uncooked Beef ExVeal
$5.05
$6.91
36.70%
Round Roast Choice Boneless
$5.07
$6.89
35.80%
Boneless Ham Excluding Canned
$4.07
$5.50
35.10%
Ground Beef 100% Beef
$3.86
$5.21
34.90%
Fresh Whole Chicken
$1.45
$1.96
34.80%
Whole Wheat Bread
$1.96
$2.65
34.80%
Round Steak Boneless
$5.98
$7.99
33.70%
All Uncooked Beef Roasts
$5.54
$7.35
32.70%
All Other Pork Ex Can/Sliced
$2.76
$3.64
31.80%
Boneless Chicken Breast
$3.11
$4.08
31.10%
Chuck Roast Choice Boneless
$5.65
$7.38
30.70%
All Uncooked Ground Beef
$4.30
$5.57
29.40%
Ice Cream
$4.74
$6.02
26.90%
Processed American Cheese
$3.91
$4.96
26.80%
Ground Chuck
$4.07
$5.12
25.90%
Fresh Fortified Whole Milk
$3.19
$4.01
25.70%
All Pork Chops
$3.39
$4.26
25.50%
All Purpose White Flour
$0.43
$0.54
25.40%
Sliced Bacon
$5.47
$6.77
23.70%
Chicken Legs Bone In
$1.51
$1.86
23.30%
Romaine Lettuce
$2.18
$2.68
23.30%
White Potatoes
$0.78
$0.96
23.20%
Malt Beverages
$1.42
$1.75
23.00%
Boneless Beef for Stew
$5.75
$7.03
22.20%
Lean Ground Beef
$5.52
$6.67
20.90%
Navel Orange
$1.33
$1.60
20.60%
Boneless Chops
$3.81
$4.56
19.80%
Iceberg Lettuce
$1.30
$1.53
17.30%
Spaghetti and Macaroni
$1.19
$1.38
15.80%
Dry Pint Fresh Strawberries
$3.10
$3.57
15.40%
Center Cut Bone In Chops
$3.77
$4.33
14.70%
Dried Beans
$1.40
$1.59
13.60%
Red and White Table Wine
$12.04
$13.32
10.60%
Bananas
$0.57
$0.63
9.10%
Natural Cheddar Cheese
$5.30
$5.55
4.60%
Lemon
$2.00
$2.07
3.60%
Field Grown Tomatoes
$1.95
$2.00
2.10%
And although disinflation has proceeded, by their nature the various indices (Consumer Price Index, Personal Consumption Expenditure Price Index) obscure individual price changes. For example: the US CPI Urban Consumers Food-at-Home index, in December 2023, showed a year-over-year change of 1.31 percent (from 299.089 to 303.005). Below are the actual December 2022 to December 2023 changes in individual food items which are prominent in Super Bowl celebrations.
Dec-22 to
Dec 2022
Dec 2023
Dec-23
Price Frozen Concentrate OJ
$2.72
$3.72
36.80%
Sirloin Steak Boneless
$10.17
$11.69
15.00%
White Sugar All Sizes
$0.84
$0.96
13.30%
Round Steak Boneless
$7.06
$7.99
13.20%
All Uncooked Beef Steaks
$9.46
$10.65
12.50%
Round Roast Choice Boneless
$6.22
$6.89
10.70%
Whole Wheat Bread
$2.42
$2.65
9.40%
All Uncooked Beef Roasts
$6.72
$7.35
9.30%
All Ham Ex Canned and Slices
$4.05
$4.40
8.70%
Ground Beef 100% Beef
$4.80
$5.21
8.50%
Ice Cream
$5.56
$6.02
8.20%
White Bread
$1.87
$2.02
8.10%
Navel Orange
$1.49
$1.60
7.80%
Chuck Roast Choice Boneless
$6.86
$7.38
7.60%
Ground Chuck
$4.76
$5.12
7.60%
All Uncooked Ground Beef
$5.19
$5.57
7.30%
Fresh Whole Chicken
$1.83
$1.96
6.80%
Processed American Cheese
$4.66
$4.96
6.30%
All Other Uncooked Beef ExVeal
$6.59
$6.91
4.80%
Lean Ground Beef
$6.39
$6.67
4.50%
All Purpose White Flour
$0.52
$0.54
3.10%
Chocolate Chip Cookies
$4.97
$5.12
2.90%
Boneless Ham Excluding Canned
$5.37
$5.50
2.40%
Boneless Beef for Stew
$6.87
$7.03
2.20%
Potato Chips
$6.28
$6.41
2.00%
Long Grain White Rice
$0.97
$0.99
2.00%
White Potatoes
$0.95
$0.96
1.40%
Malt Beverages
$1.74
$1.75
0.70%
Boneless Chops
$4.56
$4.56
0.00%
All Other Pork Ex Can/Sliced
$3.64
$3.64
0.00%
Bananas
$0.63
$0.63
-0.50%
Lemon
$2.09
$2.07
-0.90%
All Pork Chops
$4.31
$4.26
-1.30%
Red and White Table Wine
$13.66
$13.32
-2.50%
Sliced Bacon
$6.96
$6.77
-2.60%
Spaghetti and Macaroni
$1.43
$1.38
-4.00%
Chicken Legs Bone In
$1.95
$1.86
-4.60%
Fresh Fortified Whole Milk
$4.21
$4.01
-4.80%
Coffee
$6.47
$6.09
-5.80%
Boneless Chicken Breast
$4.35
$4.08
-6.10%
Dried Beans
$1.70
$1.59
-6.40%
Dry Pint Fresh Strawberries
$3.86
$3.57
-7.30%
Center Cut Bone In Chops
$4.67
$4.33
-7.40%
Natural Cheddar Cheese
$6.00
$5.55
-7.50%
Field Grown Tomatoes
$2.23
$2.00
-10.50%
Romaine Lettuce
$3.57
$2.68
-24.80%
Grade A Large Eggs
$4.25
$2.51
-41.00%
Avocado prices, according to the Mexico Products CPI, have risen 27.2 percent from December 2019 (83.80) to December 2023 (106.554). From December 2022 (95.922) to December 2023, they rose 11.1 percent.
Determining the average price of a delivery pizza is more difficult. In local contexts, the price of a slice of pizza can act as an inflationary benchmark of sorts, but estimates indicate that from February 2023 to February 2024 the price of an average delivery pizza has increased from $17.81 to $18.33, or 2.9 percent.
Comparing these numbers with the year-over-year headline and core CPI numbers (3.4 percent and 3.9 percent, respectively), two significant insights emerge. The individual price changes above, over a four- and one-year period, frequently underscore how price indices obscure trends in prices which, at specific times can be considerably graver than the headline figures suggest. Second, that one needn’t be anywhere near Las Vegas to feel the damage of expansionary monetary policies acutely. Well over a year after the lies about Vladimir Putin, gas station owners, ocean shippers, and corporate profits have been told and forgotten, and despite the cynical political impudence of calling a massive green spending bill an “Inflation Reduction Act,” spending Super Bowl Sunday at home in 2024 will be much more expensive than it was in 2023, and vastly more than it was four short years ago.
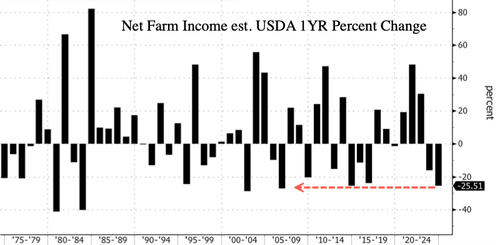
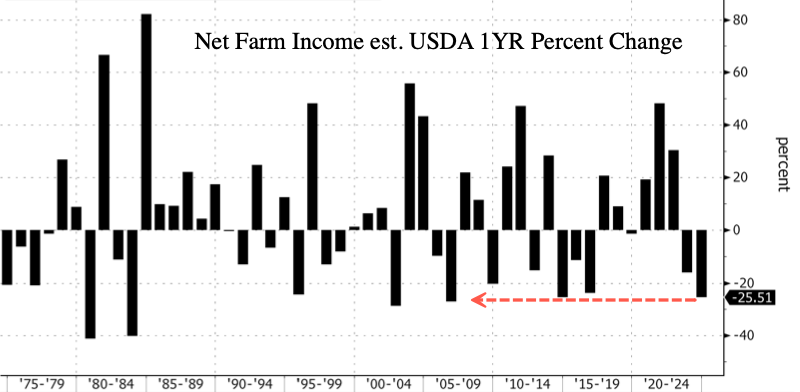
USDA forecasts net farm income, a broad measure of profits, to plunge $39.8 billion, or 25.5%, to $116.1 billion in 2024. This follows a forecasted decrease of $29.7 billion, or 16%, from 2022 to $155.9 billion in 2023.
If the estimate holds, farmers face the largest income drop since 2006 and back-to-back years of financial pain.
“With this expected decline, net farm income in 2024 would be 1.7 percent below its 20-year average (2003–22) of $118.2 billion and 40.9 percent below the record high in 2022 in inflation-adjusted dollars,” USDA wrote in the report.
Simultaneously, farmers are witnessing a rapid decline in their leading role in the global grain market. Decades of corn export dominance were shredded by Brazil last year.
Bidenomics is failing blue-collar workers who put food on America’s table.
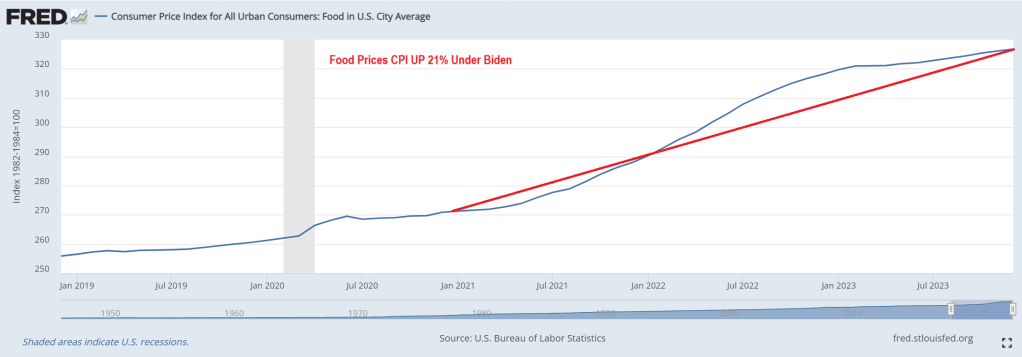
Food prices (CPI) are up 21% under listless, dementia Joe Biden.
I am surprised that Orin from Parks and Recreation hasn’t been appointed to Biden’s cabinet as Secretary of Agriculture.
Like Offenbach’s “Orpheus in the Underworld,” the US economy under Joe Biden is going to hell. Like the tech sector! Thanks to the massive hiring surge related to Covid and Covid spending, now trimming the bloat.
1. Twitch: 35% of workforce 2. Roomba: 31% of workforce 3. Hasbro: 20% of workforce 4. LA Times: 20% of workforce 5. Spotify: 17% of workforce 6. Levi’s: 15% of workforce 7. Xerox: 15% of workforce 8. Qualtrics: 14% of workforce 9. Wayfair: 13% of workforce 10. Duolingo: 10% of workforce 11. Washington Post: 10% of workforce 12: Snap: 10% of workforce 13. eBay: 9% of workforce 14. Business Insider: 8% of workforce 15. Paypal: 7% of workforce 16. Charles Schwab: 6% of workforce 17. Docusign: 6% of workforce 18. UPS: 2% of workforce 19. Blackrock: 3% of workforce 20. Citigroup: 20,000 employees 21. Pixar: 1,300 employees
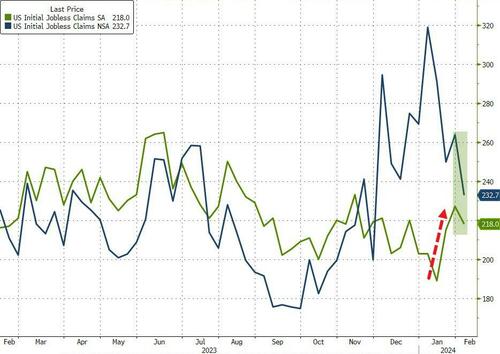
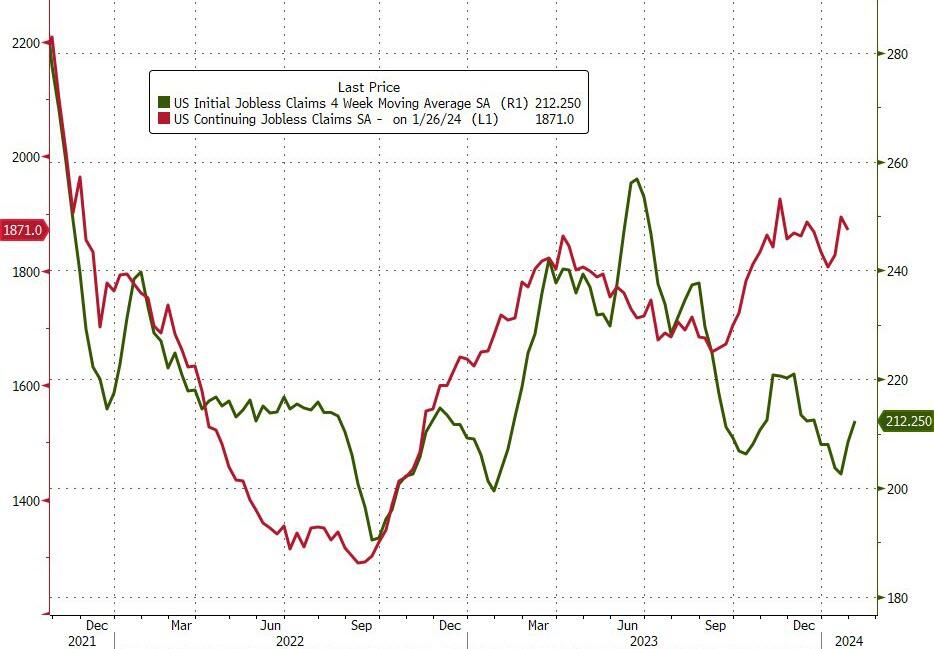
And here’s the government-supplied statistics…
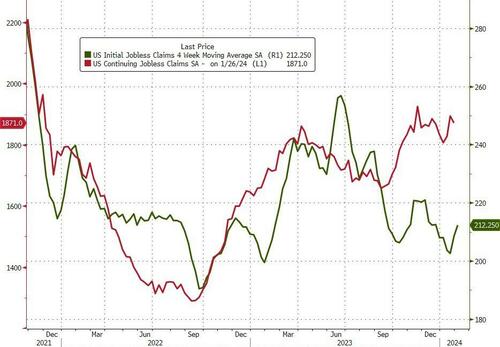
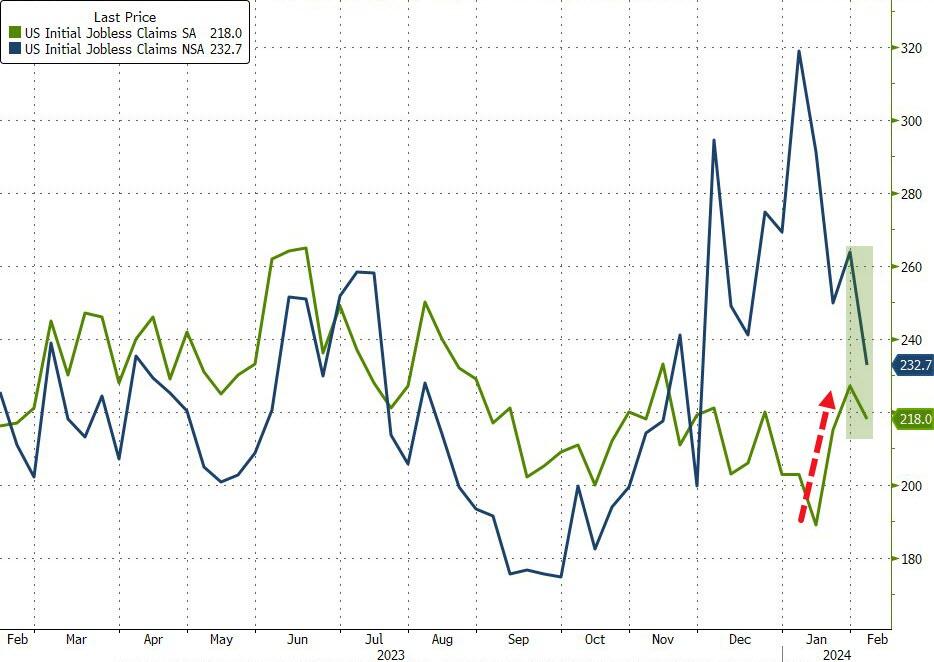
The number of Americans filing for jobless benefits for the first time last week dropped from 227k to 218k (below the 220k exp). On an NSA basis, claims tumbled even more…
Source: Bloomberg
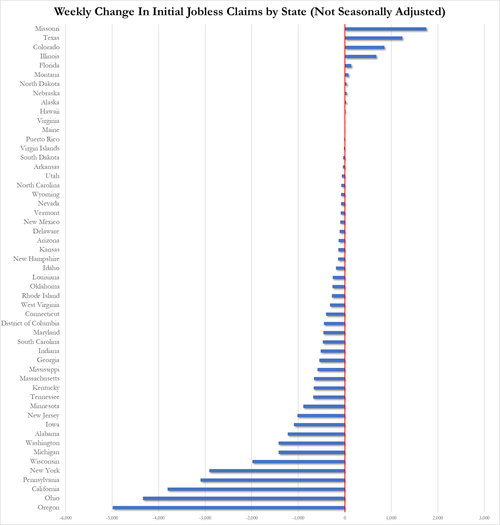
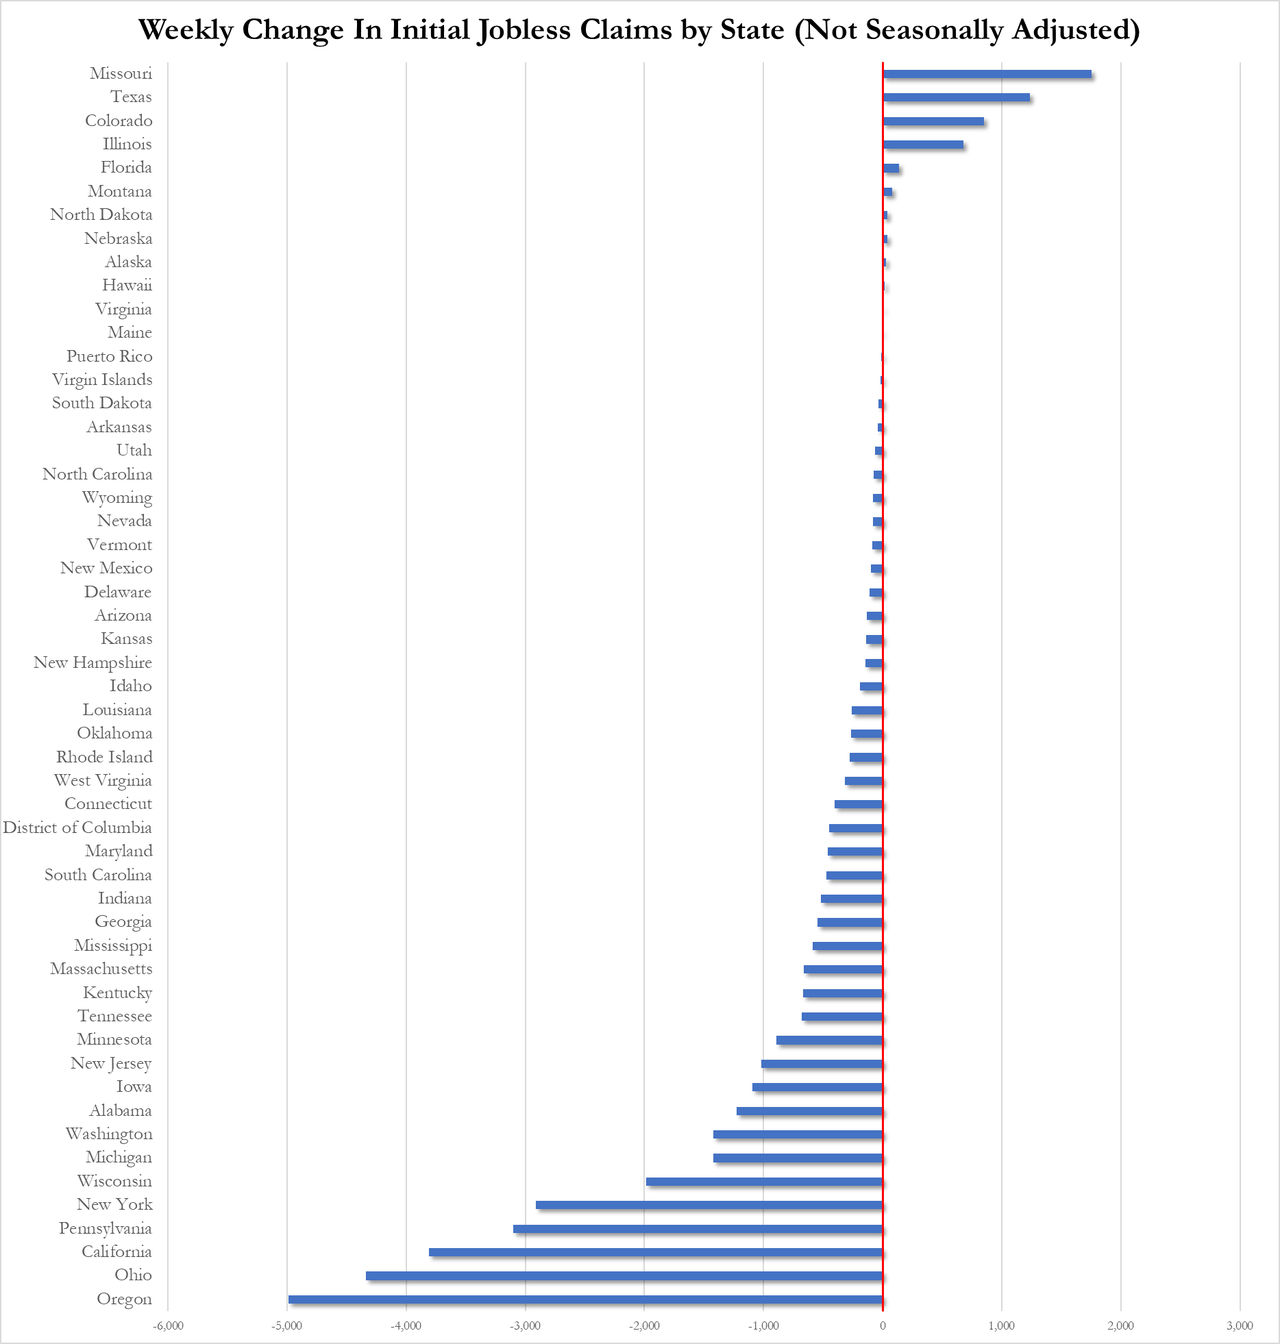
We assume there was some impact in here from the ice storms, but still, Oregon, Ohio, and California saw the biggest declines in claims while Missouri and Texas saw the biggest increase…
Continuing jobless claims also decline (of course, it’s an election year) from 1.894mm to 1.871mm…
Source: Bloomberg
We give the Richmond Fed’s Tom Barkin the last word:
“I am cautious about accuracy of numbers around the turn of the year.”
Cautious is one word…
Not to mention 2024 is an election year, so expect mega nonsense spewing from The White House and the BLS and other government agencies.
With massive job cuts in the real world (unlike the protected, ivory tower of Biden and Congress), the serious delinquency rate on credit cards.
The cumulative number of jobs reported each month was 1,255,000 less than previously thought, with new seasonal and census data affecting total employment estimates, according to data from the BLS calculated by the Daily Caller News Foundation. The huge downward revisions are in spite of a 115,000 upward revision in December, the only month that saw an upward revision to the employment level in 2023.
The biggest revision was for March, which was revised down by a total of 266,000 jobs, followed by January at 234,000 and April at 205,000, according to the BLS. The lowest downward revision was in November, with only 2,000, followed by 11,000 in October.
“Revisions are a normal part of the reporting process, but large changes, or adjustments that consistently move in the same direction, are not normal,” E.J. Antoni, a research fellow at the Heritage Foundation’s Grover M. Hermann Center for the Federal Budget, told the Daily Caller News Foundation. “Instead, they’re indicative of something problematic with the BLS’ methodology. That can happen when market conditions change drastically enough to be outside of the assumptions used in their models.”
The revisions are due in part to an overestimate of the number of jobs in the U.S. economy in January 2023 at 155,007,000 instead of the revised 154,773,000, according to the BLS. The job level increased to a revised 157,347,000 by December, totaling an increase of 2,340,000 positions in the year.
The most recent jobs report in February also released an adjustment to the total jobs level, lowering March by 266,000 positions, according to the BLS. The jobs totals were also adjusted to recent census data, throwing off past estimates.
Recent years have not seen the same high downward revisions as 2023, with 2022 only seeing negative revisions in five months, equating to a downward revision of 66,000 for the year. March was the only month that was revised down in 2021, with the total number for the year being revised up by nearly 2 million as the country recovered from the COVID-19 pandemic.
Growth in government positions has bolstered recent job numbers, adding a total of 601,000 jobs to the U.S. economy in the past 12 months. The gains have led to an all-time record for government positions at 23,091,000, outdoing a surge in hiring from the 2010 census collections.
“When the economy was rapidly deteriorating at the onset of the Great Recession, the BLS repeatedly and consistently overestimated job levels, which then had to be revised down,” Antoni told the DCNF. “The worsening economic conditions fell outside of the assumptions used by the BLS statisticians, so the estimates became inaccurate. There could be similar problems today due to fallout from the government-imposed recession in 2020 because the labor market still hasn’t recovered.”
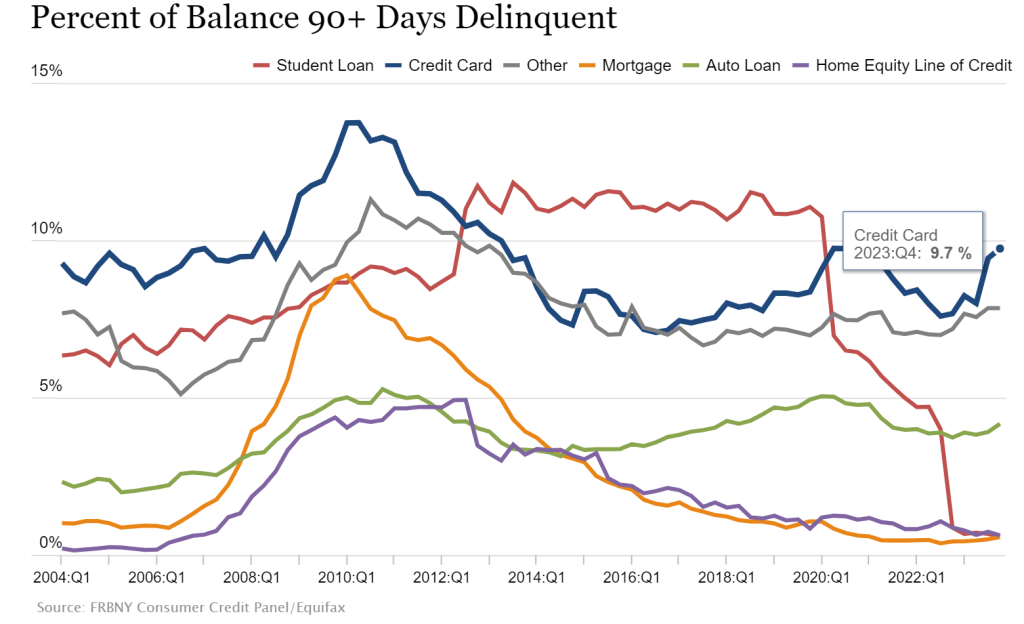
Credit card delinquecies (90+ days) rose to almost 10% in Q4 2023.
Credit card delinquencies surged more than 50% in 2023 as total consumer debt swelled to $17.5 trillion, the New York Federal Reserve reported Tuesday.
Debt that has transitioned into “serious delinquency,” or 90 days or more past due, increased across multiple categories during the year, but none more so than credit cards.
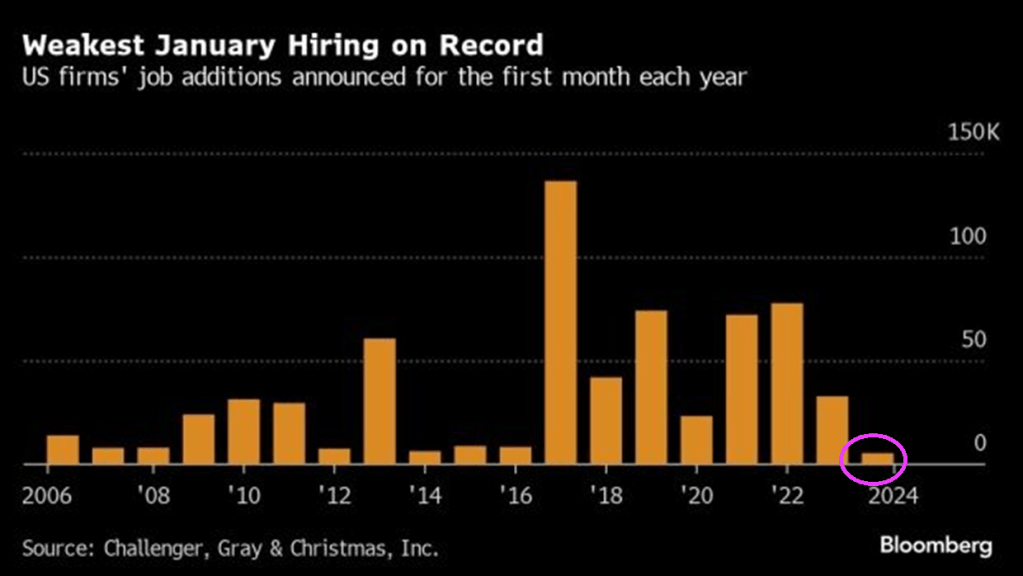
Rising credit card delinquencies combined with the worst job additions in January on record.
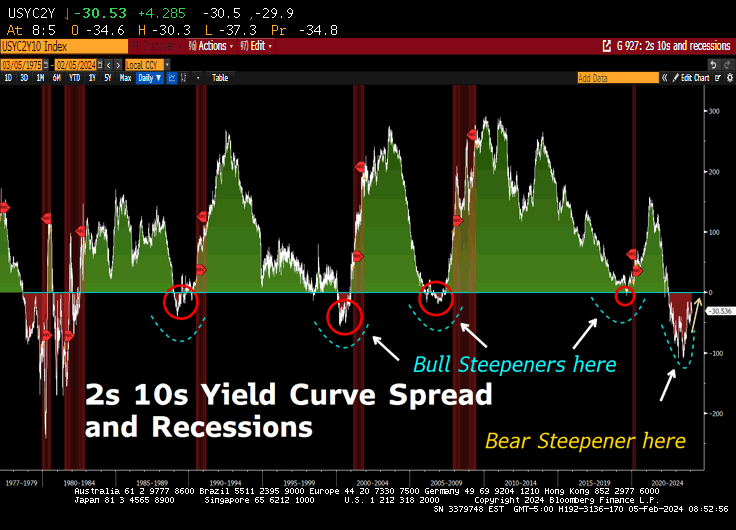
But at least the 10Y-2Y US Treasury yield curve is ALMOST flat (h



















You must be logged in to post a comment.