The S&P 500 index tanked -2.35% after Powell and The Fed failed to pivot.
Federal Reserve Chair Jerome Powell opened a new phase in his campaign to regain control of inflation, saying US interest rates will go higher than previously projected, but the path may soon involve smaller hikes.
Addressing reporters Wednesday after the Fed raised rates by 75 basis points for the fourth time in a row, Powell said “incoming data since our last meeting suggests that ultimate level of interest rates will be higher than previously expected.”
Powell said is it would be appropriate to slow the pace of increases “as soon as the next meeting or the one after that. No decision has been made,” he said, while stressing that “we still have some ways” before rates were tight enough.
“It is very premature to be thinking about pausing,” he said.
Fed Funds Futures data point now to a June peak in the target rate of 5.055%, then a decline.
As I told my Chicago, Ohio State and George Mason University finance and real estate students, repeatedly, “Watch out when The Fed begins to tighten monetary policy. It will be a bloodbath for taxpayers.”
Well, here we are. I argue that Biden’ green energy knucklehead policies are driving inflation, or it could be the insane level of Federal spending that Obama economist Larry Summers warned us about, or rising wages (in part due to Federal spending) is to thank for inflation. Or all of the above.
Regardless of the cause, the bond market is enduring its worst selloff in a generation, triggered by high inflation and the aggressive interest-rate hikes that central banks are implementing. Falling bond prices, in turn, mean paper losses on the massive holdings that the Fed and others accumulated during their rescue efforts in recent years.
Rate hikes also involve central banks paying out more interest on the reserves that commercial banks park with them. That’s tipped the Fed into operating losses, creating a hole that may ultimately require the Treasury Department to fill via debt sales. The UK Treasury is already preparing to make up a loss at the Bank of England.
The Reserve balance has crashed into negative territory.
And Fed losses are skyrocketing.
Agency MBS prices are up today, but are down since August 2022. But risk measures duration and convexity are zooming upwards.
One of my friends on Wall Street wrote my yesterday claiming “The 10-year Treasury yield is set to crash. Brace for impact!” Then I logged into Bloomberg this AM and saw the 10-year Treasury yield up almost 10 basis points (although it is down -2 BPS at 10:20am). Did markets not read his comments?? Maybe they did!
Well, The Fed is doing the Tighten Up. That is, The Fed is FINALLY removing their excessive monetary stimulus left over from the Bernanke Blowout (2008 adopting Japan’s print ’till you drop model).
But as The Fed removes their monetary stimulus (rate increases), we are seeing negative effects in the housing market. I call this chart “The X Factor.”
The US Treasury 10-year yield is up to 4.3% this morning, a far cry from 1.804% when Biden was crowned as President on January 20, 2021. The 30-year mortgage rate is up from 3.67% on Coronation Day to 7.32% yesterday, an increase of … 100% (that is, the 30-year mortgage rate has doubled under Biden). At the same time, Existing Home Sales YoY have gone from -2.41% in January 2021 to -23.79% in September 2022. THAT is a HUGE decline!
University of Michigan’s consumer sentiment for housing for 77 in January 2021 to 39 in November 2022. That is a -49% decline in consumer confidence. Also a big decline.
But going back to my pal’s email, he also said that The Fed is unwinding its balance sheet at a dangerously rapid rate (orange line). Relative to just increasing it, I would agree with him. But The Fed’s balance sheet is barely declining to my eyes. The troubling thing for housing is that inflation is so hot that REAL average hourly earnings YoY (yellow line) has fallen from +0.24% growth YoY on January 25, 2021 to a horrific -2.80% YoY rate in September 2022.
Bill’s point to me is that lending is still hot (at least commercial and industrial lending or C&I) while The Fed’s balance sheet remains in force (green line).
The Fed has a lot more work to do if they want to cool the commercial lending market. They have successfully slowed down the residential mortgage market.
The US 30yr Mortgage rate just hit a new high since 2000 as The Federal Reserve counterattacks the highest core inflation rate (6.60%) since 1982.
According to the Taylor Rule (which The Fed has chosen to ignore), a 6.60% core inflation rate implied a Fed target rate of 12.40%. Not likely since Fed Funds Futures data points to …
A maximum target rate of 4.963% at the May 2023 FOMC meeting, significantly lower than the needed rate of 12.40%. The Fed is like the world’s worst bar bouncer.
Rather than accepting blame for the horrific inflation rate crushing the American middle class and low wage workers, Biden is twisting the night away.
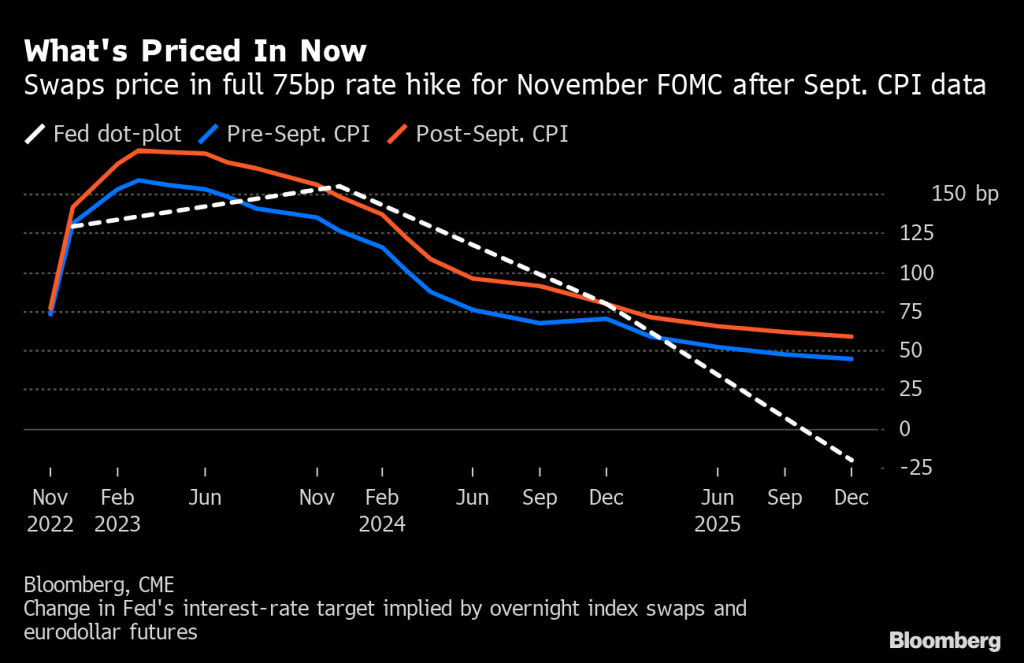
* Fed Swaps Lean Toward Back-to-Back Three-Quarter-Point Hikes * Hotter-than-expected September inflation data spark shift
(Bloomberg) — The market for wagers on the Federal Reserve’s policy rate is leaning toward pricing back-to-back 75 basis point rate hikes in the next two central bank meetings after consumer prices rose more than forecast in September.
The rate on the November overnight index swap contract rose to 3.86%, more than 75 basis points above the current effective fed funds rate, while the one referring to December climbed to 4.50%. A total of 142 basis points of rate hikes are now priced in for the next two policy meetings, just short of consecutive three-quarter-point hikes.
Prior to the inflation data, OIS markets were leaning toward the central bank cooling the pace of tightening to a 50 basis point move in December. At Wednesday’s close, swaps priced in around 130 basis points of hikes over the remaining of the year, which is equivalent to 55 basis points for December.
The market also priced in a higher eventual peak for the policy rate, with the March 2023 contract touching 4.864%.
The CPI data was “clearly a shock for the markets and the markets are off because of it,” Seth Carpenter, chief global economist at Morgan Stanley said on Bloomberg television. “There is persistence, particularly in the services side of inflation.”
Excluding food and energy, the Consumer Price Index increased 6.6% from a year ago, the highest level since 1982, Labor Department data showed Thursday. From a month earlier, the core CPI climbed 0.6% for a second straight month.
The Fed has raised its policy rate five times since March, most recently to a range of 3%-3.25% in September, after dropping the lower bound to 0% two years earlier at the onset of the pandemic.
The Fed Funds Futures data is pointing further Fed rate hikes with a turnaround in March 2023.
And with that awful inflation report and the likely Fed counterattack, the two year US Treasury yield has risen to 4.4361%, the highest since The Great Recession and banking crisis.
Fed Fireball! Comin’ at ya!!
Biden and Powell should appear on Saturday Night Live as the joint Debbie Downer. Or Democrat Downer.
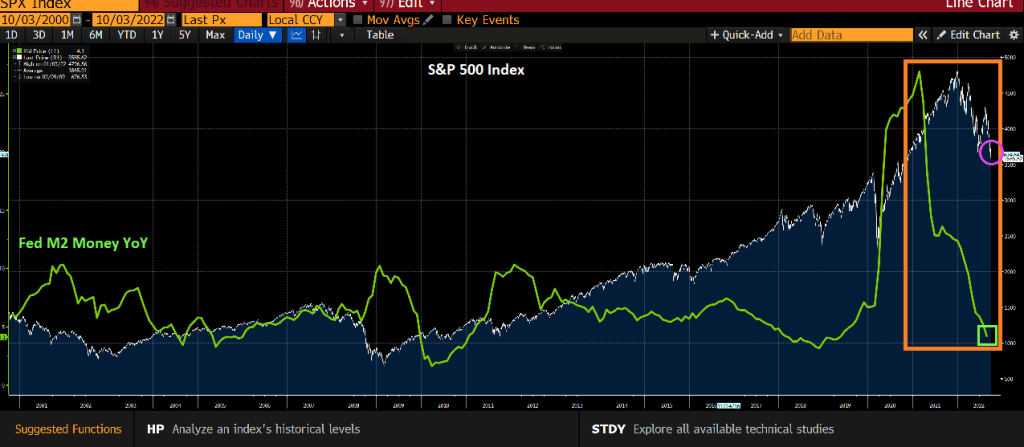
Another casualty of The Fed’s tightening and reduction in M2 Money supply are … the mortgage and housing markets. The US mortgage rate has soared to 7.04% (highest since 2000) and mortgage DEMAND has fallen to the lowest level in recorded history.
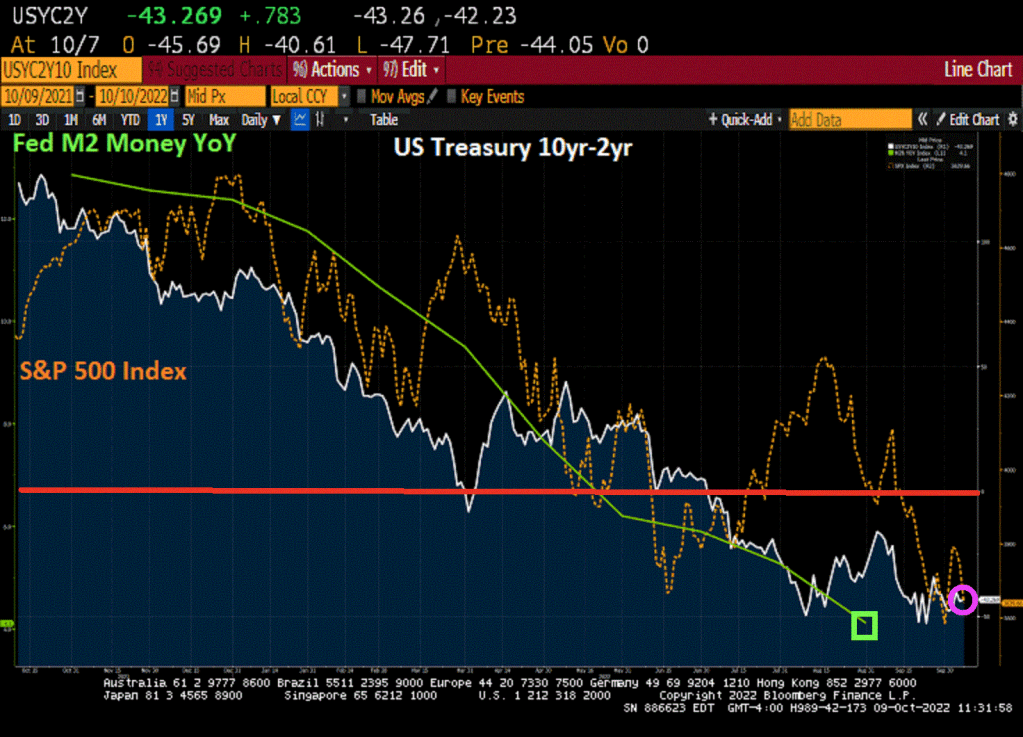
Here is my chart from yesterday showing the inversion of the US Treasury 10yr-2yr curve and decline in the S&P 500 index as The Fed tightens.
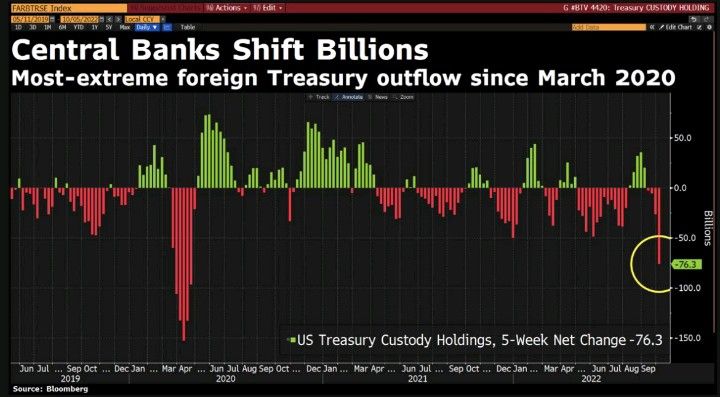
And then we have this chart showing the most-extreme foreign Treasury outflow since March 2020.
At least The Fed is predicted to start cutting rates again in March 2020.
Yes, Biden and Powell have reenacted Kevin’s famous chili spill. And Ben Bernanke, the creator of QE from late 2008 was just award the Nobel Prize in economics for distorting financial markets.
In addition to creating the highest inflation rate in 40 years, we are now seeing the highest mortgage rate in 16 years. I feel like we are all on a chain gang.
(Bloomberg) — US mortgage rates jumped to a 16-year high of 6.75%, marking the seventh-straight weekly increase and spurring the worst slump in home loan applications since the depths of the pandemic.
In fact, mortgage application just fell to the lowest level since May 1997.
The contract rate on a 30-year fixed mortgage rose nearly a quarter percentage point in the last week of September, according to Mortgage Bankers Association data released Wednesday. The steady string of increases in mortgage rates resulted in a more than 14% slump last week in applications to purchase or refinance a home.
Over the past seven weeks, mortgage rates have soared 1.30 percentage points, the largest surge over a comparable period since 2003 and illustrating the abrupt upswing in borrowing costs as the Federal Reserve intensifies its inflation fight.
The effective 30-year fixed rate, which includes the effects of compounding, topped 7% in the period ended Sept. 30, also the highest since 2006.
The Refinance Index decreased 18 percent from the previous week and was 86 percent lower than the same week one year ago. The seasonally adjusted Purchase Index decreased 13 percent from one week earlier. The unadjusted Purchase Index decreased 13 percent compared with the previous week and was 37 percent lower than the same week one year ago.
Here is today’s table of MBA mortgage applications and its ugly.
Unfortunately for the US chain gang, gasoline prices are rising again as the US drains its petroleum reserve. Because, that’s the way … uh-huh … they like.
As I frequently told my investment and fixed-income securities students at Chicago, Ohio State and George Mason University, any 10 basis point change in the US Treasury 10-year yield is significant.
But how about today’s 20 basis point decline in the US Treasury 10-year yield?
The UK’s 10-year yield is down even more at -24.1 basis points. Germany is down -18 bps and France is down -10.3 bps.
Speaking of credit default swaps, Credit Suisse is back to financial crisis levels while UBS and Deutsche Bank are not … yet.
With all the turbulence in markets thanks to the war in Ukraine and Biden’s green energy mandates and spending (not to mention Statists like Klaus Schwab screaming about a Great Reset), I was reminiscing about more simple times.
New CEO Koerner sought to reassure employees in Friday memo
Shares fall to a fresh record low, gauge of credit risk rises
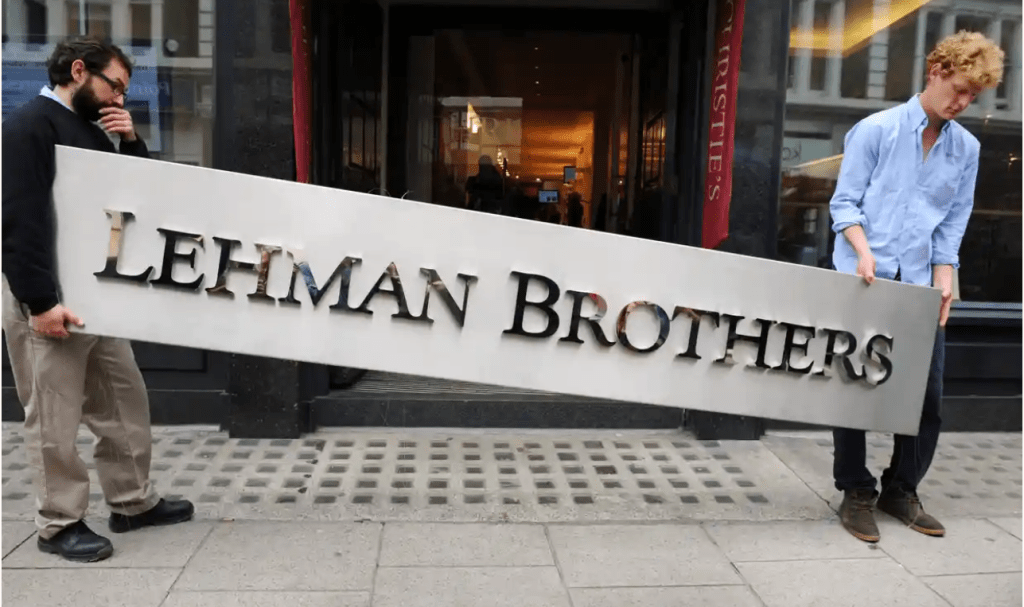
It is like the Lehman Brothers debacle in 2008 all over again.
(Bloomberg) — Credit Suisse Group AG was plunged into fresh market turmoil after Chief Executive Officer Ulrich Koerner’s attempts to reassure employees and investors backfired, adding to uncertainty surrounding the bank.
The stock, which had already more than halved this year before Monday’s sell-off, fell as much as 12% in Zurich trading to a record low that values the firm at less than $10 billion. That was accompanied by a spike in the cost to insure the bank’s debt against default, which jumped to its highest ever.
Koerner, for the second time in as many weeks, had sought to calm employees and the markets with a memo late Friday stressing the bank’s liquidity and capital strength. Instead, it focused attention on the dramatic recent moves in the firm’s stock price and credit spreads, and investors rushed for the exit when trading reopened after the weekend.
One notable difference between 2008 and today is that Credit Suisse’s equity was flying high in June 2007 then crashed a the global banking crisis went into full motion. We then saw Credit Suisse’s credit default swaps soar in early 2009. But today Credit Suisse’s equity is a pale imitation of its former self, but its credit default swap is now higher than it was at its peak in early 2009.
Credit Suisse is now trading lower than its European rival Deutsche Bank (aka, The Teutonic Titanic).
Yes, this brings back sickening memories of the 2008-2009 global financial crisis. Let’s see how The Federal Reserve, ECB and Bank of Switzerland handle this debacle, particularly with M2 Money growth so low.
It appears that we are in another Lehman debacle. Or should I say “Lemur Bros.”


You must be logged in to post a comment.