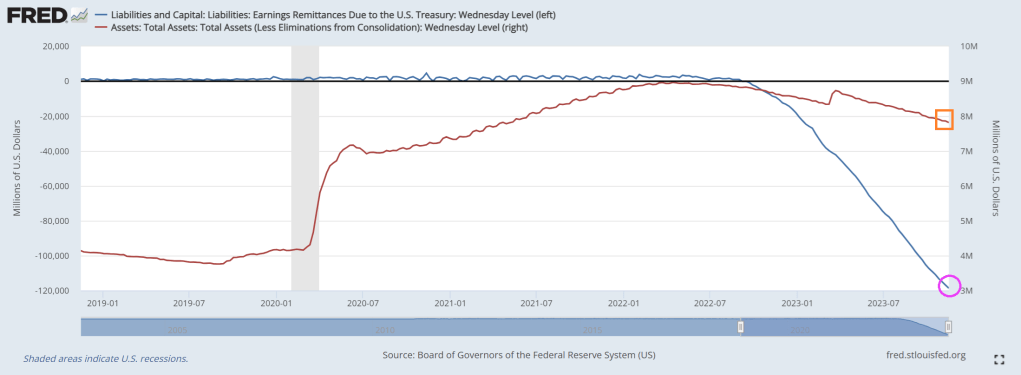
Biden’s terrible economic policies and horrid fiscal managment has put stress on The Federal Reserve. The Federal Reserve paid an estimated $76 billion to the Treasury in 2022 while banks’ willingness to lend has plummeted.
One of the key ways central banks absorb liquidity back out of the market is through reverse repo. These are short-term transactions where the Fed sells securities to banks and agrees to buy back at a higher price the next day.
This means banks are being paid to park cash with the Fed instead of injecting it into the economy through loans and fanning the fires of inflation.
That alone is costing the Fed $200M every single day.
In addition, the Fed is spending another $500M in daily interest payments on its reserve policy, i.e. balances that banks are holding in their reserve accounts at the Fed.
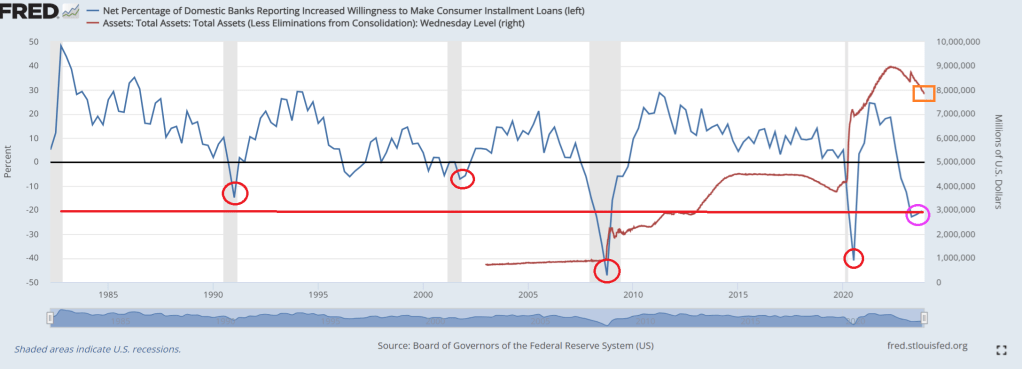
Banks’ willingness to lend has plummeted making credit availability increasingly tighter. Current levels have typically ended in recessions.This time is NOT different.
And on the energy side of the market, Biden Invokes ‘Wartime Powers’ to Attack Gas-Powered Furnaces. Of all the stupid things Biden has done, invoking wartime powers to make households use inefficent electric heat pumps instead of gas furnaces in stupid of two levels. First, invoking wartime powers for things unrelated to national defense is reckless and capricious. Second, electric heat pumps in the colder areas of the country is stupid as well. Electric heat pumps are inefficient, unless the goal of Biden and his Idiocracy is to “cull the herd” or kill off people during winter months (I had an electric heat pump in a condo I owned and it was terrible in winter months).
Yes, the Biden Administration and The Fed are economic mutilators!
The World Economic Forum (WEF) is a leading pusher of the ESG drug, pushed by the elite class intending to control the world. Unfortunately, numerous American politicians and influencers have attended the Davos meetings and have openly praised the WEF and its leader Klaus Schwab.
ESG investing, or sustainable responsible investing (SRI), uses this information about a company to inform investment decisions that prioritize all stakeholders.
Here’s how the Forum’s partners are leading the switch to stakeholder capitalism.
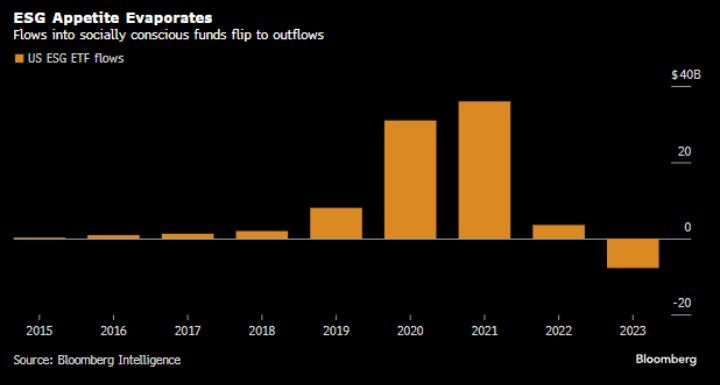
But all is not well with WEF’s ESG drug distribution. In fact, ESG flows into socially consious funds were a big thing during Covid (2020) and the first year of Biden’s Reign of Error. But ESG flows slowed sharply in 2022 and seeing net outflows in 2023.
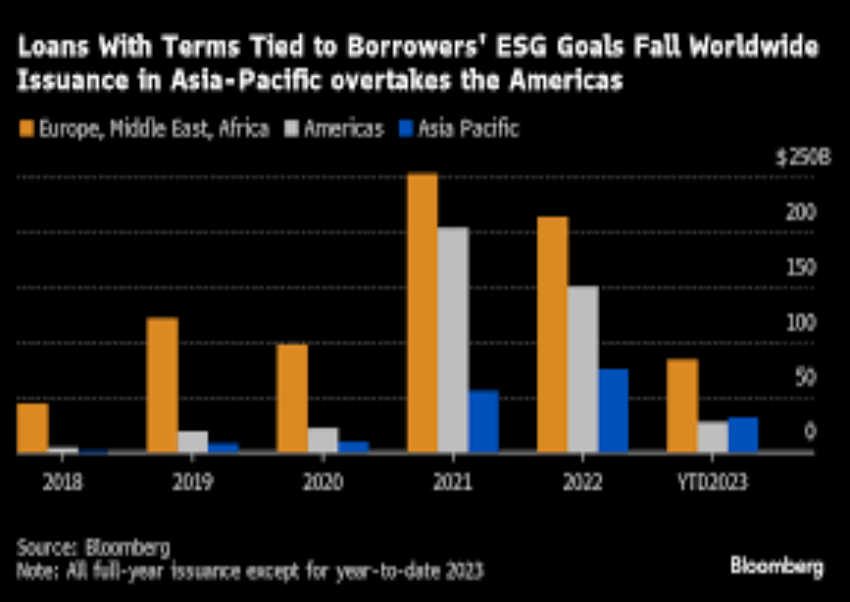
US borrowers are retreating en masse from the world’s second-biggest ESG debt class.
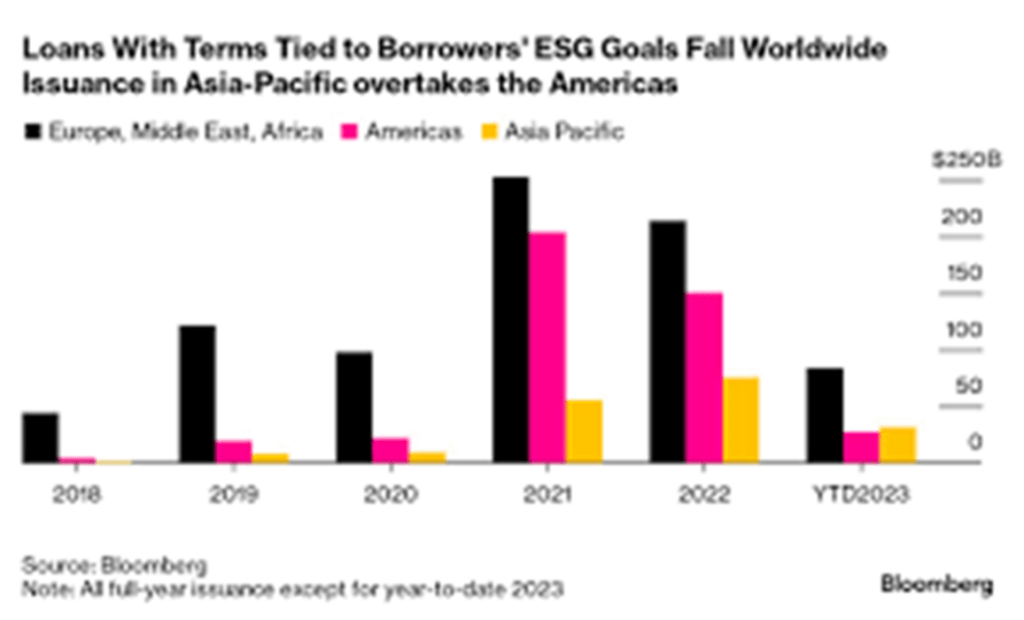
The $1.5 trillion market for sustainability-linked loans, in which borrowing is tied to environmental, social or governance goals, has seen an overall slowdown in volumes this year as both interest rates and greenwashing fears rise. But nowhere has the decline been as precipitous as in the US, where the number of new sustainability-linked loans is down 80% from a year earlier.
But ESG is still relatively popular in Europe, Middle East and Africa (orange). But taste for ESG is waning around the globe. But the selection of Biden as President in the US marked a surge in ESG -tied loans in 2021 and 2022 (not to mention the insane levels of spending out of Biden and Congress, much tied to the sustainability, green energy fantasy.
Loans with terms tied to borrower’s ESG goals have fallen worldwide.
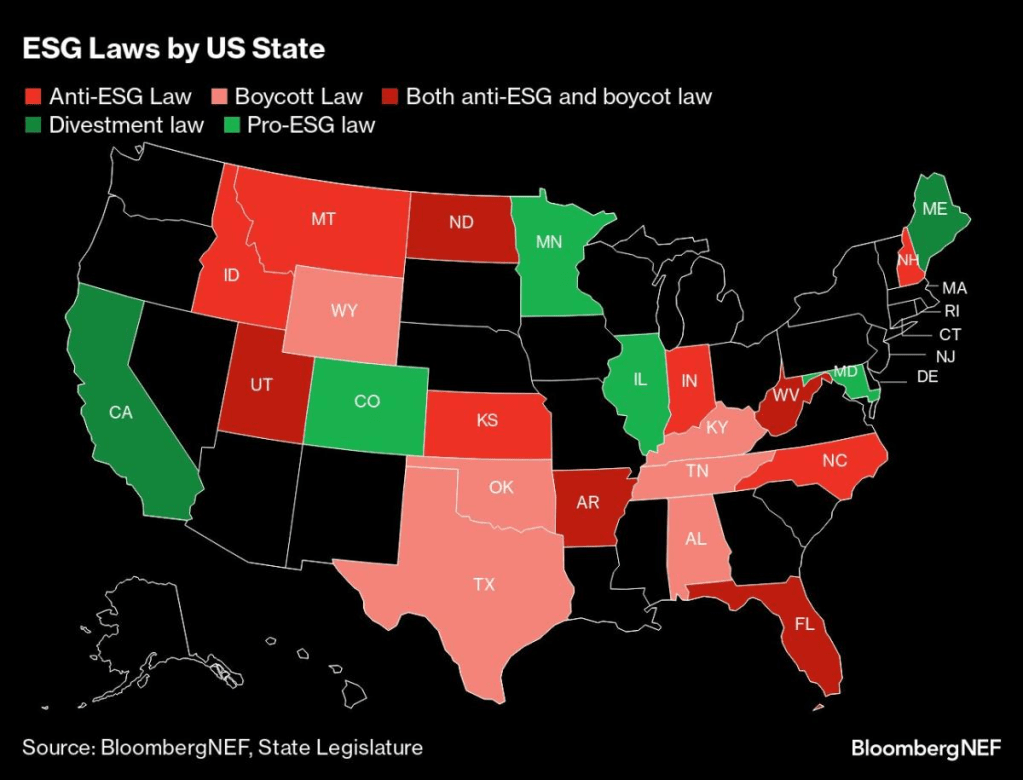
Several states (largely blue states like California, Minnesota, Illinois, and Colorado have pro-ESG laws) while several states have anti-ESG laws (largely red states like Montana, Idaho, North Dakota, Kansas, Utah, Indiana, Arkansas, Florida, and West Virginia).
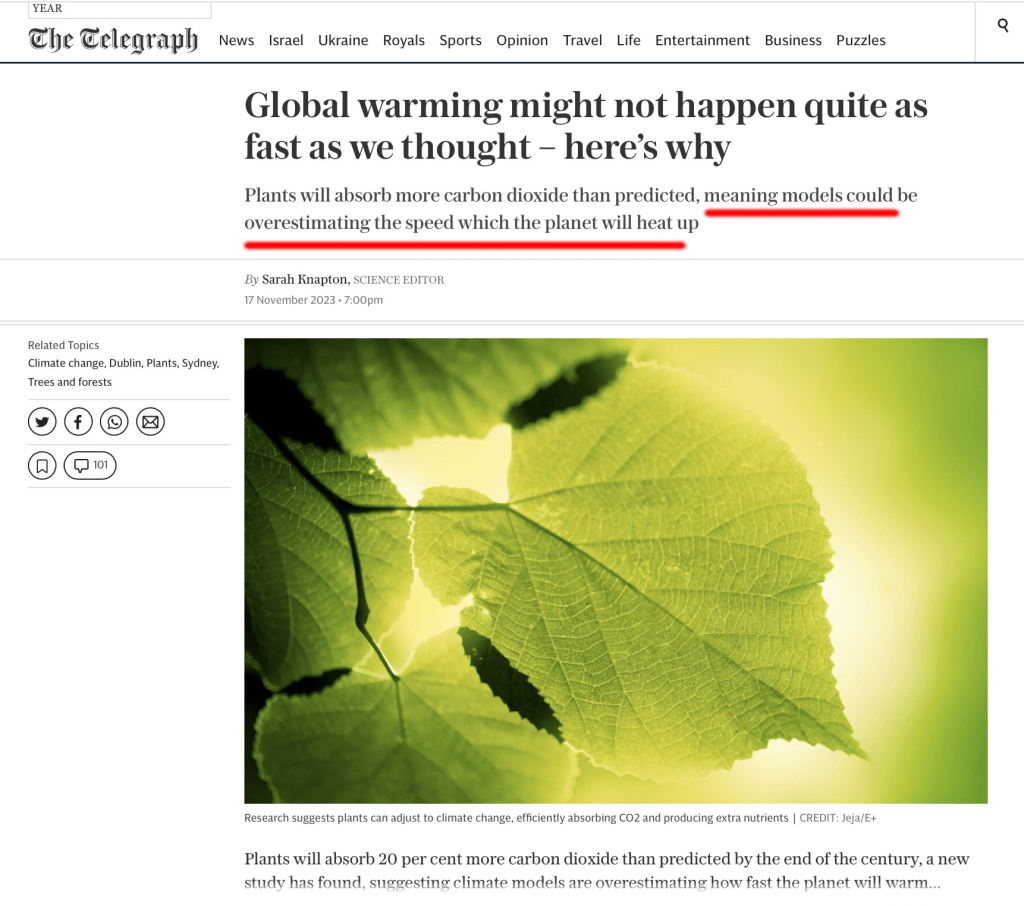
And of course, global warning may not be as dire as John Kerry and Greta Thunberg say.
WEF’s Klaus Schwab about to get sniffed by his 80-year old puppet, Joe Biden. In fact, Biden is singing “I’m your puppet.”
Here is Hunter Biden welcoming the Green Energy fairy and all the trillions in misallocated spending it brings.
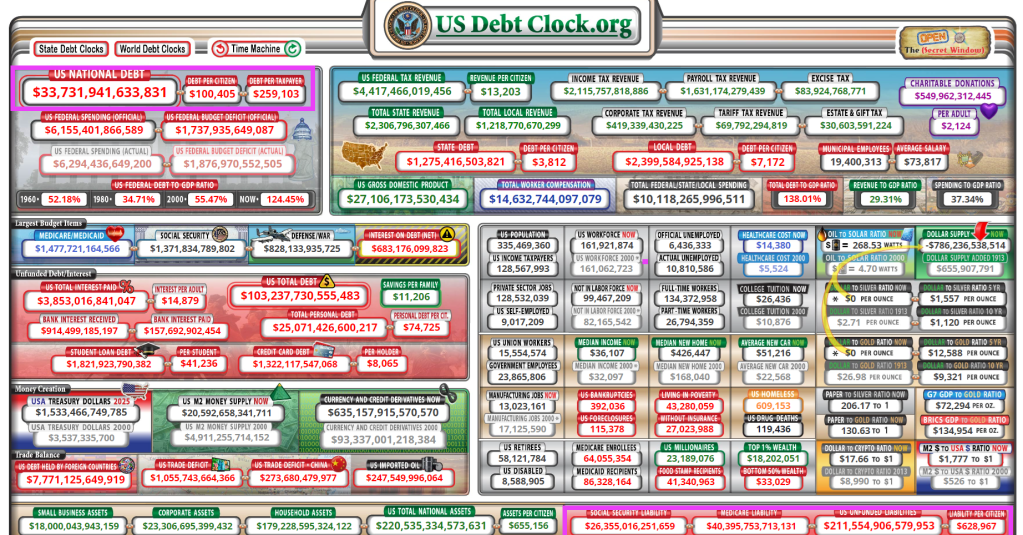
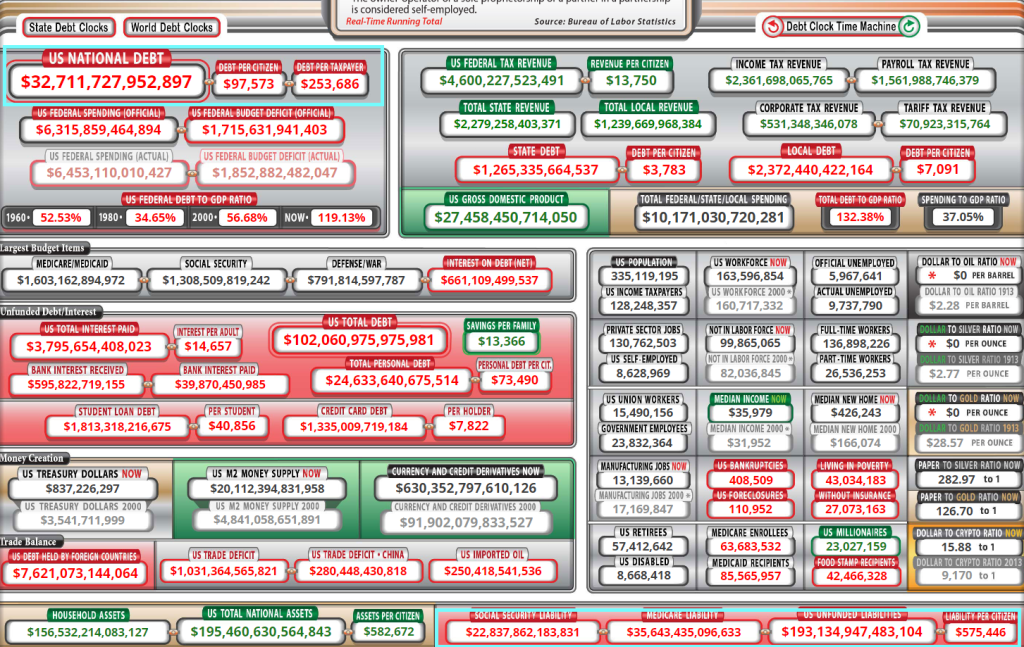
In fact, Congress and the Biden (mis) Administration are spending like the proverbial drunk sailors in port. US national debt is up to $33.7 TRILLION. That transates to $259,103 per taxpayer. With US debt to GDP of 138%!
Now, HERE IS THE REAL BAD NEWS! Unfunded promises that politicians made to Americans (Social Security, Medicare, Medicaid, etc.) now stands at $211.6 TRILLION. That equates to $629,000 per citizen. Maybe that should be the deal at the southern border: all immigrants must pay $629,000 for admission!
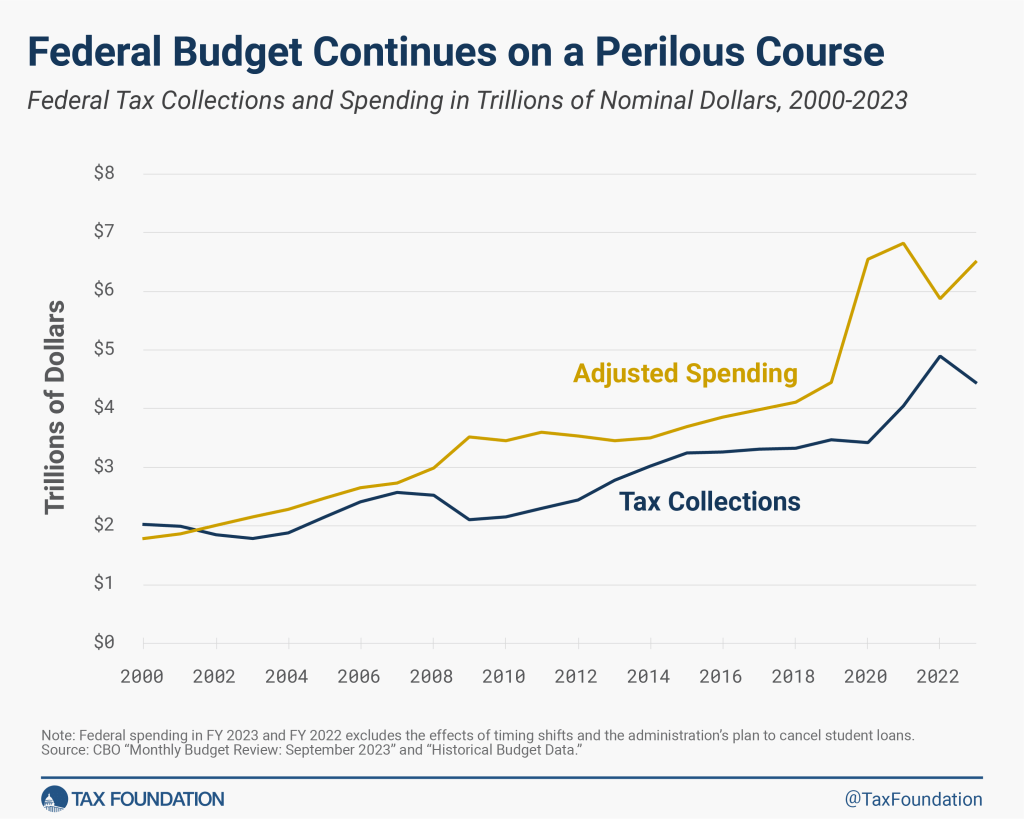
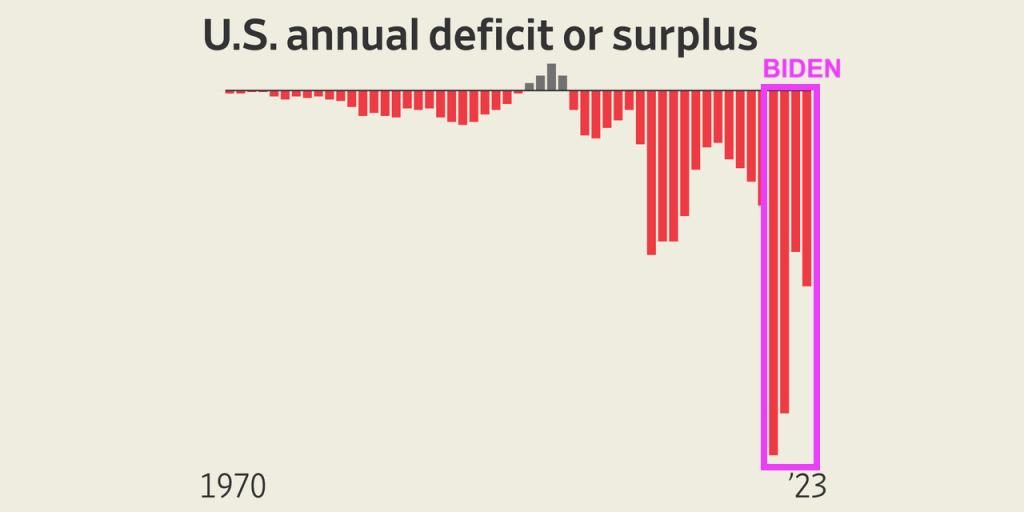
And the Federal budget deficit keeps on getting worse.
The budget deficits under Biden/Yellen have been the worst in history. So much for Biden whispering “Bidenomics is working!”
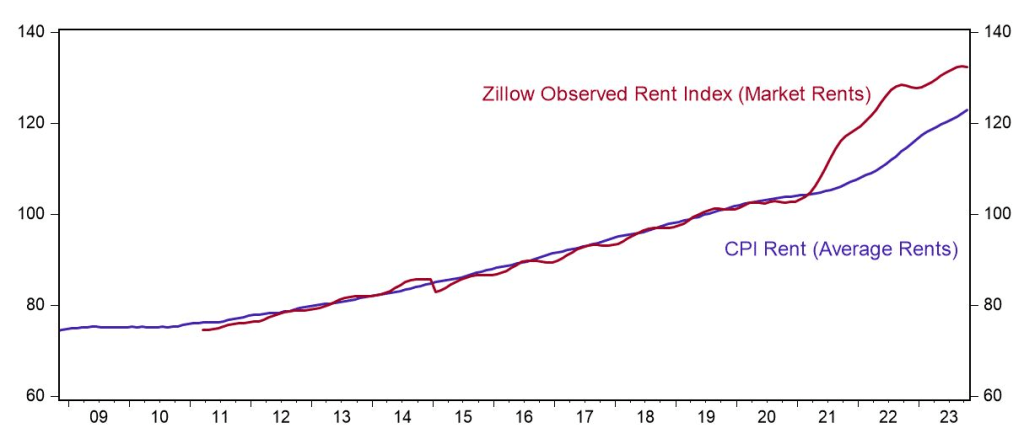
Rents in the US remain unaffordable to many.
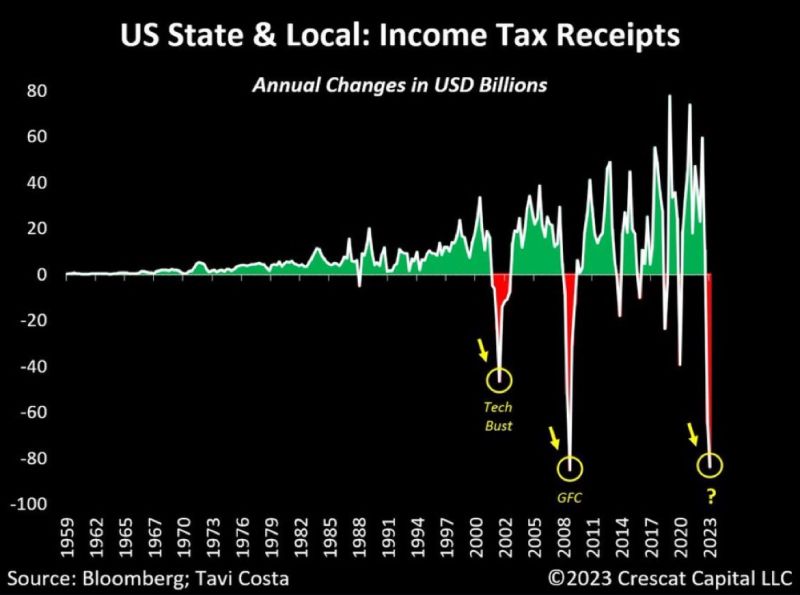
And Yellen, our nation’s financial consigliari, hasn’t said much about the dire decline in income tax receipts.
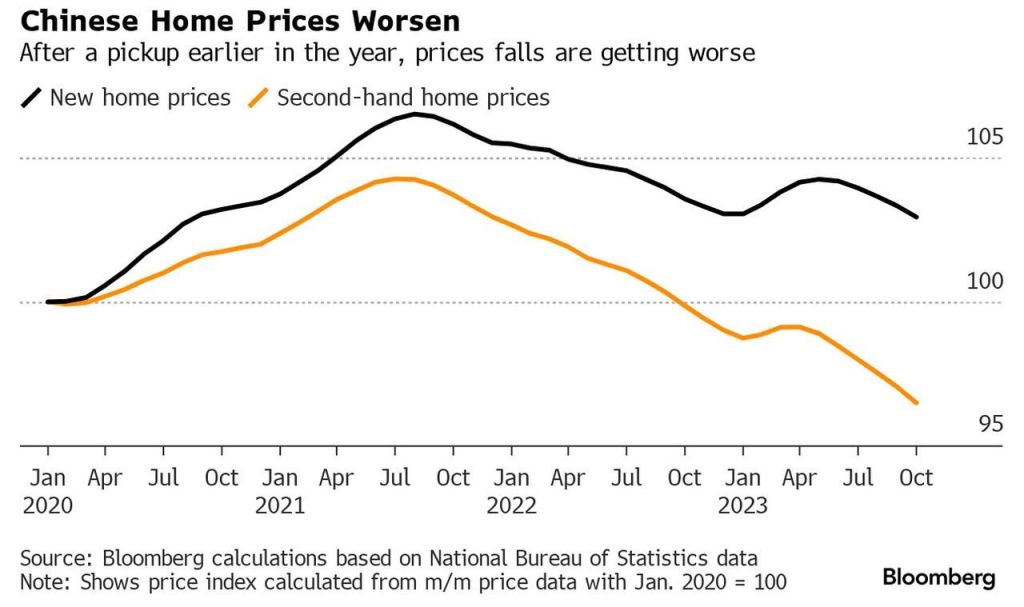
But Biden’s favorite country China, a classic top-down command economy like Biden and Yellen love,
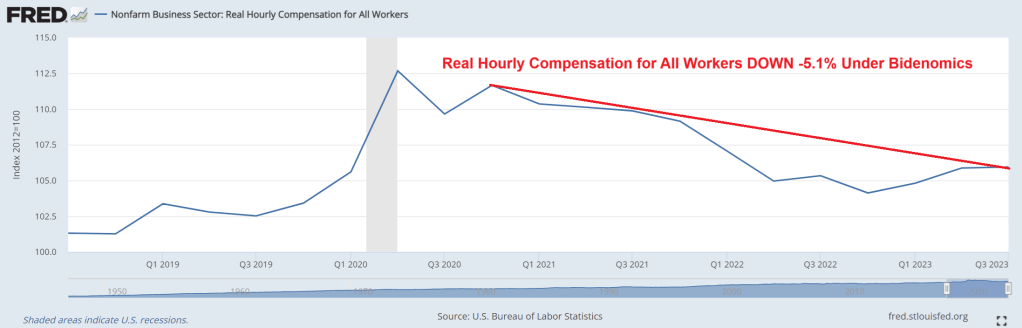
On Sunday, President Joe Biden tweeted, “Right now, real wages for the average American worker is higher than it was before the pandemic, with lower wage workers seeing the largest gains. That’s Bidenomics.” That’s right, Joe! Except real hourly compensation has DECLINED by -5.1% under Biden.
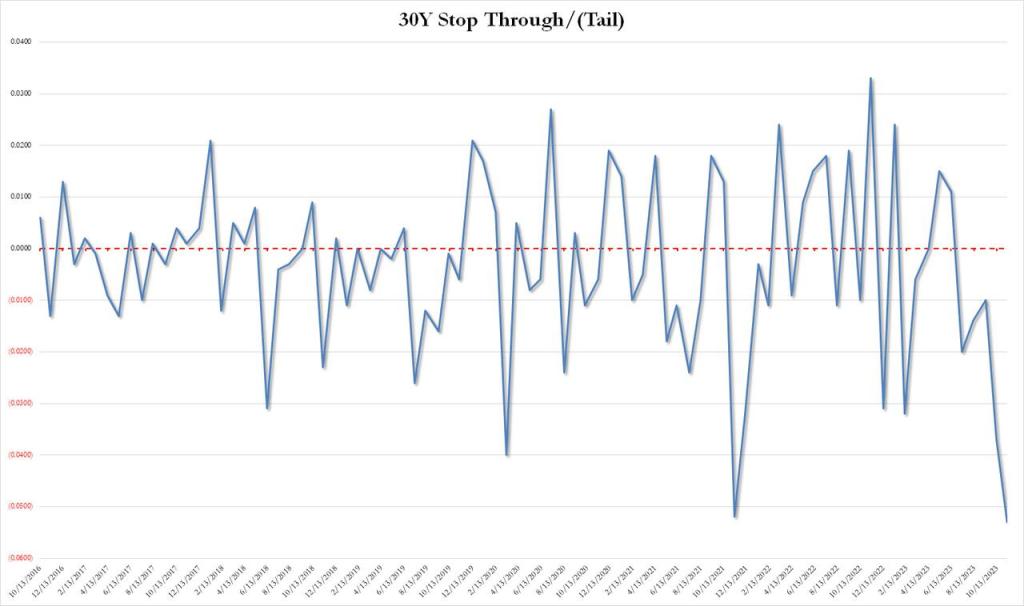
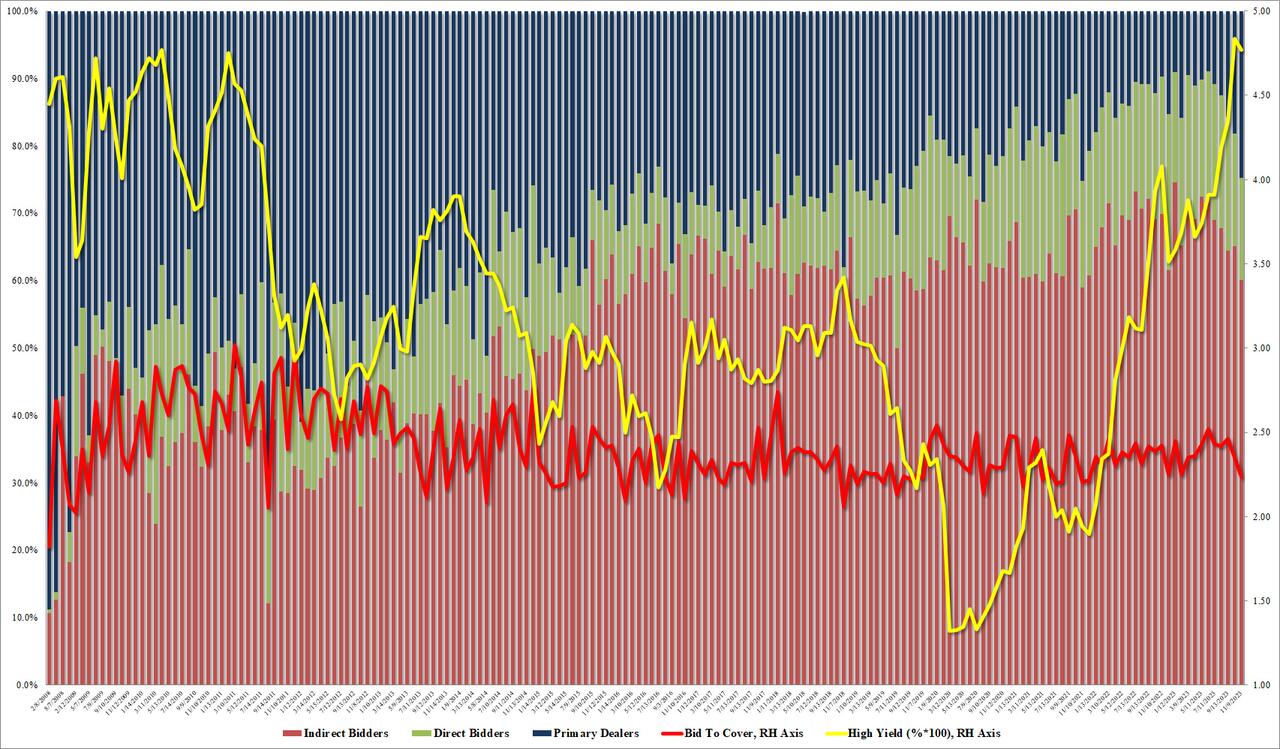
The bond priced at a high yield of 4.769%, which was below last month’s 4.837%, and just shy of the April 2010 high. But more importantly, it tailed the When Issued by a whopping 5.3bps, which was… well… terrible, because as shown in the chart below, this was the biggest tail on record (going back to 2016).
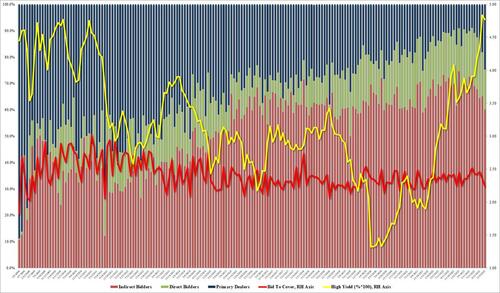
The bid to cover was just as bad: at 2.236 it was the lowest since Dec 2021.
The internals were even worse as foreign bidders (Indirects) tumbled from 65.1% to 60.1%, the lowest since Nov 2021, and with Directs taking down only 15.2%, banks (Dealers) were forced to step up and take the balance, or a whopping 24.7%, double the recent average of 12.7%, and the highest since Nov 2021.
This is a big warning flag because every time we have seen a surge in Dealer takedowns, some sort of Fed intervention – QE or otherwise – has usually followed and we doubt this time will be different.
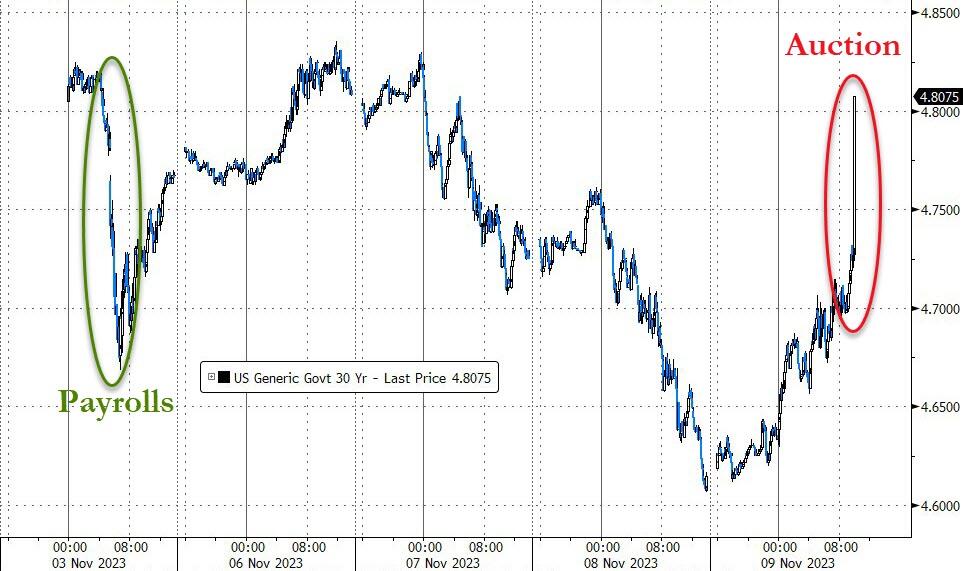
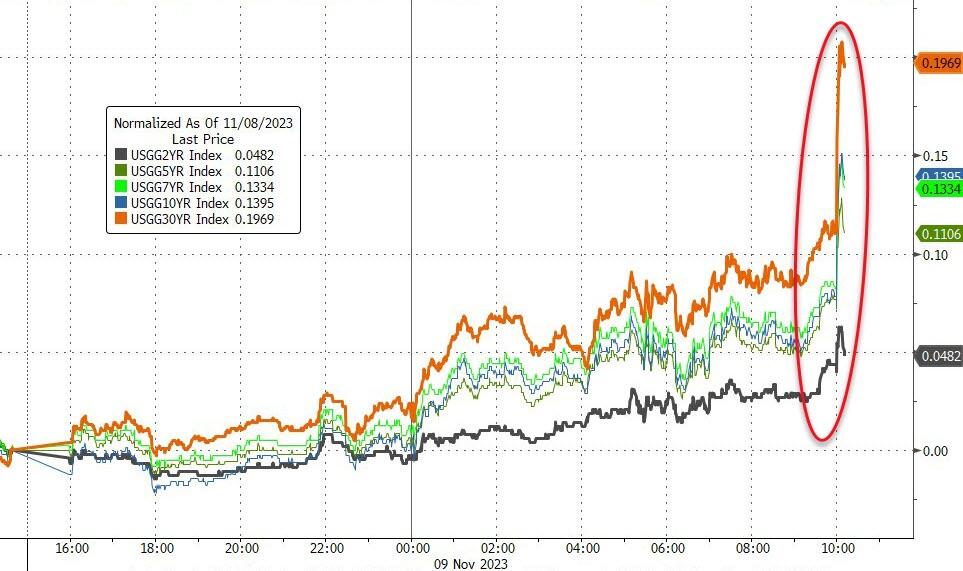
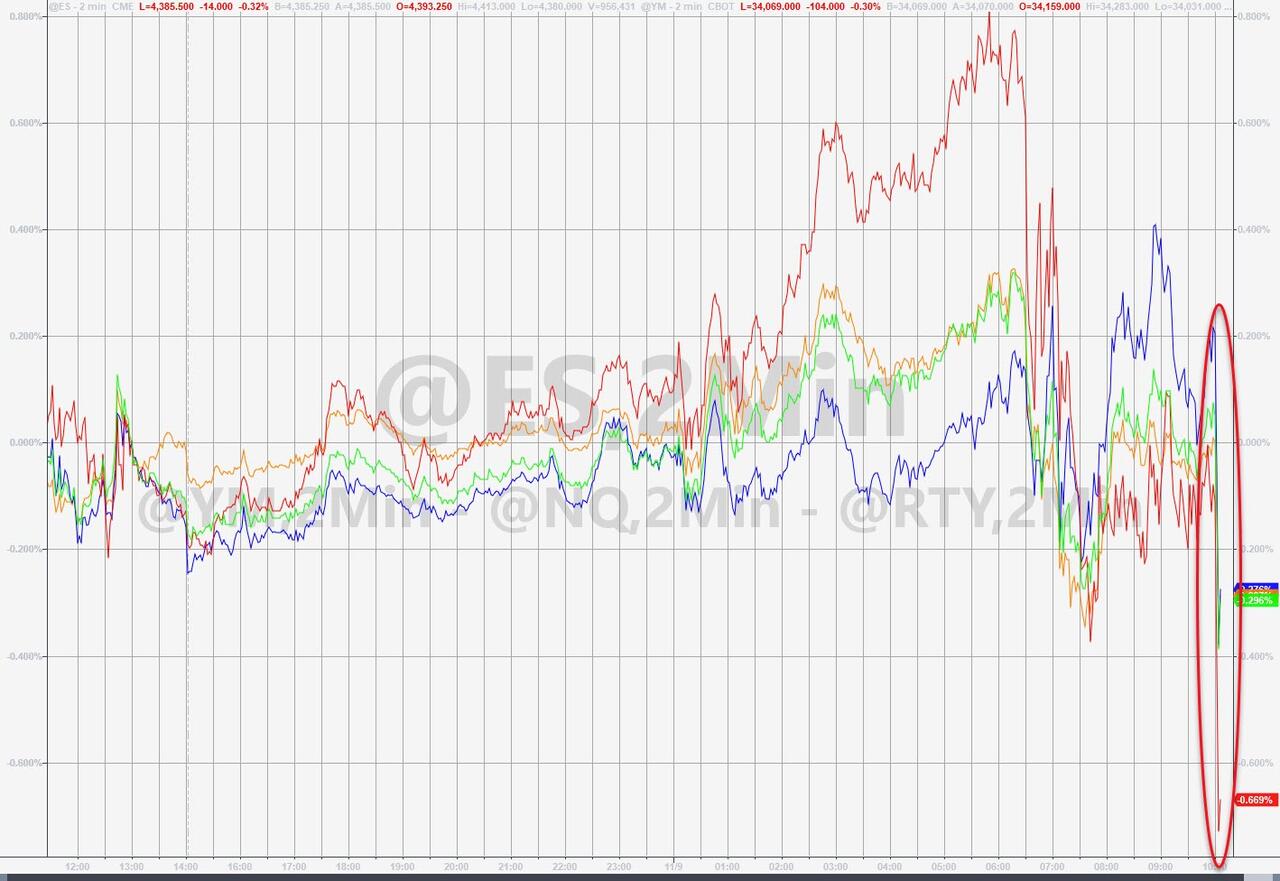
The market reaction to the catastrophic 30Y auction was immediately, sparking a swift and painful response across markets with bonds and stocks hammered lower and the dollar spiking.
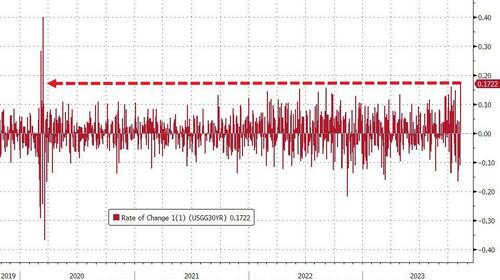
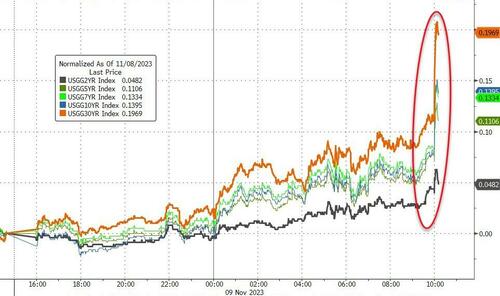
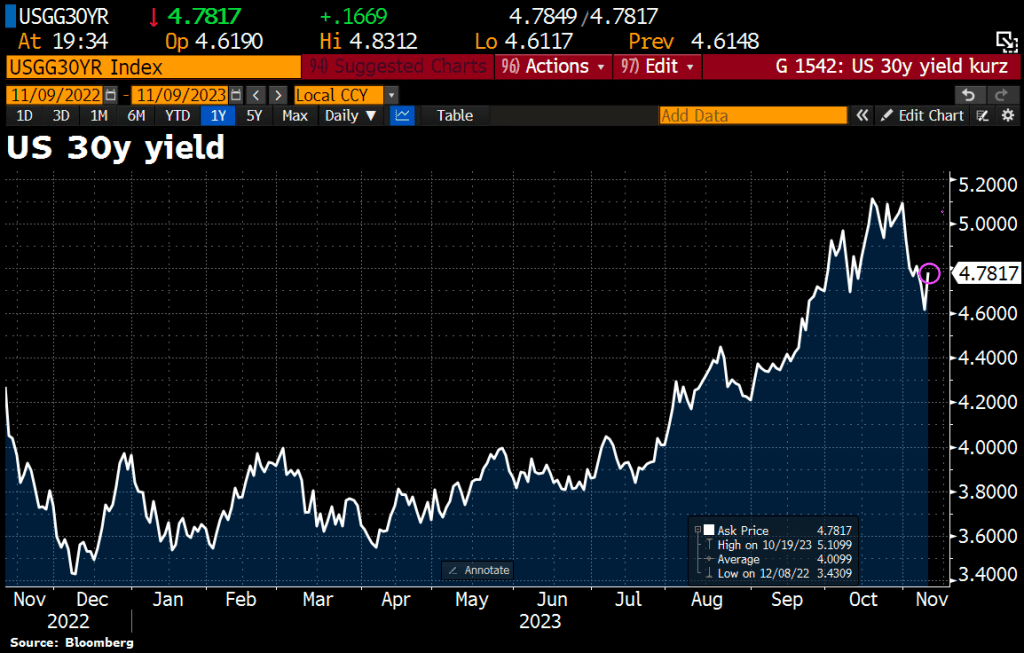
Treasury yields – as you would expect – exploded higher, with 30Y Yields back up to pre-payrolls levels…
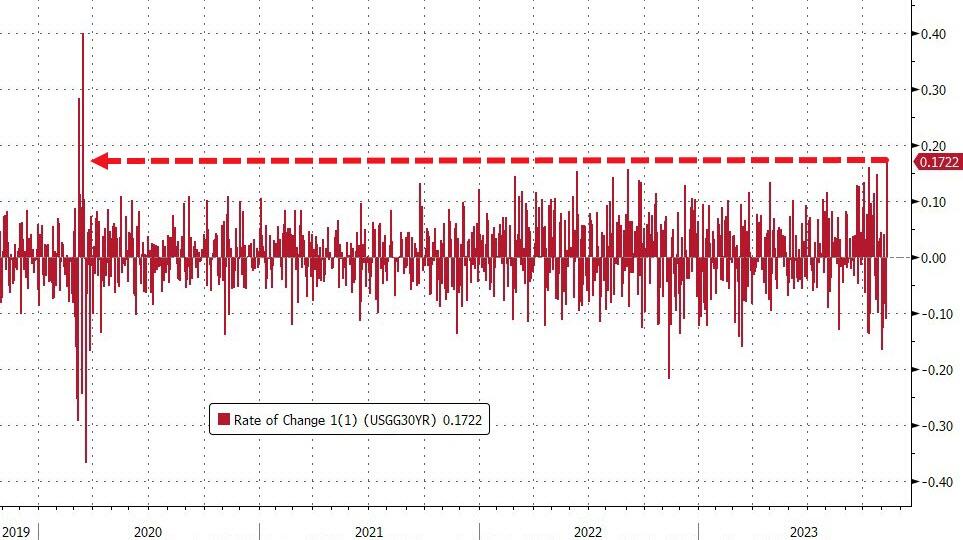
That is the biggest spike in 30Y yields since March 2020…
But the entire curve is higher in yields…
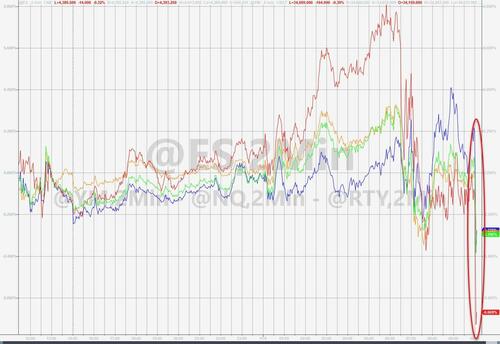
Stocks tanked…
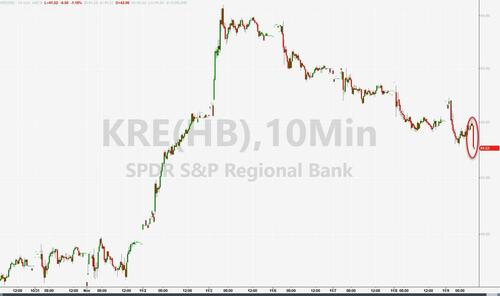
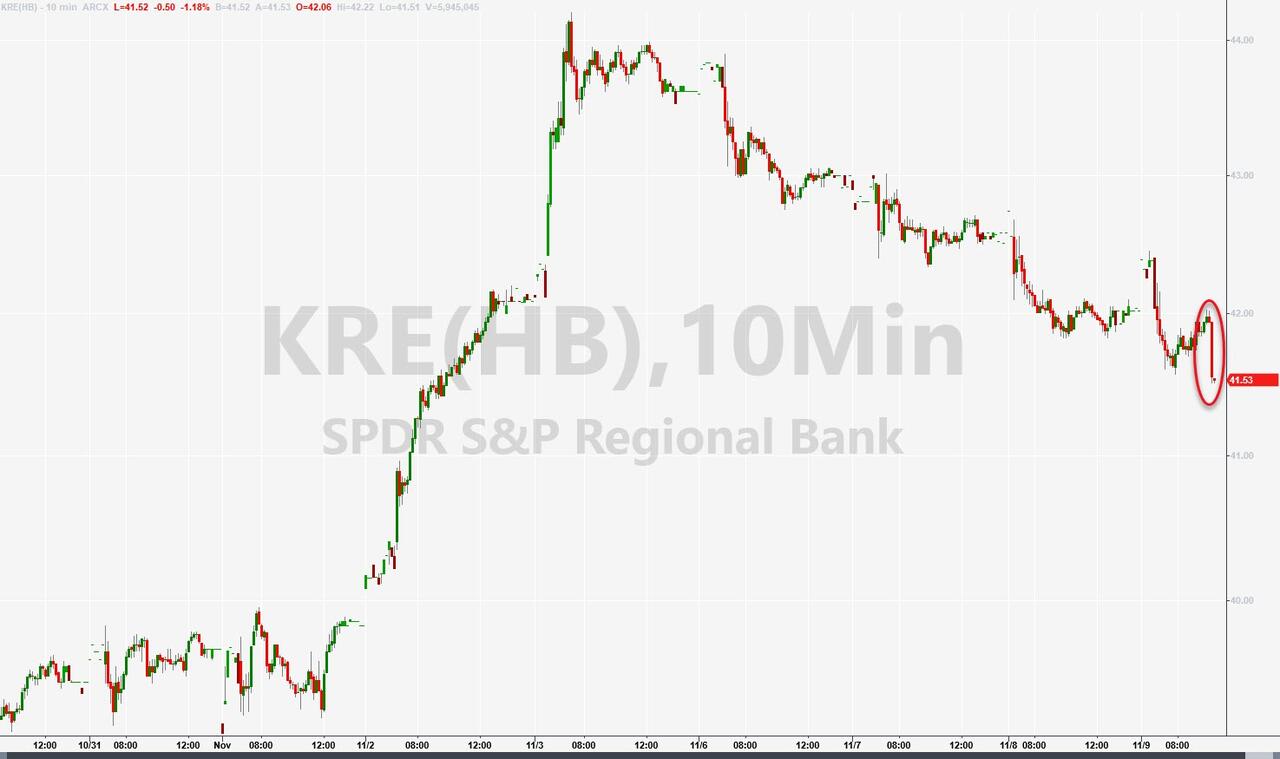
Regional bank stocks tumbled…
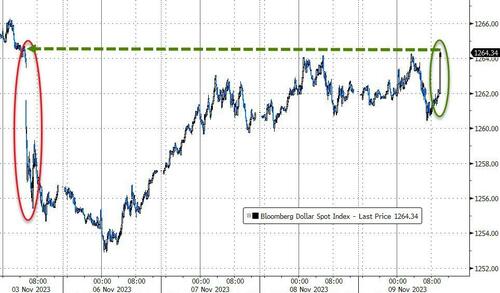
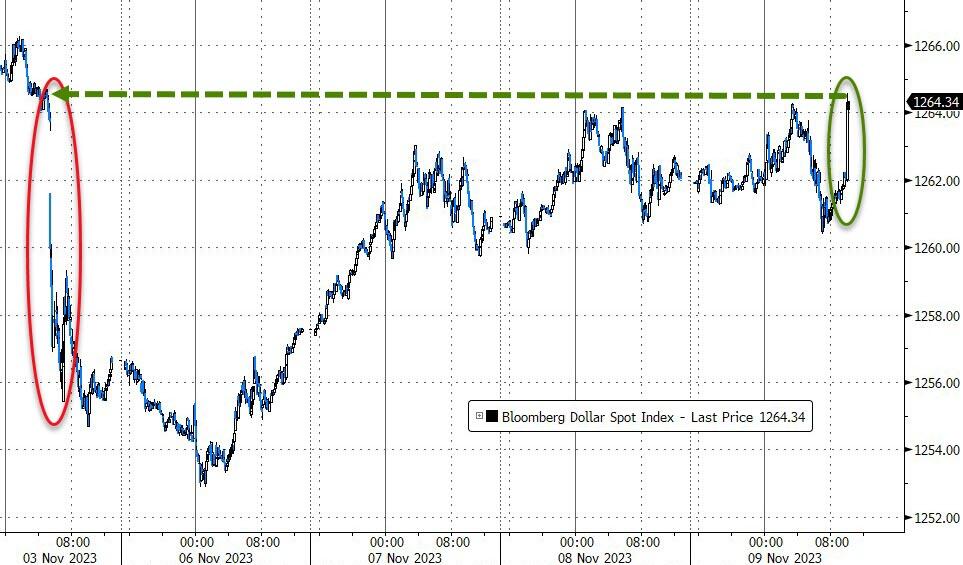
The dollar ripped back up to pre-payrolls levels…
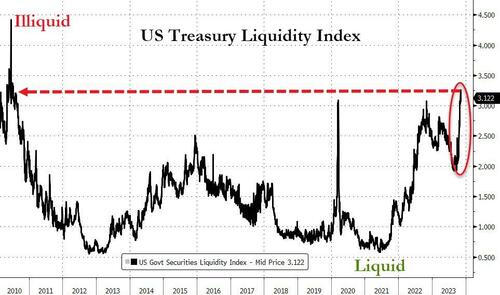
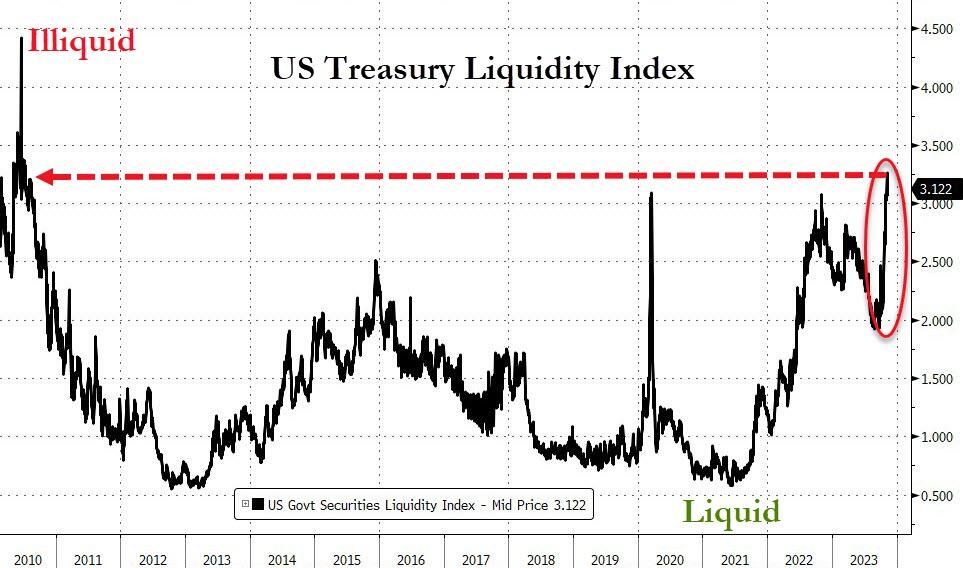
Finally, we note that this ugly auction comes as Treasury Liquidity is evaporating dramatically…
The Fed (and The Treasury) have a problem!! Particularly since the 30Y yield reversed course and is on the rise again.
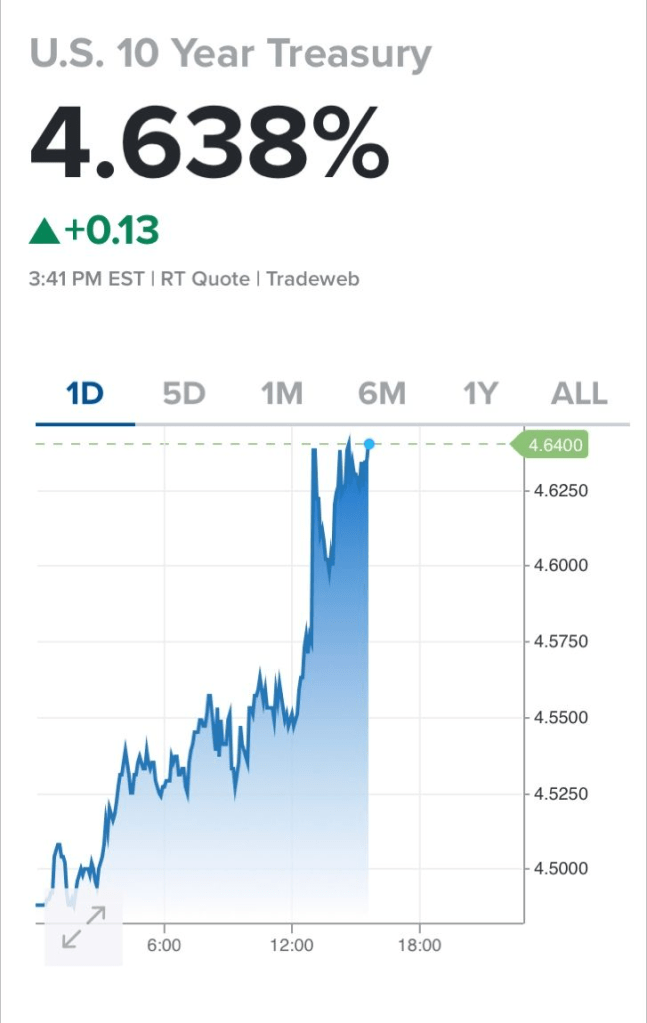
And at the 10 year tenor, the rate rose to 4.638%.
All together now!!
The Edmund Fitzgerald, symbolic of the US under Biden and Janet Yellen.
Bidenomics is a windfall for the donor class (high rate of return on campaign contributions) while the middle class gets beaten to a pulp. Waiting for Biden to lean over and creepily whisper “It’s working!” Even though it is clearly not working, at least for the middle class.
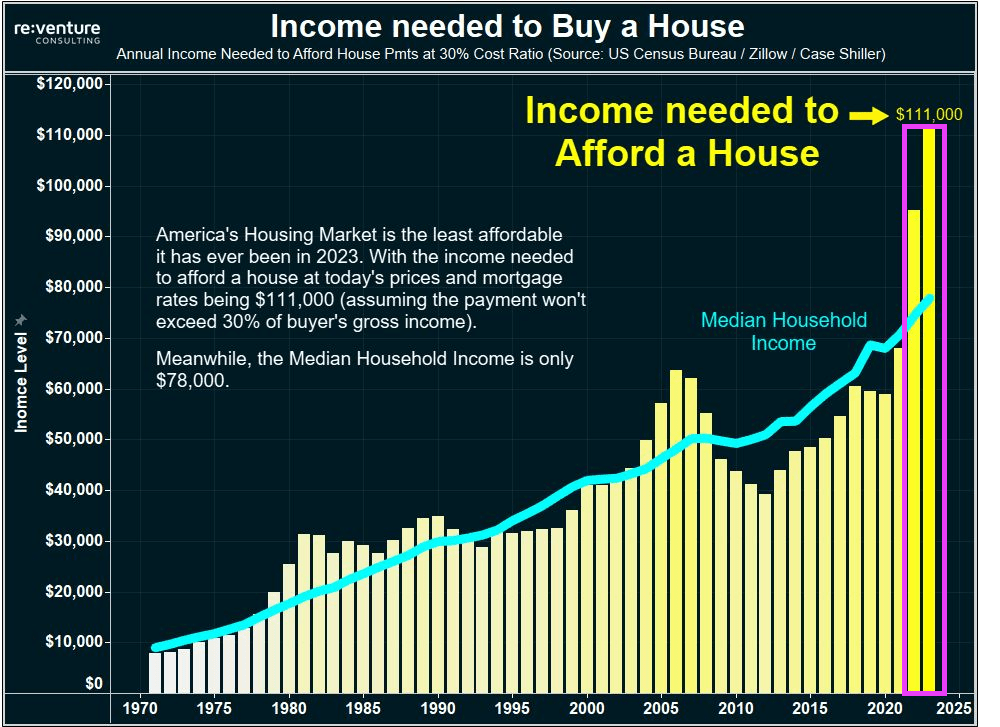
Evidence that Bidenomics is not working and destructive? Try the surging income needed to buy a house under Biden. Home prices are rising faster than median household income. As in $111,000 income needed to buy a house, while median household income is only $78,000. So, housing is simply unaffordable under Bidenomics. The Biden era is outlined in pink.
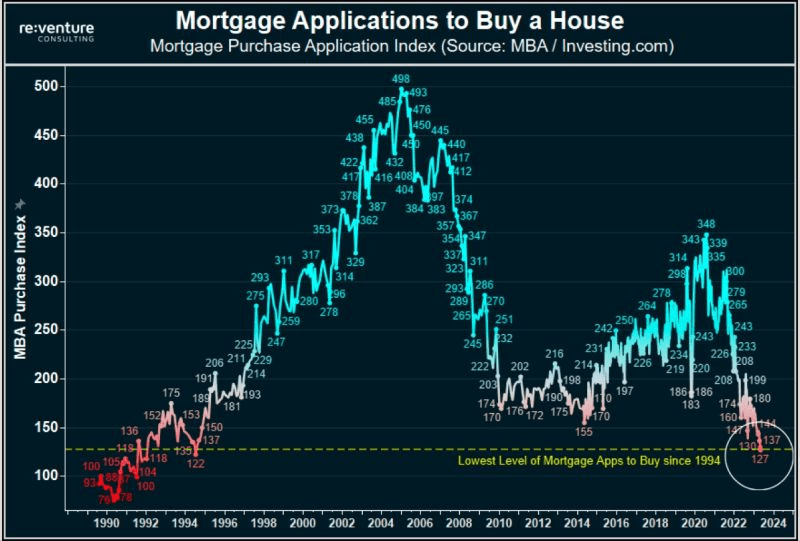
Mortgage purchase applications have collapsed to 1994 levels.
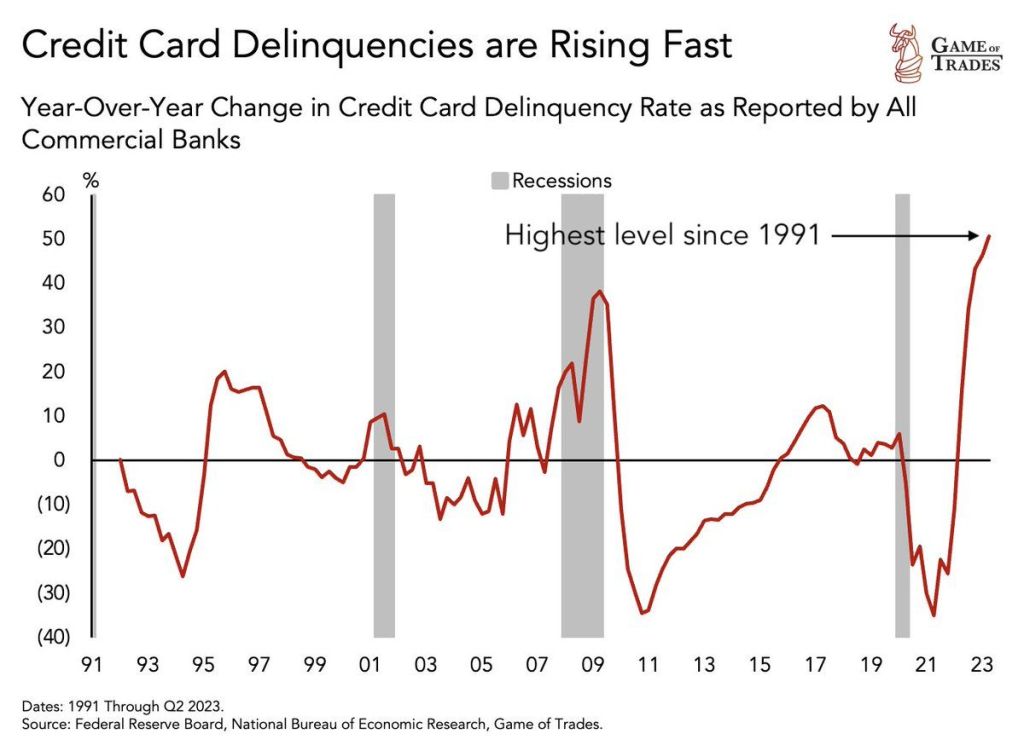
Meanwhile, stressed households are seeing credit card delinquencies at the highest level since 1991.
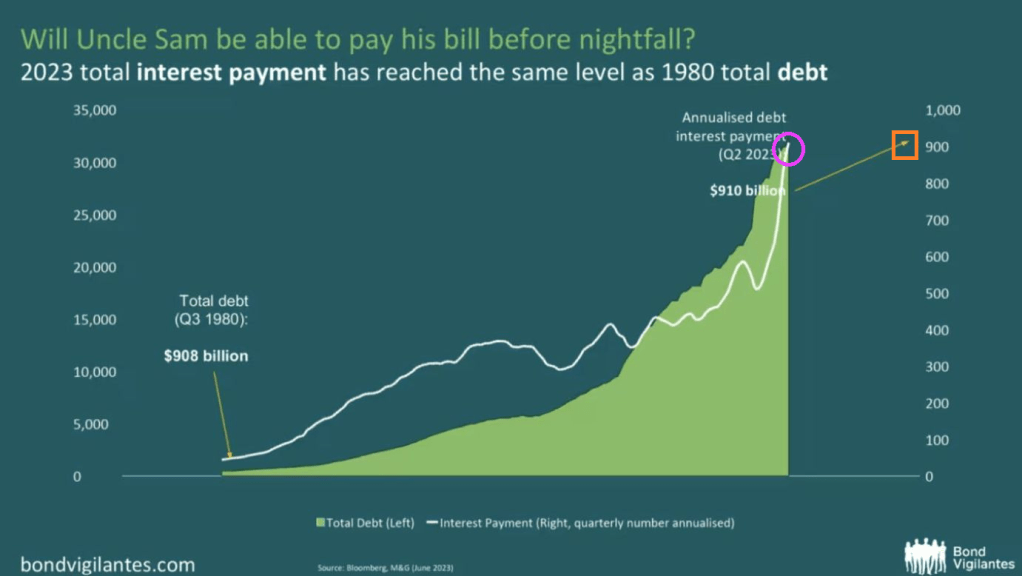
And thanks to Uncle Spam (given how Uncle Sam is destroying the middle class it is now Uncle Spam), 2023 interest payments are the same as the total debt from 1980! Spam, which the Federal government has devolved into, is very high in fat, calories and sodium and low in important nutrients, such as protein, vitamins and minerals.
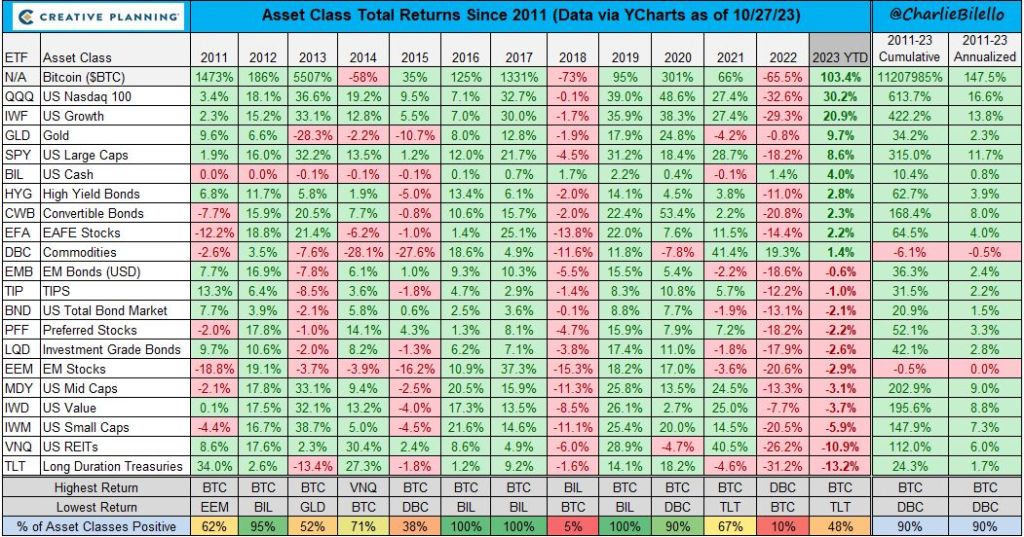
2022 was a bad year for investments under Bidenomics. 2023 year to date is showing huge gains for Bitcoin, the NASDAQ and gold. Bringing up the rear are long duration Treasuries and REITs (real estate investment trusts), both earning negative returns thus far of less than -10%.
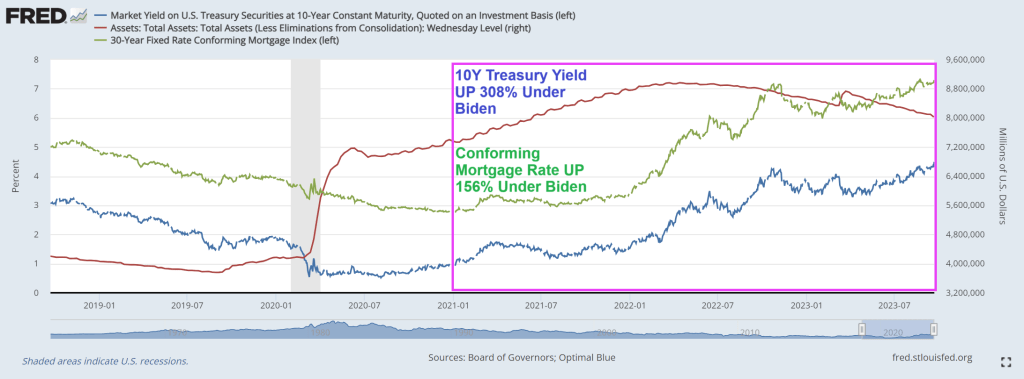
Alarm! US 10-year Treasury yields are soaring along with mortgage rates.
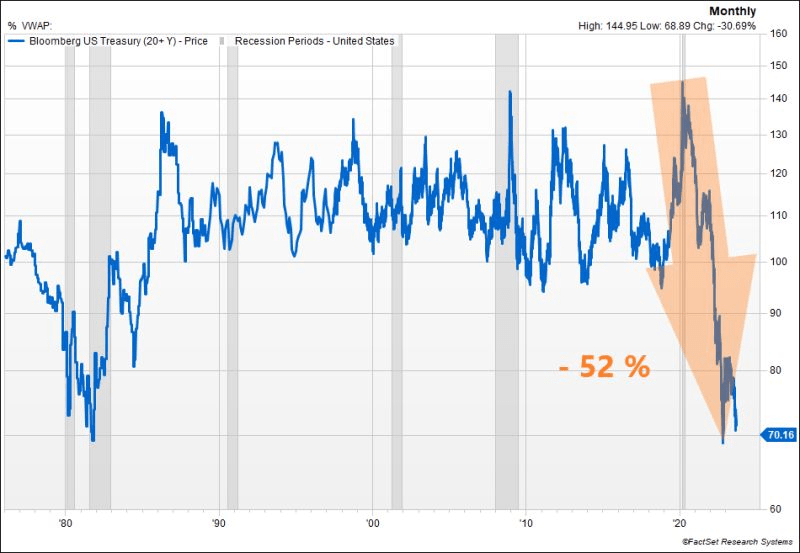
The US Treasury market is witnessing another significant selloff, pushing the 10y UST yield close to the 4.50% mark. The surge in real rates is remarkable, reaching 2.12% for the 10y, a level not seen since 08’. While this might appear attractive in real terms compared to historical benchmarks, could we be on the brink of a third consecutive year of negative performance for US Treasuries? To put this into perspective, such a scenario has never occurred in history.
The conforming mortgage rate is at 7.3%, up 156% under since Biden’s coronation as El Presidente of the United Banana Republics of America. Where political opponents are indicted prior to elections.
In Biden’s Banana Republic economy, the US Treasury 10y-2y yield curve remains inverted.
And then we have Mish’s chart on debt as a percentage of GDP from CBO. Remember, we used to worry about the US breaking the 80% debt to GDP level. It is now projected to be 181%. Wow.
Preliminary benchmark revision smaller than some had projected
Biggest payrolls adjustment in transportation and warehousing
Are you surprised that the Biden Administration has been lying about job creation?? Not really since Biden compulsively lies about everything. Including his corruption.
US job growth was probably less robust in the year through March than previously reported, according to government data released Wednesday.
The number of workers on payrolls will likely be revised down by 306,000 for March of this year, according to the Bureau of Labor Statistics’ preliminary benchmark revision.
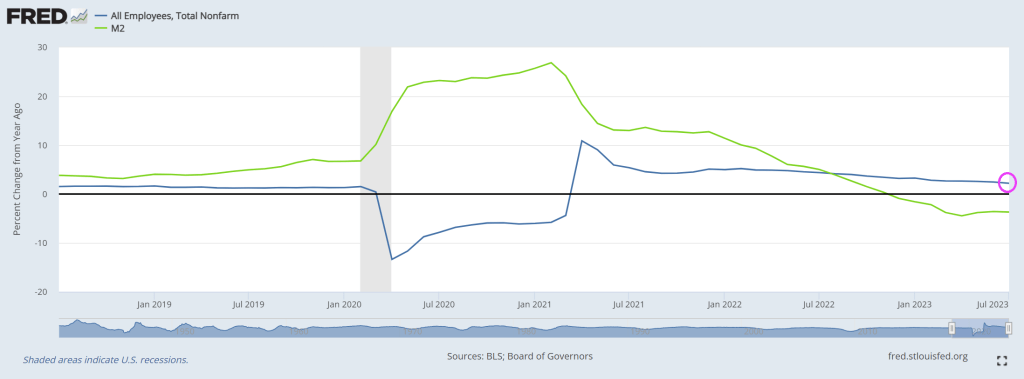
Even without the revision, job growth has slowed to 2.2% YoY in July as M2 Money growth slowed to -3.7% YoY.
Let see what our Overlords say at the Jackson Hole Fed symposium.
Yes, The Fed has a line on you! And will likely keep raising rates as inflation stays elevated. This means higher mortgage rates unless China slips into a deflation doom loop.
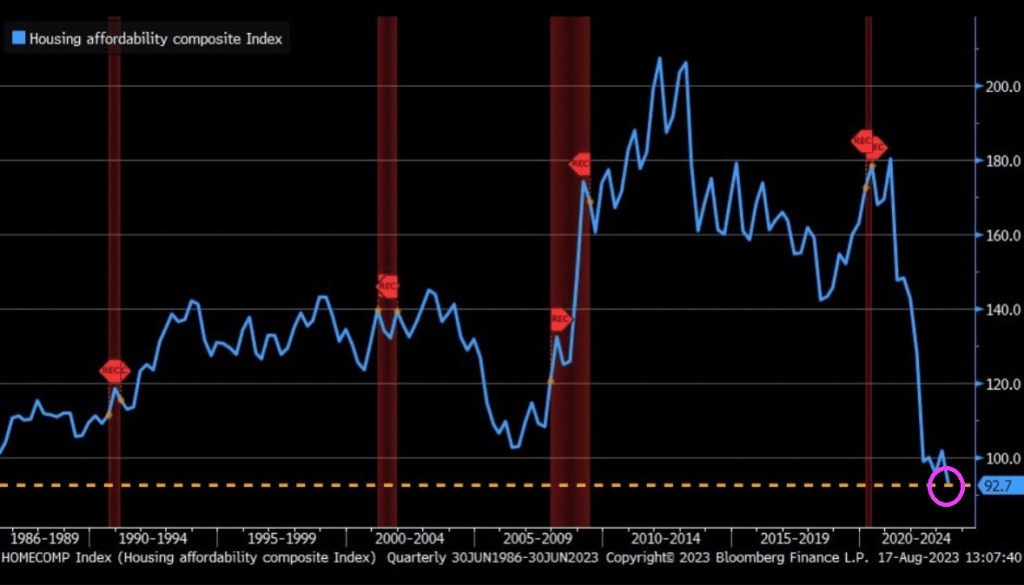
Thanks in part to The Fed, housing affordability is at the lowest level since the 1980s.
And we are seeing tail volatility in the US Treasury futures.
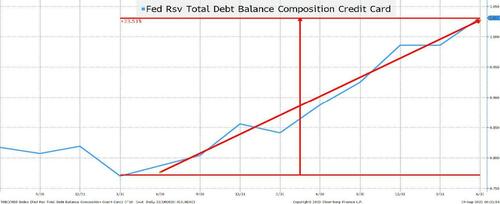
Fastest Ever Rate of Increase in Credit Card Debt!!
Credit card debt has been rising at what seems like an alarming rate. To cope with Bidenflation.
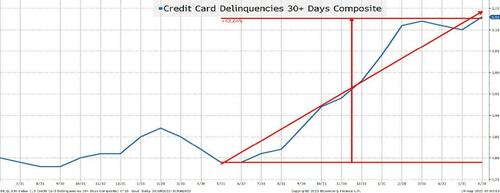
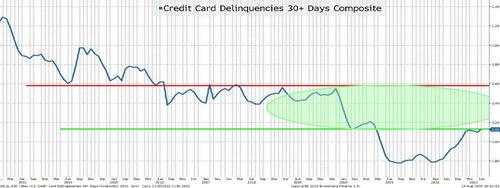
Credit Card Delinquencies Gapping Higher!
This chart seems almost scary because it shows a rapid rise in delinquencies. While not quite “parabolic” it has increased by almost 50% in a little over a year! However, 0.8% to 1.15% seems a lot less scary than saying it has increased by 50% (which is why I tune out whenever anyone talks about credit spread moves in percentage terms).
Not only is credit card debt rising at an alarming rate, it is also coming just as delinquencies spike higher!
The Consumer is Normalizing
Let’s revisit the prior two charts but use a different time horizon.
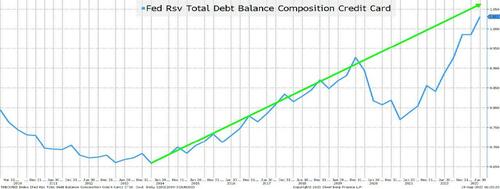
Credit Card Debt Remains Below Trend
Credit card debt rose at a steady pace from 2013 until late 2019. Then COVID, stimulus, work from home, and supply chain issues all seemed to coalesce into an amazing drop in credit card debt. While we can question whether credit card debt should have been rising at the rate that it was before COVID (and whether it was sustainable or not), we should just accept that it was. Maybe population growth has changed (or it was some other factor), but if you “strip out” the COVID phenomenon, we are basically back to trend. I do think that credit card balances are an issue, but it is an issue that we seem to have dealt with in the past.
On credit cards, I completely ignore any impact from Fed hikes because credit card interest rates have always been very high relative to any other rate. What drives credit card balances doesn’t seem to be a thoughtful analysis of rates. It has always been (at least to some degree) about instant gratification.
Bottom line is that while the trend may not be sustainable, the recent rise just brings us back to trend, which takes some of the sting out of the fact that the consumer is in dire trouble.
Delinquencies are Below the 5 and 10-Year Averages!
So, delinquencies aren’t even back to pre-COVID levels. This data series averaged 1.5% for the 5 years prior to April 2020, and was 2.1% for the 10-year period before COVID (and let’s not even think about where it was post GFC).
I’m not all warm and fuzzy about the consumer, but I’m not alarmed either.
Auto Loans
Auto loans are a bit trickier. From the consumer’s point of view, they tend to be at a fixed rate and many were entered into when rates were low. In fact, if memory serves me correctly, the average maturity of auto loans extended in recent years allowing consumers to lock in low rates for longer (hopefully the lenders hedged their rate exposure on those auto loans).
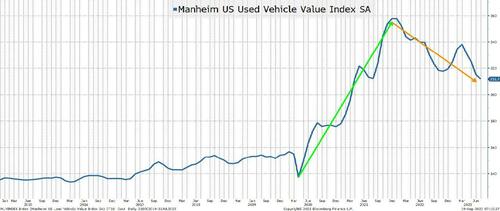
Used Auto Prices are Receding
Used car prices are declining from record highs. That may pose problems to lenders who calculated too much residual value on loans and leases to consumers who thought that we were in a brave new world where even used cars went up in value.
Having said that, the prices for used cars remain robust and my understanding is that it is still extremely difficult to buy the most popular new models (and they often fetch a premium to NAV). Nothing like in the heyday of the supply chain issues, but something that should “normalize” over time.
Auto dealers benefited from a lack of inventory, and I will be curious to see if they can retain their sales with low levels of inventory and (ultimately) pass some of those efficiencies through to the consumer.
With autos being such an important part of the economy, it is something that I watch, but much like the story we heard in credit cards, a lot of the negatives that I’m reading about are simply a “normalization” which may be healthy for generating not just a soft landing, but a sustainable soft landing. However, the “slowing” is something to think about.
The Excess Savings Lie
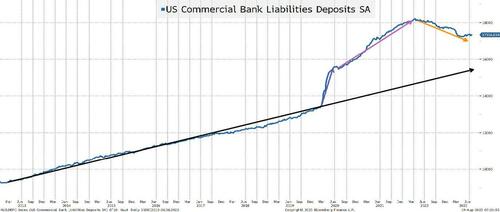
I will spare you the agony of going through bank deposit charts on a short-term and long-term basis and just jump straight to the long-term chart. I used purple and orange arrows because I generally reserve green for good and red for bad and I’m not sure that these are “good” or “bad” deviations from trend.
Bank Deposits are Falling! But to Levels Still Around Trend.
I have argued that the “excess” in bank savings was never going to be put into the stock market (one of the bull cases, which may even still be floating around). I also think that there is a lot more than meets the eye about why there is so much in “excess” savings. Sure, without a doubt, COVID boosted savings. One thing that I “forgot” to mention earlier (or maybe I saved it on purpose) about the good things that happened to consumers during COVID is that there were many moratoriums placed on various types of debt service (i.e., student loans).
We can all agree that some amount of cash stayed in savings accounts because while savings accounts earned 0%, so did everything else. As people realized that they could earn more on their money market funds, some amount was going to be taken out of savings accounts paying little interest. Though, I do have to say that I was at the local bank branch a few weeks ago taking out money from the ATM and someone before me had left a receipt showing $99k in their bank account. I immediately thought “who does that?”, but there are obviously people who want bank accounts up to the FDIC limit.
My view has been (and will continue to be) that many people “earmarked” money that they would have to pay in the future and set it aside in a savings account. If you know moratoriums will end (and let’s not forget, these loans typically accrued interest during these periods), then it would be prudent to set aside some money for when those payments got turned back on.
If my theory is correct, you should see bank deposits decline faster as these moratoriums end and the money that was “earmarked” for certain payments is withdrawn to make those payments. Please see American Ingenuity. Not great for the economy or spending, but is “normalization” really bad?
Generative AI
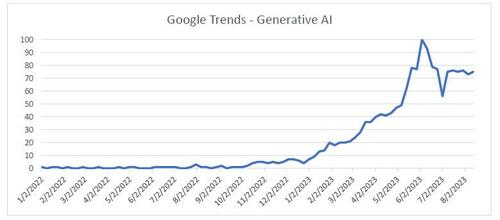
My intention is to use generative AI to help me do a report on “outliers”. This would include warning signs or positive things that the market may or may not be missing. After about an hour or so of brutally failed attempts this weekend, I gave up. I try to write these T-Reports with an estimate of how long it will take and how long the report will be but had absolutely zero clarity on whether the ChatGPT process would work. Hopefully I can make some interesting progress on the report early this week or I will declare it a failure. In any case, was Google trends (using generative AI) all you needed to buy or sell stocks successfully this year?
No one really cared about AI until February of this year. Yes, there were some searches, but very few. The Nasdaq 100 bounced in January, stagnated for a bit, and then started to do well from April until late July. It has sold off steadily since then. While not matching the trends in “generative AI” search, it might have been the best tool to use. The searches have stabilized and what will be interesting to see is if they peaked or if they increase as we end the summer and people are back at work fulltime across the board.
We will be focusing more on AI as Academy’s Advisory Board has grown the number of advisors with significant experience in the area and who are active today in the ongoing development of cyber and AI.
China
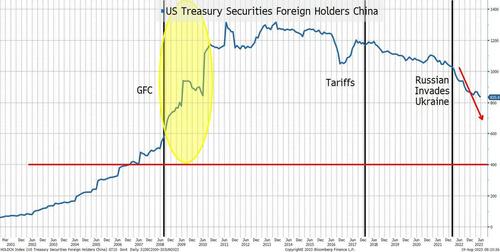
I promised that we’d get back to China, but for now I only want to highlight one chart. And, ironically, it is not a lie. It is the truth, and it is logical.
China’s Holdings of U.S. Treasuries
I highlight three periods.
Post GFC. When the U.S. economy was in tatters and much of the world was struggling, China was able to (or was willing to) accumulate more and more Treasuries. There is a lot of chatter about the decoupling of our economy from China’s right now, which is logical and will continue (the friction is real between the two nations and not getting better). I did, however, find it interesting that China accumulated so many Treasuries in the aftermath of the GFC. Prior to the GFC, the trend seemed obvious (U.S. was growing and buying stuff from China).
The tariffs sparked some discussion of potential retaliation from China, including the possibility that they would dump Treasuries. There was some decline in their holdings, but that could just as easily have been COVID related.
Since the Russian invasion of Ukraine and the decision to freeze Russia’s dollar holdings, there has been a steady decline in China’s Treasury holdings.
Some of the decline is due to the weakness in China’s economy and their potential need to prop up the property market (and maybe even those overly exposed to the “shadow banking system”).
Not only did we freeze Russia’s holdings (which tells me that we can do it again), but we have also been going after China on a myriad of fronts (most notably high tech, but increasingly for rare earths and critical minerals).
Our own debt ceiling issues and ratings may not help, but I’d be shocked if that entered into China’s calculus.
What I cannot tell from this chart is if it is an indication that China is successfully generating trade globally in yuan and has less need for dollars. That would fit my “shifting from made in China to made by China” view to a tee, but I’d be lying if I said that I could support that on this chart! Maybe generative AI will help me find evidence supporting that theory in places that I haven’t thought to look.
One thing that I think supports Treasury market bears is that there will be less of a global interest in holding Treasuries (with China leading the way).
Jobs
So much to do here and with or without AI, I will add more charts related to jobs later this week.
We have covered some of these areas in the past such as discrepancies in JOLTS between job openings and hires and the Establishment versus Household gaps. The fact that all these reports come in with declining response rates is another issue. It is difficult (mathematically) to accept the continuity of a data series when the response rate is declining without a serious investigation into why the response rate might be declining.
While we haven’t discussed it recently, the annual revisions always seem to dramatically reduce the published data for the prior year (but weirdly it doesn’t seem to have a market impact).
Today, I just bring up one chart because I find it fascinating in the lies, damned lies, and statistics theme.
The “Almost” Unbelievable Pattern of New Company Formation
The birth/death model is an estimate of jobs created or lost as new companies are formed or go out of business (or at least close enough for our purposes).
I challenge you to find any other jobs data that looks this “perfect”. It is a beautiful sawtooth pattern that looks almost uninterrupted! For most jobs data, the COVID period makes long-term charts almost impossible to review. The job losses and subsequent job gains are so large relative to any prior periods (or current periods) that these charts look like straight lines on either side of COVID.
Yet this chart seems almost perfect. This is a symmetrical “beauty”, but it is just a “plug”. It is something that clearly relies heavily on seasonality and I find it almost impossible to believe that this is so “predictable” (which makes me wonder how many other “plugs” or adjustments might be meaningless after the COVID shock). Meaningless, but this data is still used to determine policy and drive markets.
Inflation
I couldn’t be bothered. Sure, I will dig into this more, but I really don’t think that despite some Fed jawboning, anything (other than a large/sustained change in inflation) will do much to the Fed’s decision (which means that it will do little for bond markets). I am prepared to be wrong on this and will delve into it this week (with help hopefully from friends at ChatGPT), but inflation is low on my radar screen. However, there is one exception – will companies be able to grow earnings in the current inflation environment where it seems to be more difficult to push through final product price increases while input costs remain elevated?
Bottom Line
Seems like we are back to an “inflection” point where the debate between soft landing and “something less fun” is back on the table. The lag effect is regaining credibility (it always should have).
There are cases to be made for a variety of economic outcomes as we head into September and that is exciting from my seat!
I do think that we are in a period where price action drives what narratives we see: continued downward pressure on stocks will bring out more and more negative reports. One more short squeeze and suddenly AI, soft landing, and praise for Powell is all that we will see.
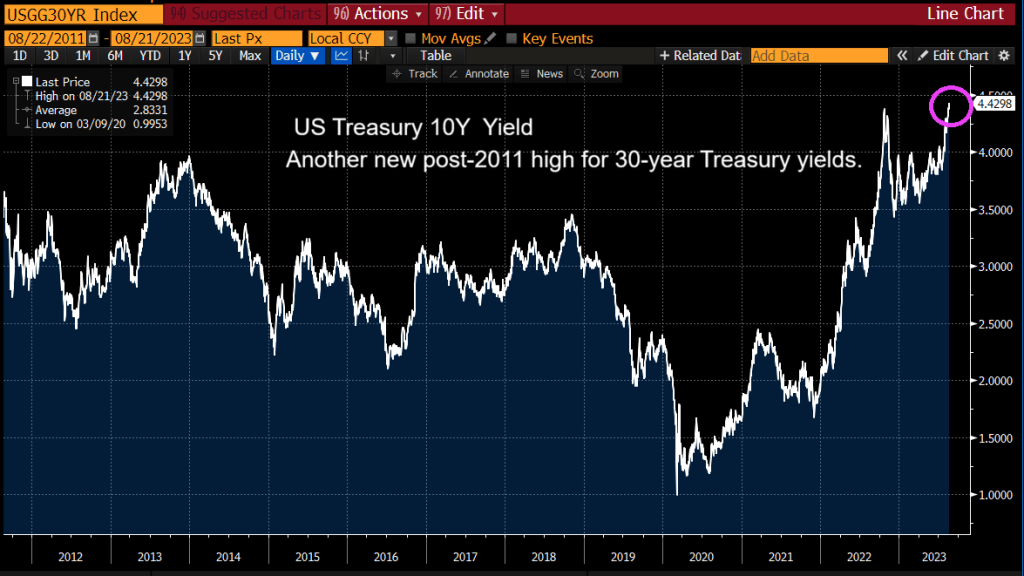
The US Treasury 10Y yield is now the highest post 2011 singaling further Fed rate increases.
Between The Federal Reserve’s outrageous overreaction to Covid (printing like there was no tomorrow), and Biden’s massive spending spree (lots of moldy (green) spending, we have see horrid inflation.
And The Fed trying (sort of) to combat inflation, we see that 30-year CONFORMING mortgage rate for 80% LTV or lower credit borrowers is up 163.5% under Bidenomics.
Under Bidenomics, public debt (owed by the US Treasury) is up 19% or greater than $5 triillion. Now wonder Biden throws are billions like it is water.
I seriously want the Biden Administration (and almost every member of Congress) why we are sending billions of dollars to Ukraine while barely giving Maui fire victims barely anything. The US is already $33 trillion in debt with >$193 trillion in unfunded liabilites. I want to ask Biden and Congress HOW the US is going to afford $193 trillion in unfunded liabilites?
Of course, NO ONE wants to face the reality of the disastrous fiscal poliicies of Washington DC politicians. Not McConnell, not McCarthy, not Schumer and especially not Billions Biden. Remember 10% for The Big Guy where Democrats argue that is meaningless. Or mini-me, Robert Reich (Clinton’s labor secretary) who claimed that the US economy is the best he has ever seen! Yes, Reich, for the top 1%. Of couse, no one will ask fools like Reich how we will pay for $33 trillion in debt and the $193 trillion in unfunded liabilies … and fund a war in Ukreiane in seeming perpetuity.
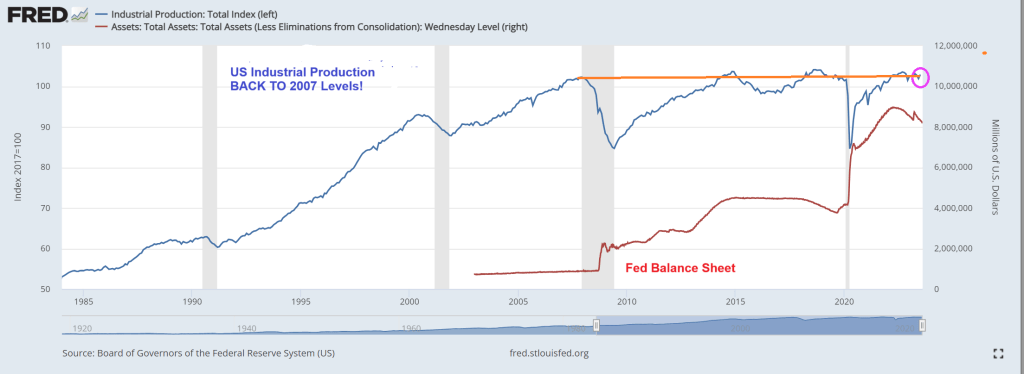
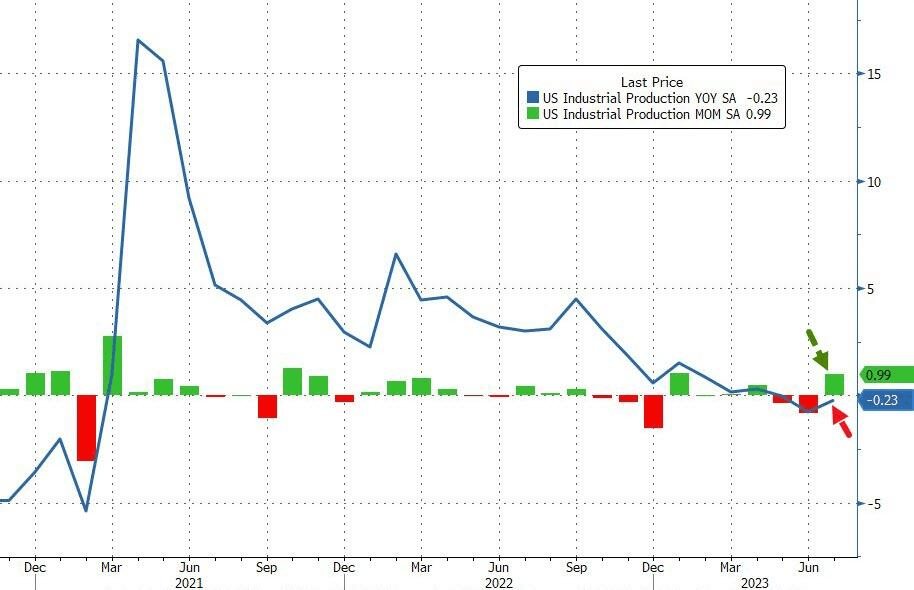
Well, its now August 2023 and US Industrial Production for July increased … to 2007 levels. This comes after the massive spending out of Washington DC and massive Federal Rerserve stimulus.
Is that all there is??
US Industrial Production is DOWN -0.23% YoY while up slightly in MoM terms.
As I said a couple of days ago, the Obama/Biden economic model is a Soviet/Chinese Communist Party (CCP) style of COMMAND economics, not free market DEMAND economics.


You must be logged in to post a comment.