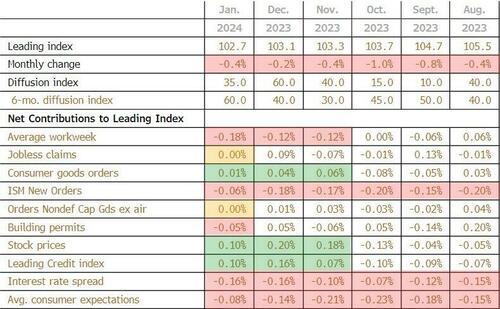
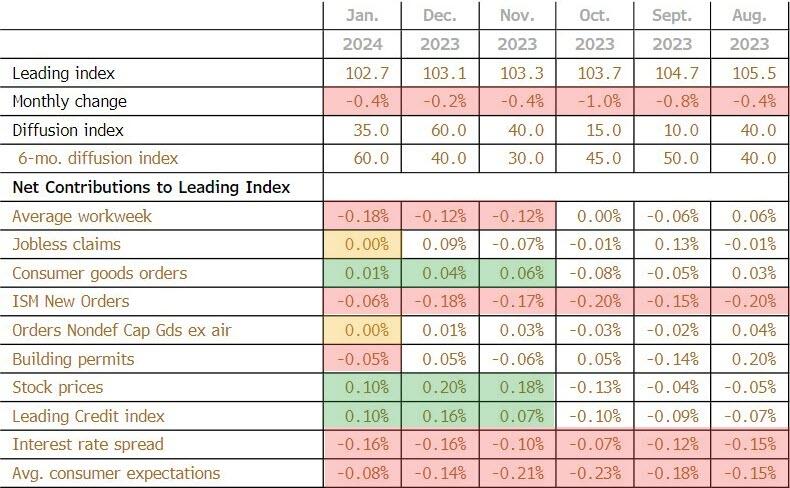
The biggest positive contributor to the leading index was stock prices (again)at +0.10
The biggest negative contributor was average workweek at -0.18
This is the 22nd straight MoM decline in the LEI (and 23rd month of 25) – equaling the longest streak of declines since ‘Lehman’ (22 straight months of declines from June 2007 to April 2008)
“While the declining LEI continues to signal headwinds to economic activity, for the first time in the past two years, six out of its ten components were positive contributors over the past six-month period (ending in January 2024).
As a result, the leading index currently does not signal recession ahead.
While no longer forecasting a recession in 2024, we do expect real GDP growth to slow to near zero percent over Q2 and Q3.”
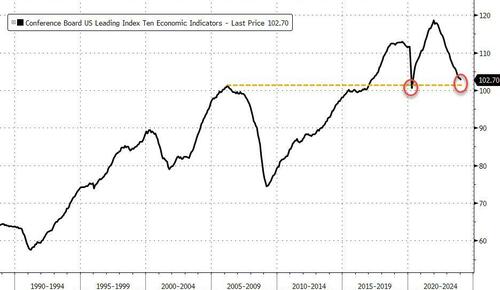
While the Conference Board seems optimistic, we are struggling to see any signs of hope! tumbling back below the peak in March 2006…
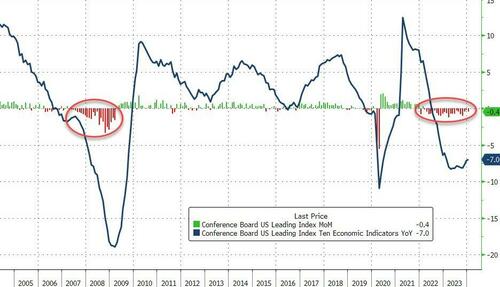
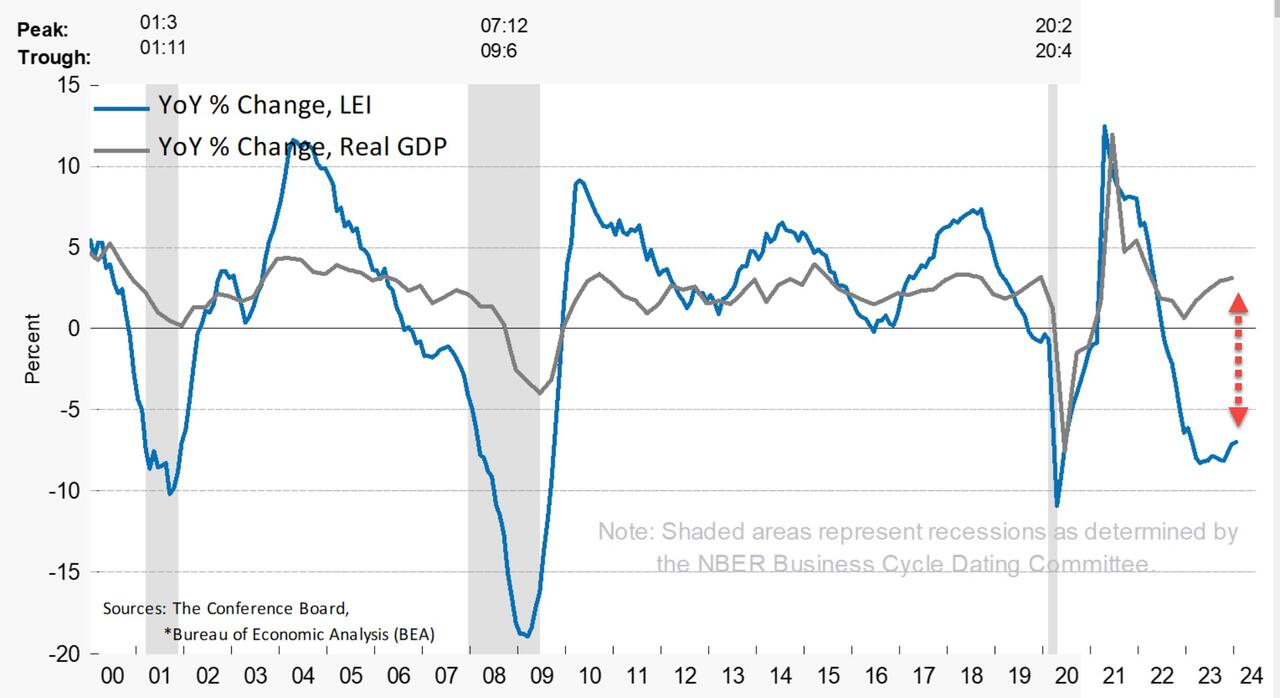
And on a year-over-year basis, the LEI is down 7.0% (down YoY for 19 straight months) – still close to its biggest YoY drop since 2008 (Lehman) outside of the COVID lockdown-enforced collapse (but starting to inflect)…
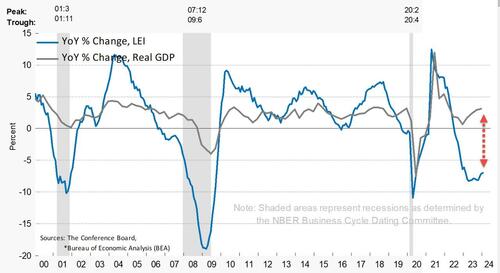
The annual growth rate of the LEI remains deeply negative and decoupled from Real GDP…..
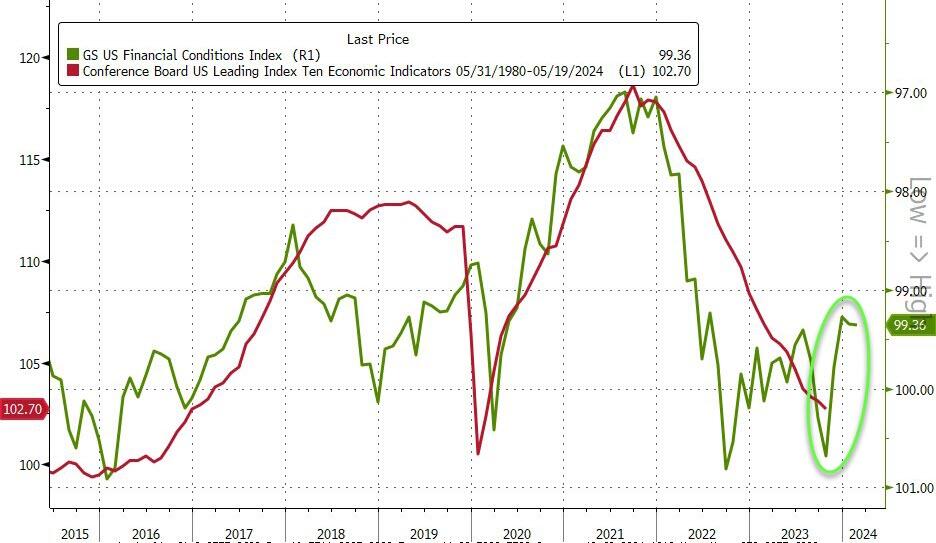
Finally, the massive easing of financial conditions in the last few months suggests a turn in LEI is imminent…
And hence the ‘soft landing’ mission is accomplished… so no need for rate-cuts? (Except for the banking crisis that looms in March).
I watched Tucker Carlson’s interview with Russian President Vladimir Putin. Putin is an amazing contrast to our 81-year old President with dementia who can barely speak while Putin was articulate. Not at all what Hillary Clinton was raving about (she is still furious about losing to Trump after losing to Obama). One thing that caught my attention was Putin talking about The Fed’s endless printing of money. Well, THAT is how the US grows GDP these days. Borrow and spend with the private sector as an after thought.
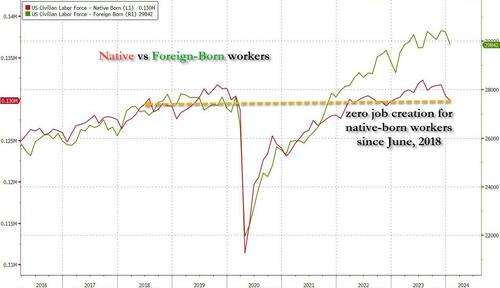
Let’s revisit the HORRIBLE jobs report from December. Not only were all job gains in the past year entirely thanks to part-time workers, but native-born workers plunged by a another whopping 560 thousand, bringing the two-month total drop to just under 2 million.This meant that not only has all job creation in the past 4 years been exclusively for foreign-born workers, but there has been zero job-creation for native-born American workers since July 2018 (don’t believe us? go ahead and check the data directly from the Fed).
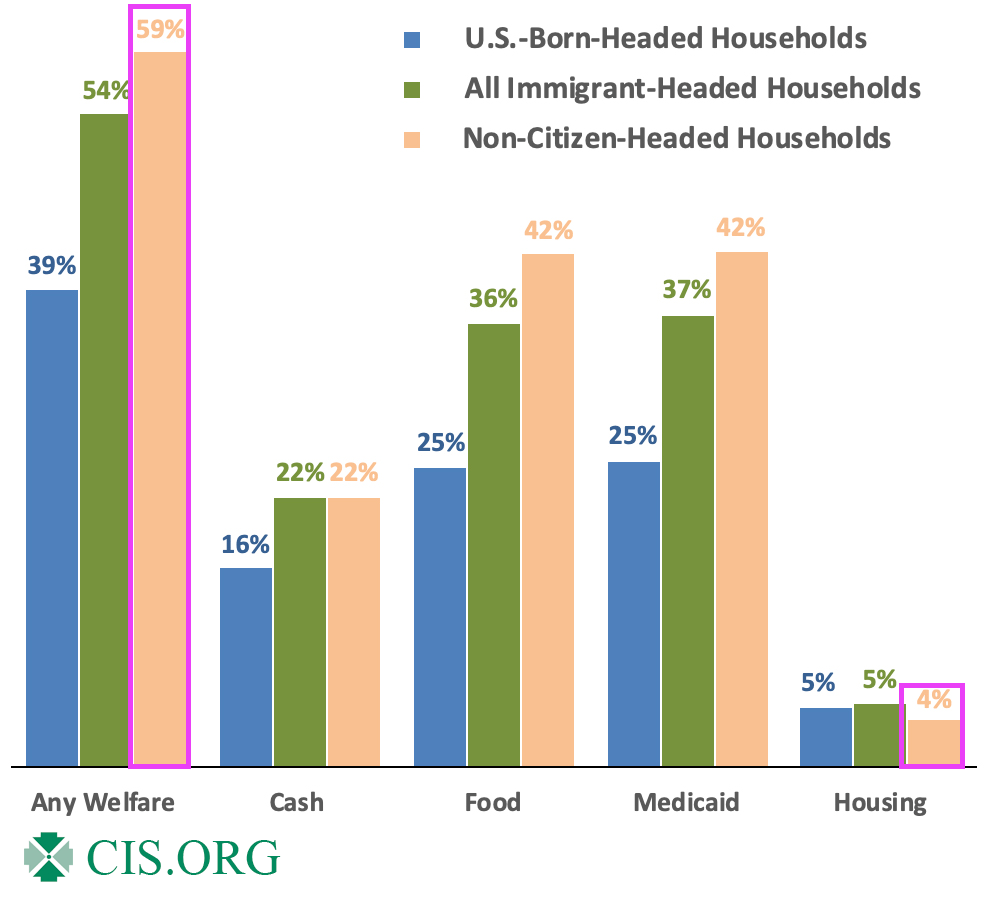
So, the Federal government is borrowing trillions of dollars so that 1) part-time jobs are created and 2) foreign born workers have jobs, but not native born Americans?? (Blogger Paul Krugman thinks that immigration will add $7 trillion in real GDP over the next 10 years and this will save Social Security and Medicare. Huh? I admit, millions of immigrants will spend money, but many will be on the Federal and State doles, so its tax dollars going to immigrants to spend.) This seems like Obama/Biden are using Cloward-Piven tactics to overwhelm Social Security, Medicare and other social services, NOT grow the economy as Krugman projects.
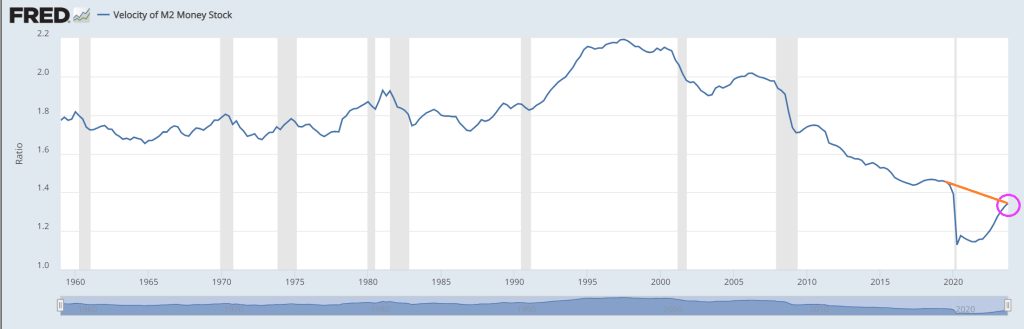
Typically, economists look at measures like M2 Money Velocity (Real GDP/M2). M2 Money Velocity is rising … but still remains below where it was pre-Covid under Donald Trump.
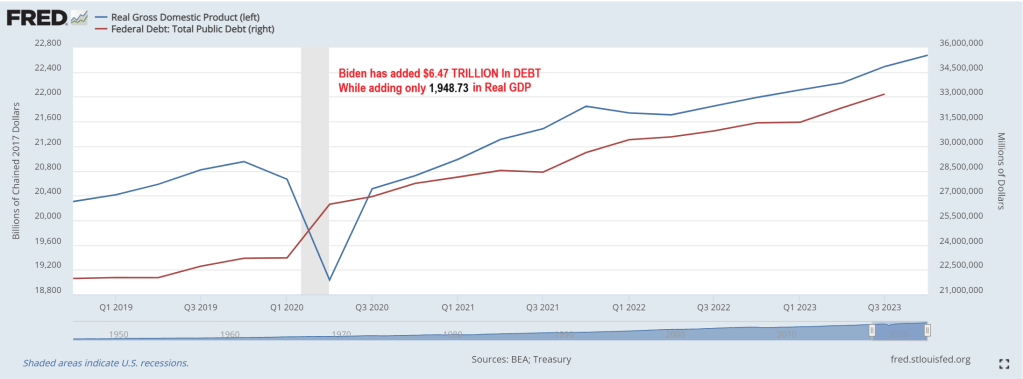
But a more relevant velocity is the velocity of DEBT. As in GDP/Debt. Under Biden, the US has added almost $6.5 TRILLION in debt while real GDP has risen by only $1.949 trillion. That amounts to a DEBT velocity of 0.30. Meaning that the US gets an anemic $30 in real GDP for every $100 in additional Federal debt.
Yes, the US economy is broken and requires endless money printing and debt financing to pay for endless wars and now millions of illegal immigrants getting on “the dole.” Then we have Biden’s forgiving student loan debt (inappropriately) and now Big Tech wants $7 trillion to develop AI (in a normal economy, tech companies would develop AI themselves, but under Obama/Biden, we are not in a normal economy).
Here is Daddy (Ukraine) Warbucks Biden with his biting dog and daughter Ashey.
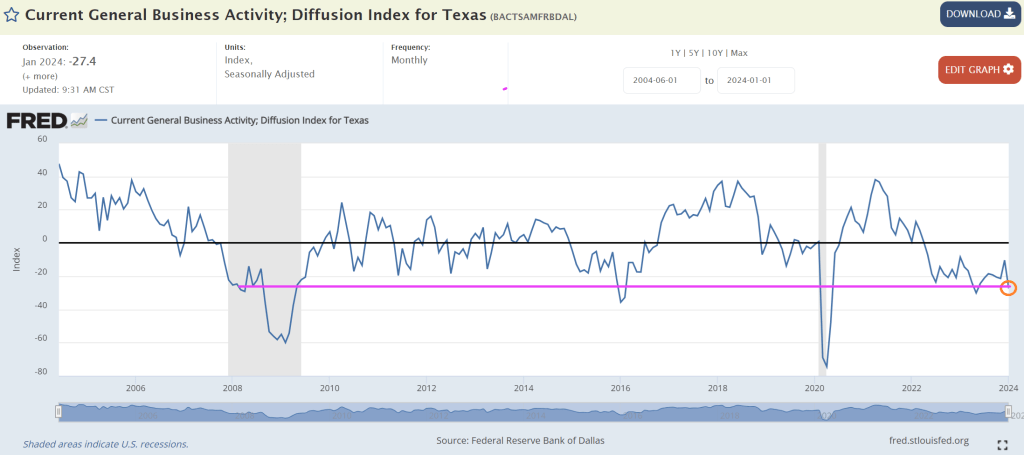
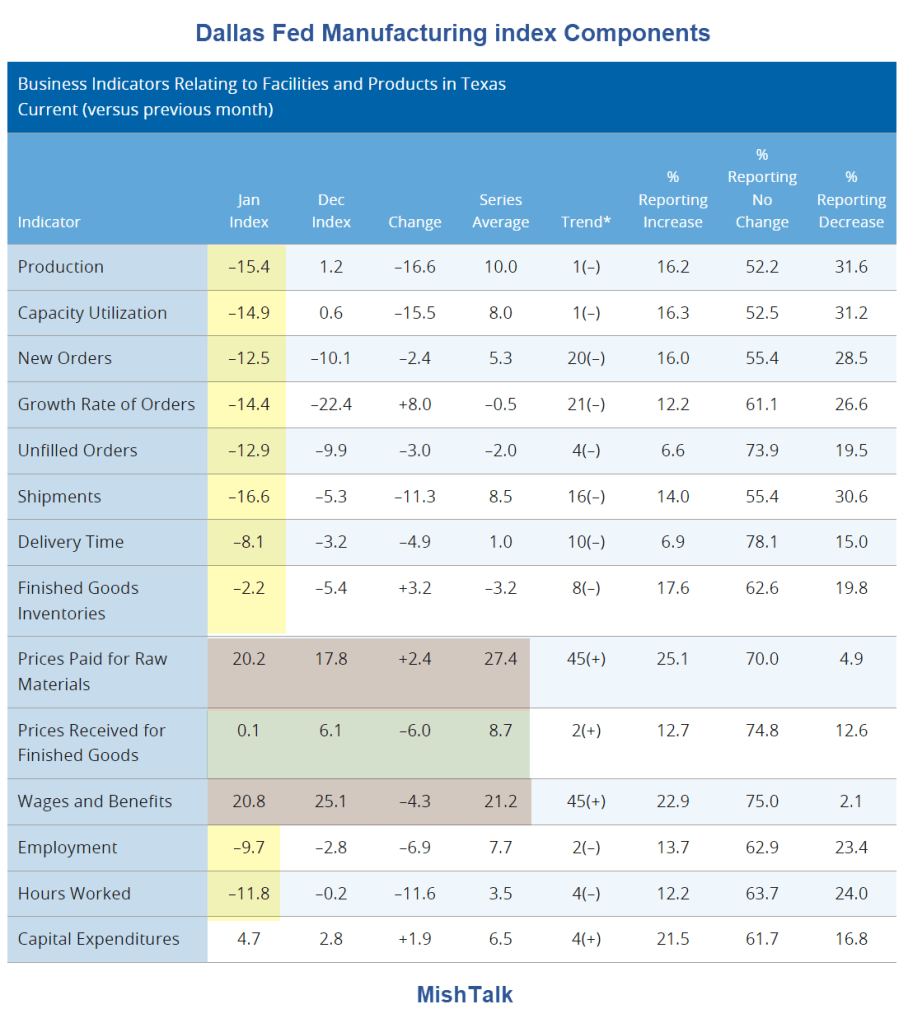
Other measures of manufacturing activity also indicated contraction this month. The new orders index ticked down from -10.1 to -12.5 in January, while the growth rate of orders index remained negative but pushed up eight points to -14.4. The capacity utilization index dropped to a multiyear low of -14.9, and the shipments index slipped 11 points to -16.6.
Perceptions of broader business conditions continued to worsen in January. The general business activity index fell from -10.4 to -27.4, and the company outlook index fell from -9.4 to -18.2. The outlook uncertainty index held fairly steady at 20.9.
Note that prices paid for raw materials soared by 20.2%.
Meanwhile, The Fed is impressed by the growth in the economy (primarily government jobs) so will likely keep rates constant this week. I wish they would look at Texas slumping!
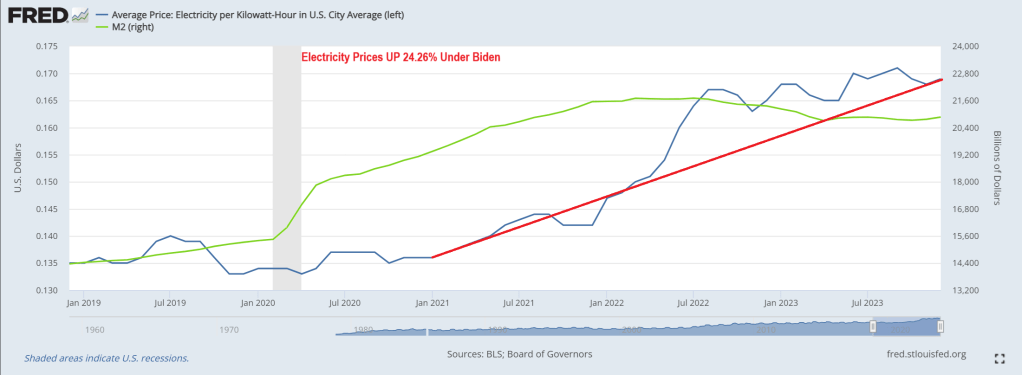
The average price of electricity has risen a whopping 24.25% under Biden and Bidenomics. Brrr!!
No wonder Biden only wants to talk about unlimited abortion and NOT the immigration (Fentanyl, child trafficing, crime, etc) fiasco at the border and continually rising prices. Or Biden’s growing wars.
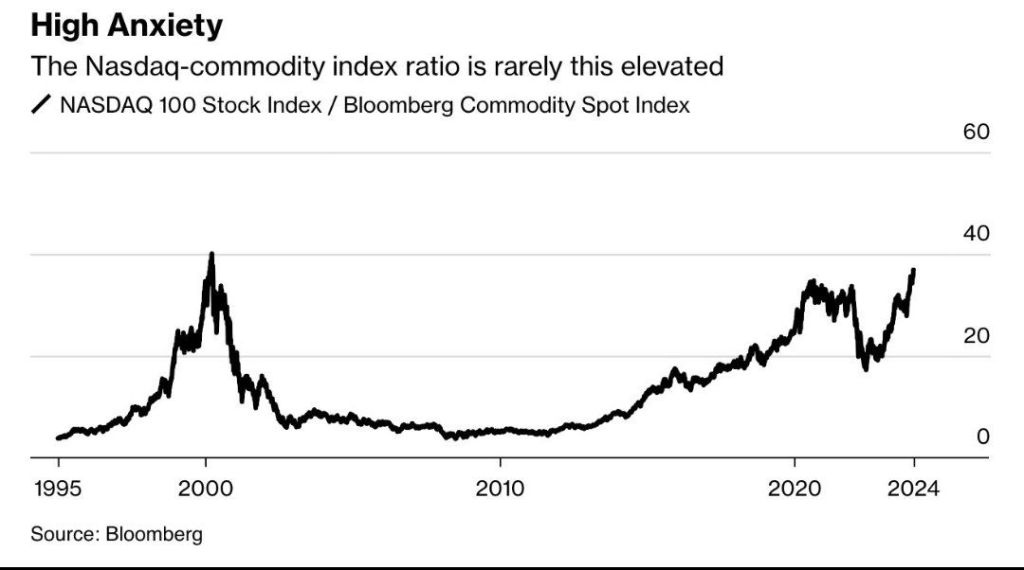
The NASDAQ commodity index RATIO is getting back to dot.com era bubble levels.
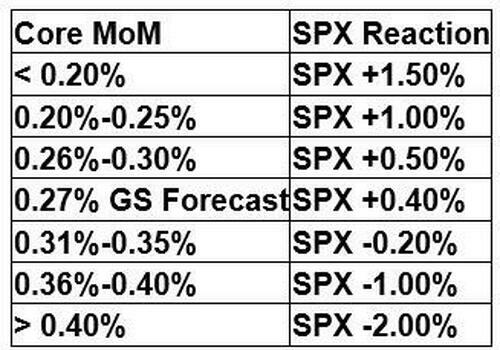
And, as Nomura’s Charlie McElligott highlights this morning, we are also seeing new upside being bot in SOFR Options for “dovish outcome”-hedging again, with Core PCE looming later this week.The market has had bunches of March SOFR Downside structures trading over the past few weeks to play for “Fed cut overshoot,” which has been the right trade YTD, as the implied probability distribution shows March Fed cuts now having been slashed by over half the the past week and a half (~80% priced to now just ~40%), and accordingly now we’ve witnessed some monetization of tactical Downside in recent days…
And we see the swaption surface getting mushed…
As he notes, the “dovish-trifecta” right-tail repricing has gotten us to ~4900… and, he says, the actual “realization” could then certainly push us through 5000:It’s my expectations that we could very well see:1) “March Fed cut” to pick-up Delta again after what is expected to be a “light” core PCE print this Friday…and taking back pricing following the past week’s Fed speak pushback and “too resilient” Labor- and Consumer- data, which has driven March Fed meeting “cut” probabilities being sliced in half over the past one week (~80% on 1/12/24 to today’s ~40%)The next potential dovish catalyst is 2) the QRA est / announcement end of Jan / start Feb, with “binary risk” implications on the direction of Duration and Risk-Assets, as the market generally anticipates resumption of larger Coupon issuance from the US Treasury ahead—but what if there is one final announcement where Bills stay high, Coupon increases but isn’t as large as most anticipate, AND Yellen signals that this is the final expected Coupon increase?!
While we’re at it and relate to the Treasury’s QRA discussion, let’s not forget the “other” market- and economic- backstop being applied by the Biden Administration (and aided by what looks to be Janet Yellen’s “politically activist” US Treasury with TBAC sign-off) – which is the continued willingness to run large fiscal deficits in an attempt to “run the economy hot” in this election year, with much of it being “paid for” via Bills (so to prevent long-end Rates from pushing higher, which would tighten US financial conditions)……this is Green build, CHIPS Act, and even fresh “election surprises” like Biden announcement Friday on “forgiveness” of a fresh $5B of student loans, now making the total loan forgiveness approved by the Biden admin $136.6B
And finally as a derivative of the above mention, another hypothetical Treasury QRA where we’d see “Bill issuance remaining high, yet with Coupon increases not as large as most anticipate” would then mechnically see MMF’s continuing pulling from RRP to buy Bills, which will further accelerate the RRP drain…and as outlined in recent weeks, “low” RRP levels will act as “a” key input to Fed reaction function on determining LCLoR……which will ultimately mean 3) a pulling-forward on the market’s expected timing on the “end of QT”
This “dovish-trifecta” is the macro catalyst behind the “right-tail” scenario which has appropriately been repriced higher by the market over the course of the past month, and we’ve seen clients allocate some protection spend to this “crash-UP” scenarioAnd again, IF the above were to realize… without negative catalysts (Earnings fine, no further Rates selloff / Fed repricing, continued disinflationary trajectory rebuilds “Fed cut” implied probability) around that upcoming Feb VIXpery with all that Dealer “short VIX Calls” positioning being hedged… there is absolutely potential for an Equities slingshot if there are no issues and those customer “Long VIX Calls” bleed-out, which will mean Dealers puke out their UX1 Longs (as hedges) back into the market for a potential “kicker” to goose Spot Equities even higher…For now, no-one is worried about downside based on VVIX being back near post-COVID lows…
So what then is the largest DOWNSIDE RISK to Equities?
Outside of “Mag 7” guidance disappointments, I believe the next worst-case scenario for current positioning in Stocks would be an “Animal Spirits” US data reacceleration which forces the above “dovish trifecta” off-course and blows-out the recently calming “Fed Rates path” distribution again:Why would resumption of better US growth data negatively impact US Equities consensus thematic / singles positioning?Because after the 4Q23 de-grossing of short books and forced “Net-up” to stop the bleed and chase (massive squeeze & cover in low quality / cyclical value / leveraged balance sheet / high short interest “junk”)….2024 YTD has instead seen the market reset the prior “Momentum” regime of “Long Quality / Size / Secular Growth” i.e. MegaCap Tech, while re-shorting that economically-sensitive “low quality / junk” stuff againIn a world of slowing but positive growth to 2% GDP and now with 3m inflation annualizing sub 2% target…you go back to that “QE of old” 2010s -decade playbook of “long stuff that can grow earnings and profits without needing a hot economic cycle”…i.e. long quality, size (liquid) & secular growth / short leverage & cyclical valueBut IF we see the “animal spirits” data reacceleration off the back of the massive FCI easing that the Fed and Treasury have facilitated, plus the persistent wage growth and still too strong labor meaning consumption remains robust, along with ongoing govt fiscal stim / spending…
.
..we risk a chance of inflation pivoting away from the current disinflationary trajectory(God-forbid actual “reflation”) which would could see that “long secular growth / short econ sensitive / cyclical value’ trade get a shock reversal…
…as long-end Yields and accordingly then, financial conditions, re-tighten and smash the “high valuation” Quality / Secular Growth stuff, while the heavily hated / shorted Cyclicals would painfully squeeze higher.Don’t forget, we’ve seen that happen before (yes we know the magnitudes of the inflationary impulse are different, but the timing of the human-emotion/monetary-policy-over-confidence double-rip in inflation is unquestionable)…
So, be careful what you wish for from higher and higher all-time-highs for stocks – the stronger they look (on the back of dovish expectations), the more likely The Fed is to hold back the actual dovish actions so much hope is founded on.
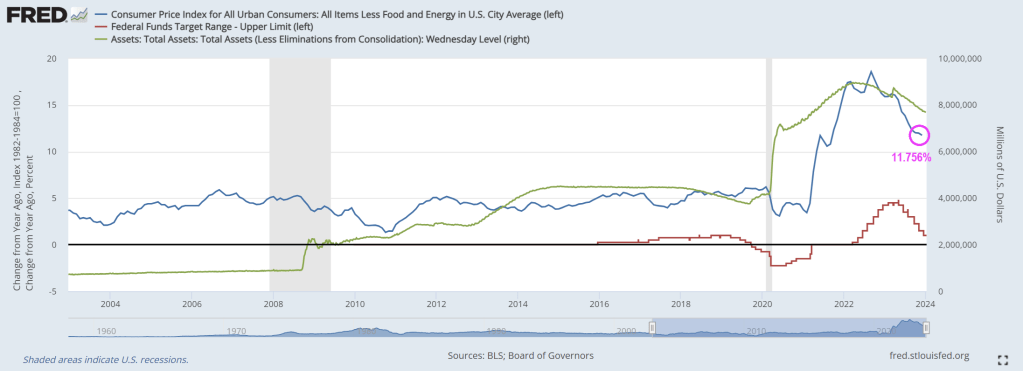
Although core inflation declined in December (CPI all items less food and energy), it is still hot, hot, hot at 4% Year-over-year (YoY). This raises the following question: Is The Fed tightening too much? Aka, yet another Fed policy error?? Since The Fed target rate is 5.50% and core inflation is now 4%?
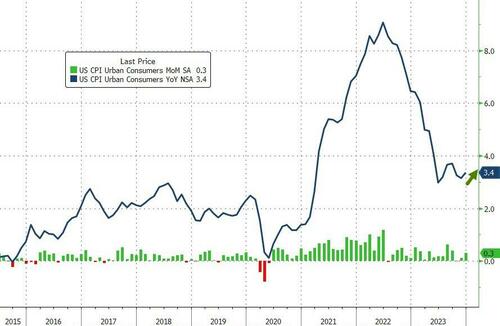
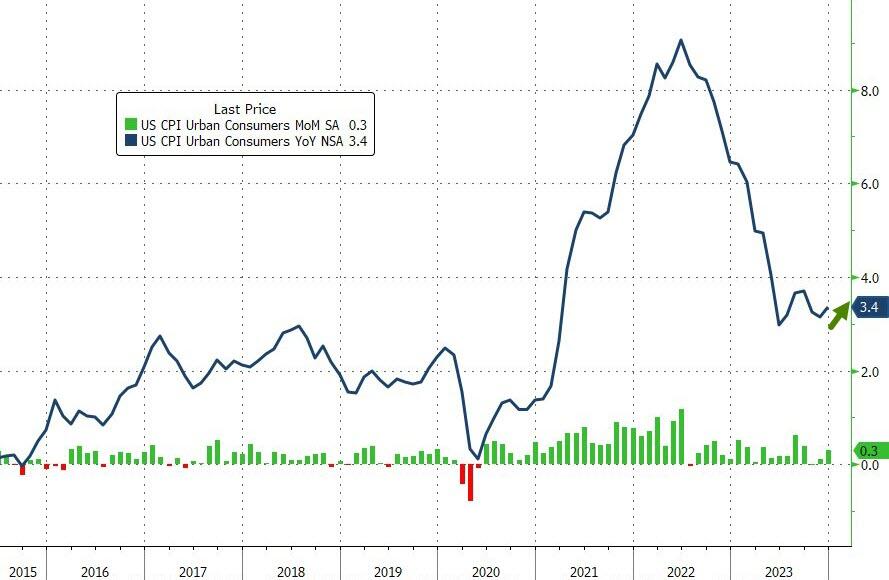
Headline Consumer Price Inflation printed hotter than expected in December, +0.3% MoM vs +0.2% exp and +0.1% prior, pushing the YoY headline CPI up to +3.4% (from +3.1% prior and hotter than the +3.2% exp)…
Source: Bloomberg
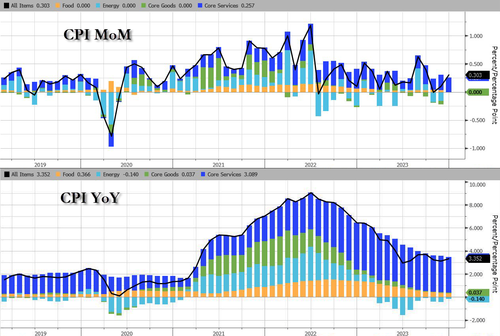
Services (Shelter mostly) costs re-accelerated and energy deflation stalled in December…
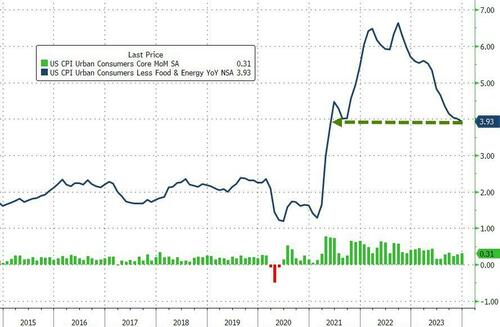
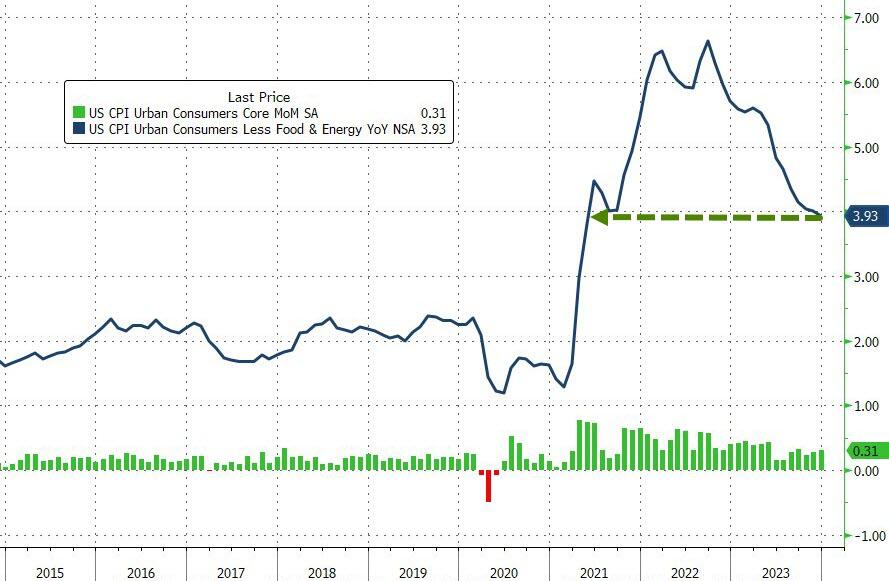
On the brighter side, core CPI according to the BLS rose 0.3% MoM as expected, dropping the YoY change below 4.00% for the first time since May 2021…
Source: Bloomberg
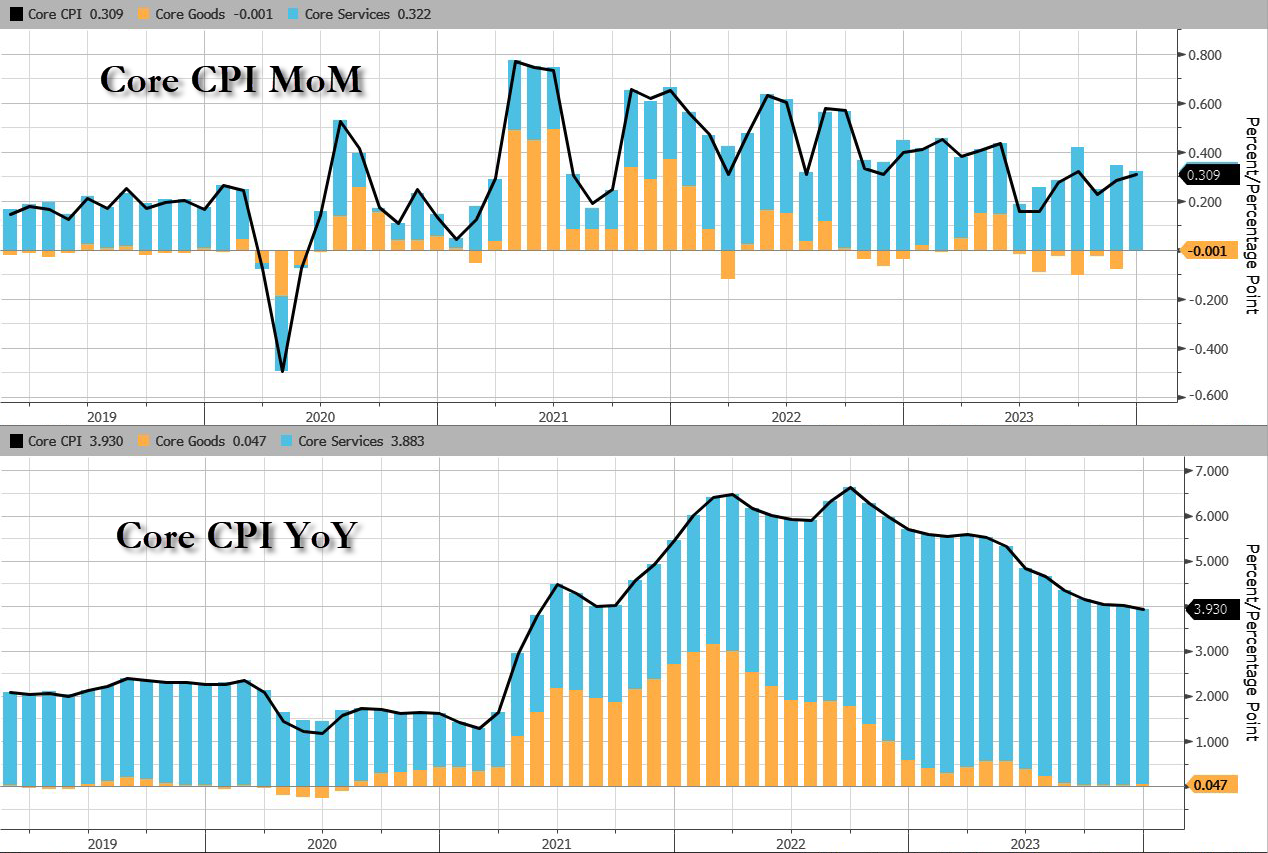
Goods deflation has stalled as the used cars and trucks index rose 0.5 percent over the month, after rising 1.6 percent in November.
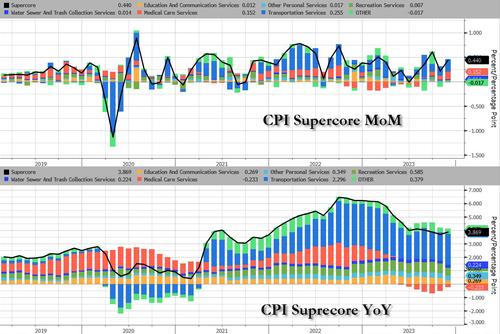
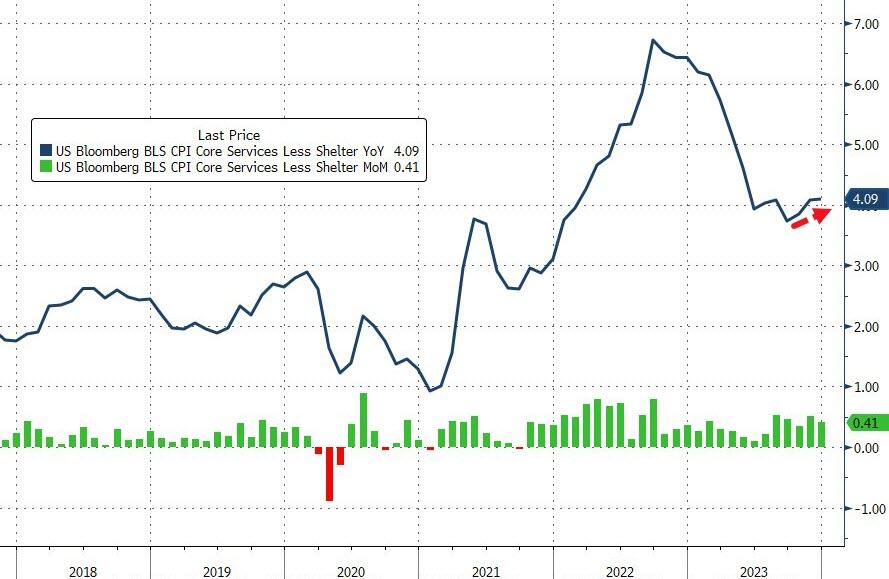
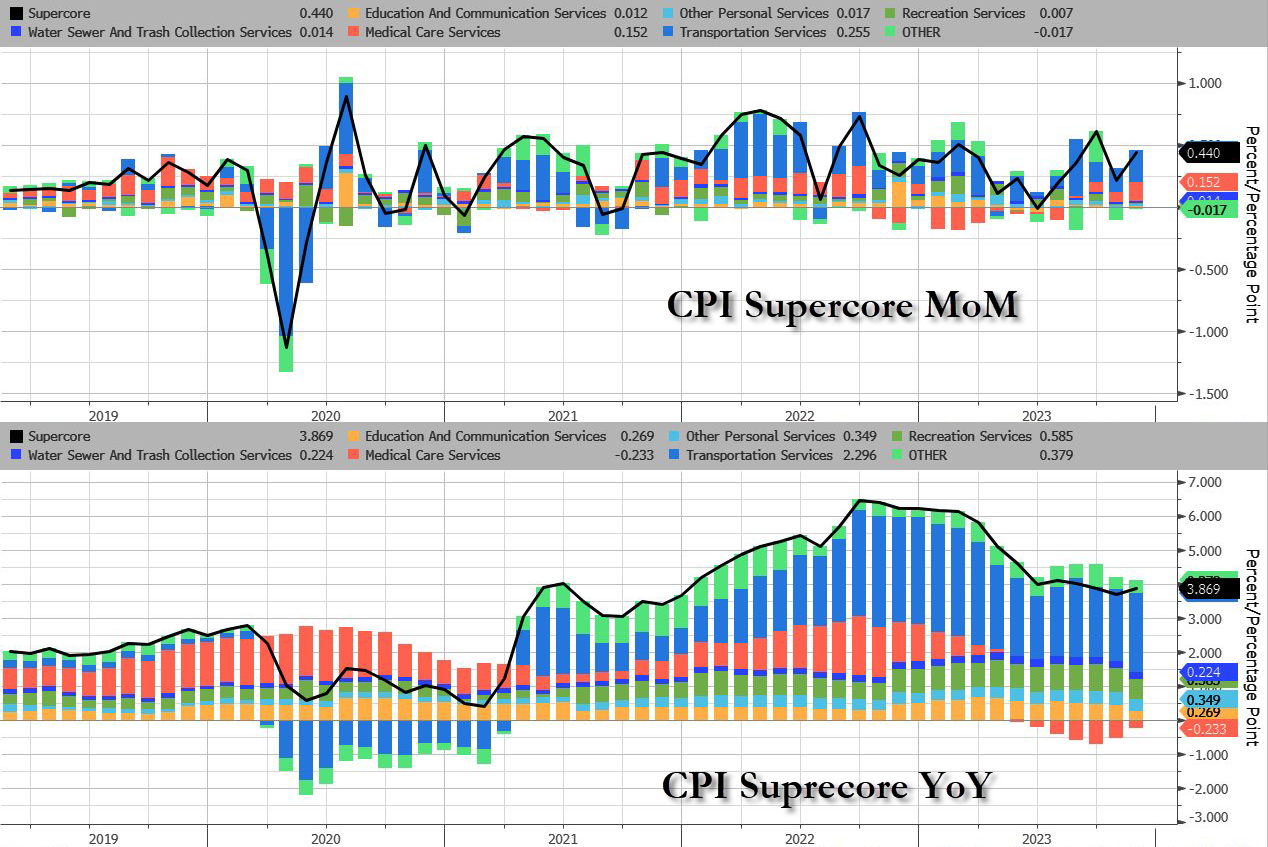
More problematically for The Fed (and the rate-cut ‘hypers’), is the fact that Core CPI Services Ex-Shelter (SuperCore) rose 0.4% MoM, upticking the YoY rise to +4.09%…
Source: Bloomberg
This is a category that Fed Chair Jerome Powell and other policymakers have highlighted as a focus.
All the subsectors of SuperCore rose MoM with the shelter index increased 6.2 percent over the last year, accounting for over two thirds of the total increase in the all items less food and energy index.
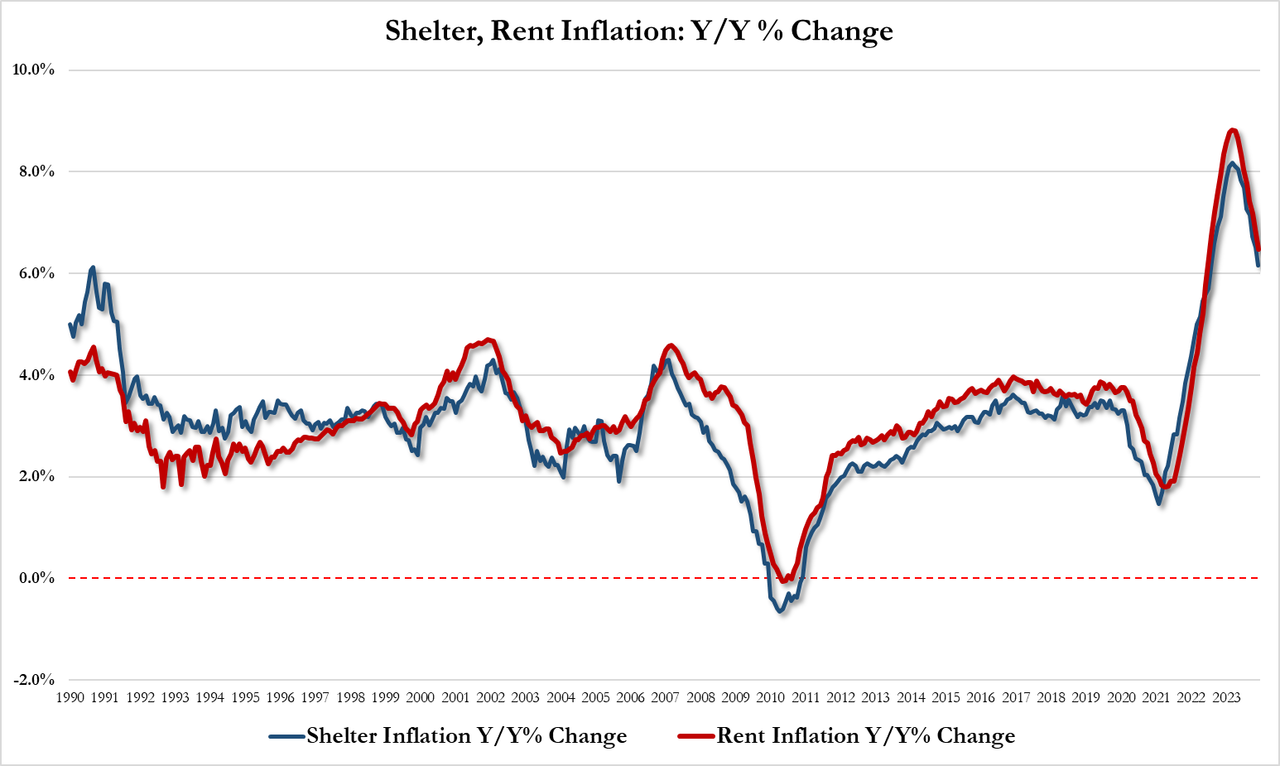
But shelter inflation is slowing (slowly):
Shelter inflation was up 6.15% YoY in Dec, down from 6.51% in Nov and the lowest since July 2022
Rent inflation was up 6.47% YoY in Dec, down from 6.87% in Nov and the lowest since July 2022
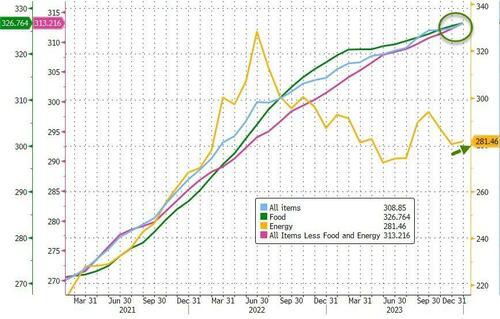
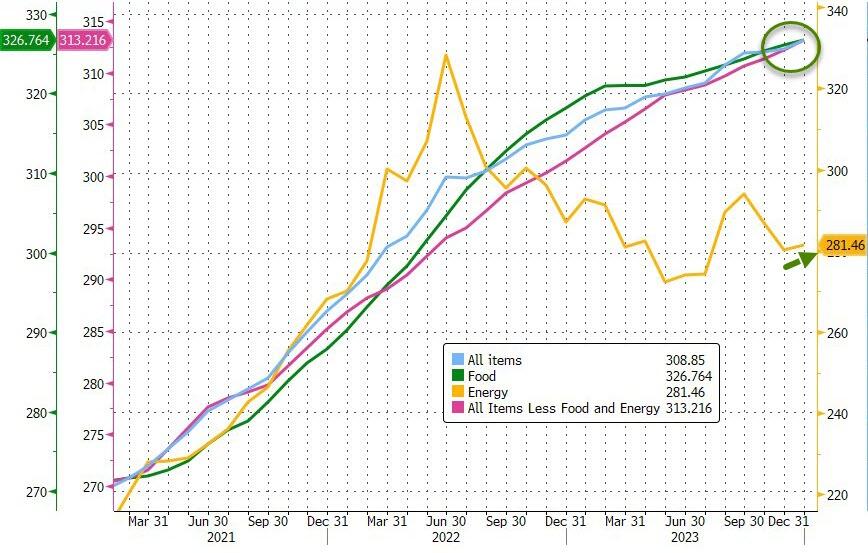
And the next time someone from the Biden administration says ‘inflation is down’ in an attempt to gaslight the public into believing ‘prices are down’ – show them this chart…
Headline costs at record highs
Core costs are record highs
Food costs at record highs
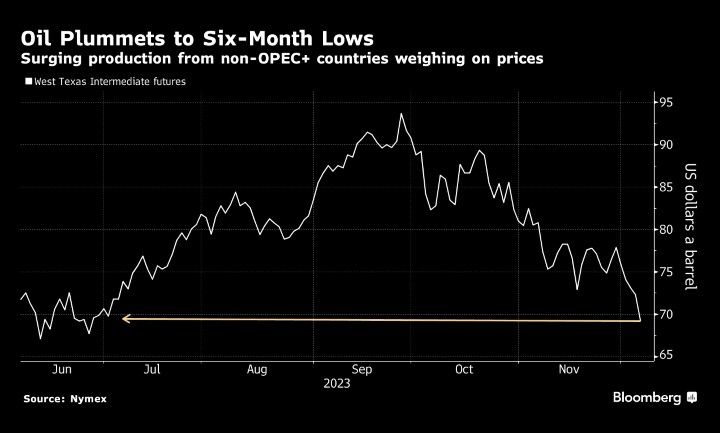
Fuel costs on the rise again
Source: Bloomberg
Four of the six major grocery store food group indexes increased over the month.
The index for meats, poultry, fish, and eggs rose 0.5 percent in December, led by an 8.9-percent increase in the index for eggs.
The index for food away from home rose 5.2 percent over the last year.
The index for limited service meals rose 5.9 percent over the last 12 months, and the index for full service meals rose 4.5 percent over the same period.
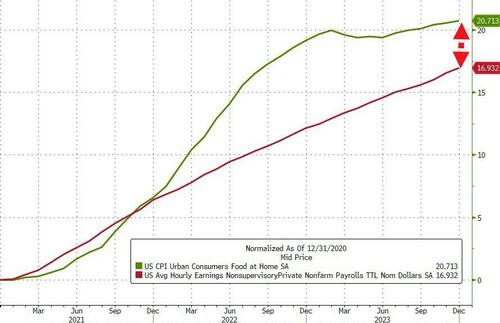
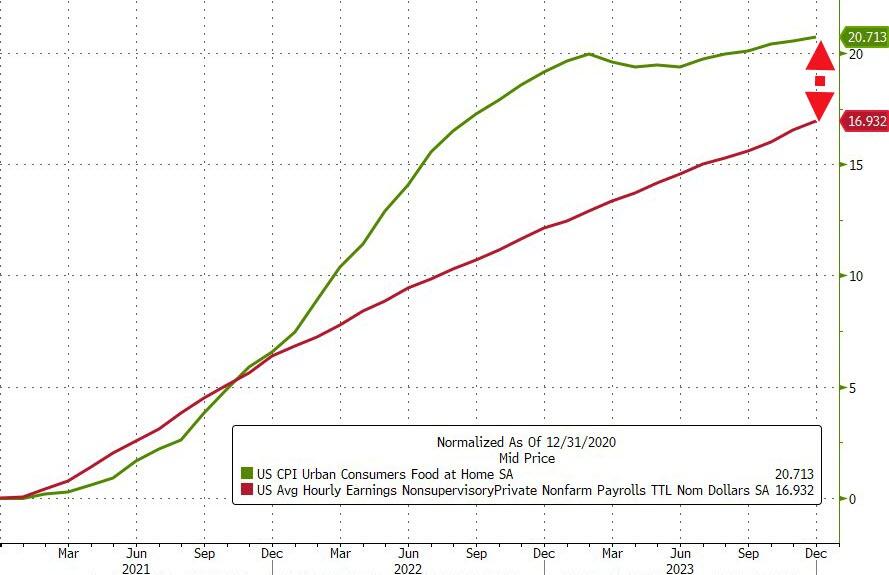
The White House was quick to note that real hourly earnings was positive in December (+0.8% YoY) but that number is the aggregate of ALL American workers.
If we drill down to the ‘average joe’ – production and non-supervisory jobs – their wages are up 17% since Biden was elected… The only problem is, the cost of food since then has surged almost 21%…
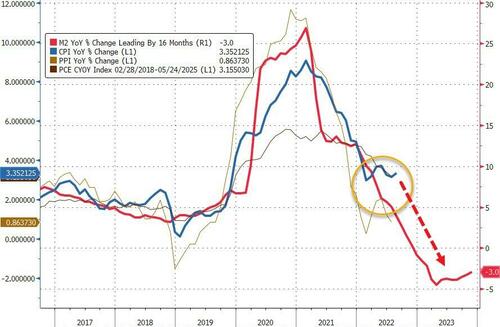
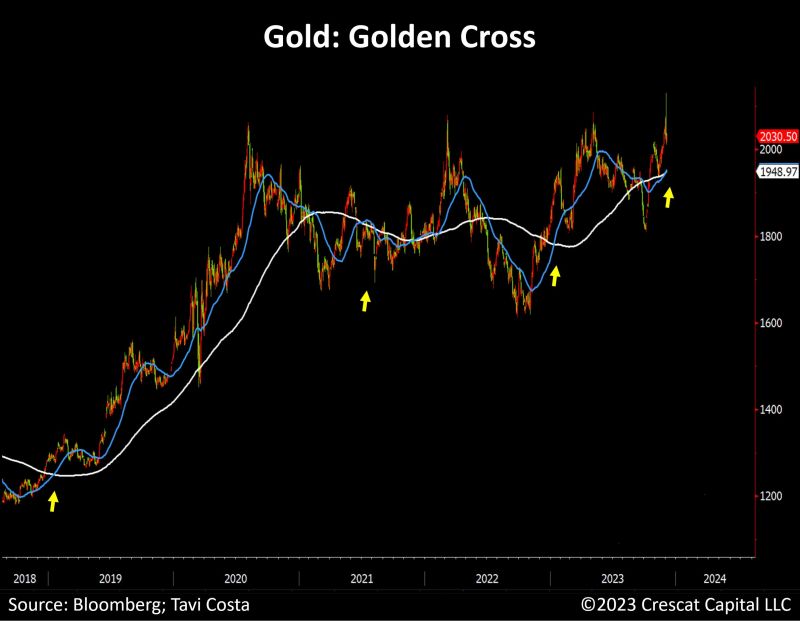
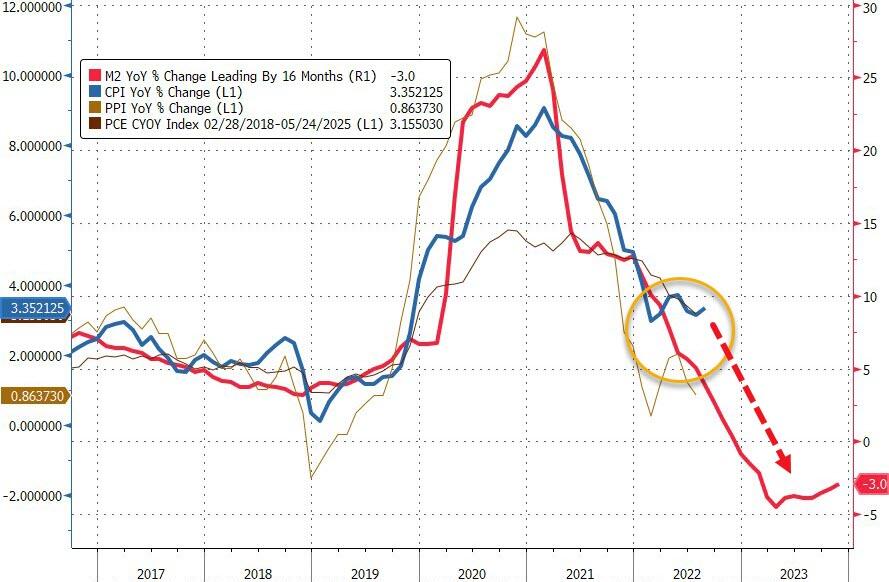
Is this a pause before the re-plunge? M2 thinks so…
So what happens next?
Not so much Goldilocks perfection.
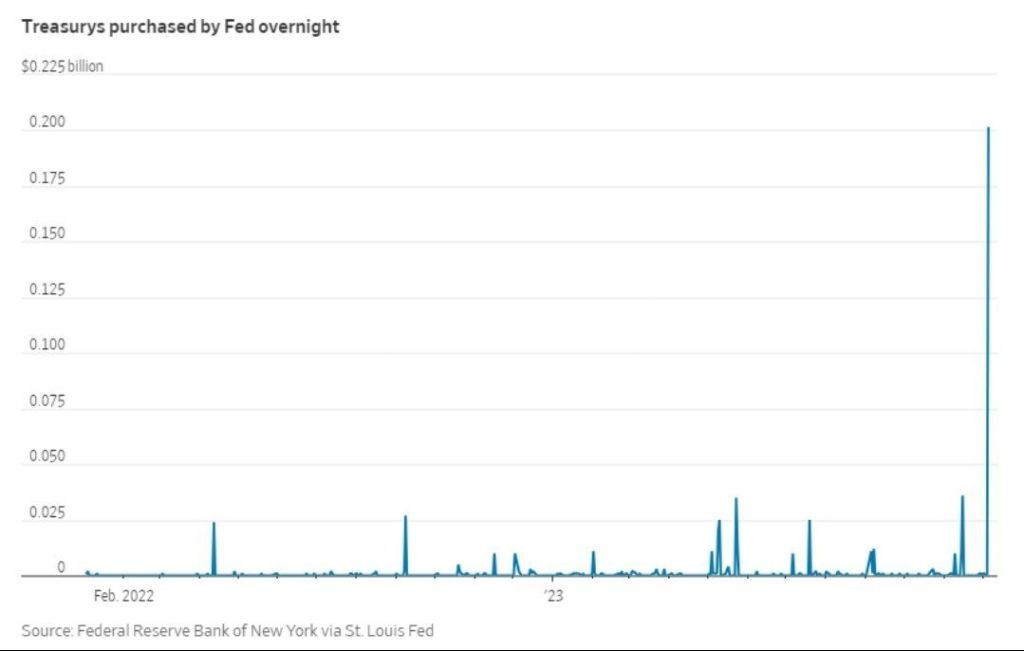
Powell is in a real pickle now – does the Fed begin shrinking QT in March (which it has to if it is terminating BTFP and Reverse Repo is drained) without starting rate cuts.
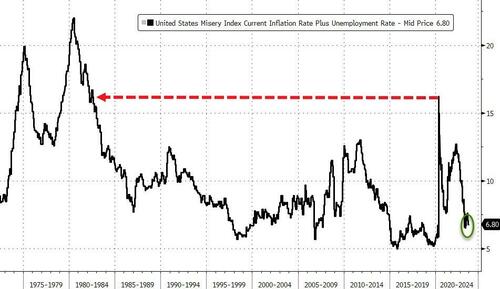
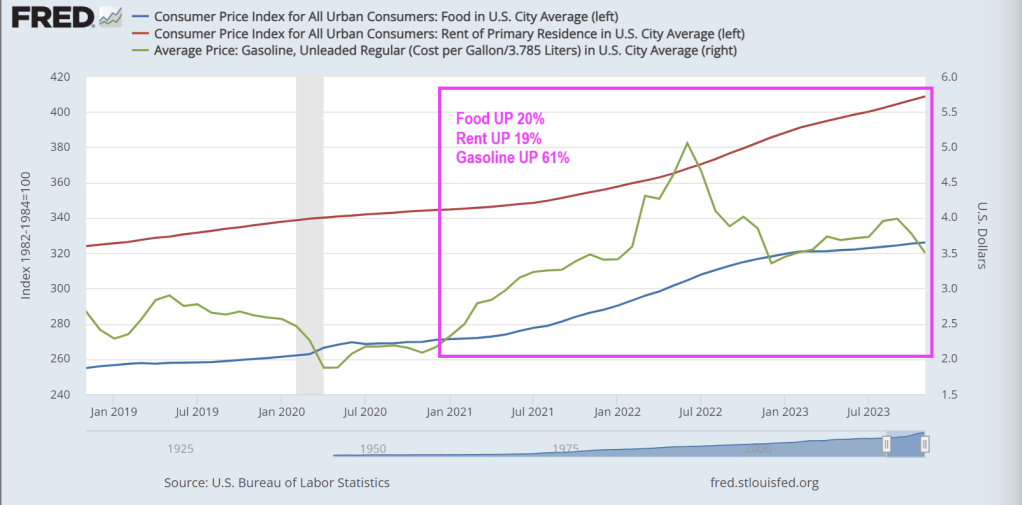
The ‘Misery Index’ is near its lowest level since pre-COVID, but Misery Index masks the true horrors of Bidennomics: 20% higher food prices, 19% higher rents and 61% higher gasoline prices under Bidenomics.
The sum of U.S. unemployment and inflation – known as the “misery index” – fell to 6.8% in November from 7.5% the previous month. That’s the lowest since the summer and fast approaching pre-Covid levels.
The misery index is calculated by adding up the current unemployment rate (3.7%) and the inflation rate (3.1%). The formula provides a simple way to gauge whether the well-being of Americans is improving or not.
Misery peaked in April 2020 when the index spiked to 15%, the highest since 1982. Conditions have improved since the early onset of Covid, but it hasn’t been smooth sailing.
After falling back to 7.7% in January 2021, the index re-accelerated over the next two years as inflation surged. The misery index was 12.5% in June 2022—the same month that annual inflation hit 9.1%.
The unemployment component of the index has been faring well since Covid emergency measures were lifted back in 2021. The unemployment rate has remained below 4% for nearly two years—even as the economy begins to slow.
But economists warn that the misery index doesn’t offer a complete picture of how the average American is doing.
You can tell just by asking them how they feel about the economy and personal finances.
How do Americans really feel?
Economist Greg Ip, who heads economic commentary at The Wall Street Journal, compared the misery index to the University of Michigan’s consumer sentiment index—one of the most closely-watched consumer surveys.
“Based on historic correlations, sentiment has been more depressed this year than you would expect given the level of economic misery,” Ip wrote, arguing that consumers are more pessimistic than the misery index would suggest.
A deeper dive into the sentiment data reveals that Americans are still frustrated about inflation and the impact of high interest rates on their finances. And while the consumer sentiment index rose in December—breaking a four-month skid—some economists attributed it to a temporary holiday boost ahead of Christmas.
“Consumer spirits are perking up for the holiday season which is a sign Christmas is still coming this year,” said Christopher Rupkey, chief economist at FWDBONDS, a New York-based financial research company.
A separate sentiment survey from LSEG/Ipsos paints an even less enthusiastic picture of the average consumer.
The December primary consumer sentiment index—which measures Americans’ attitudes toward jobs, investments, the economy, and personal finances—declined from November and was only up slightly compared to 12 months earlier.
According to the survey, attitudes toward the current situation, investments, and jobs “showed significant declines this month.”
The impact of cumulative inflation
As Creditnews Research reported in a recent study, Americans aren’t celebrating the slowdown in inflation because they’re still reeling from the cumulative price increases of the past three years.
While inflation has fallen to 3.1%, consumer prices have increased by a cumulative 19% since the start of 2020. Food prices are up a whopping 25% over that period.
Americans spent the better part of two years—April 2021 to January 2023—seeing inflation grow faster than their paychecks. That trend reversed in February of this year.
But even with stronger purchasing power this year, the vast majority of Americans (92%) said they reduced their spending in the six months through September, according to a Morning Consult survey for CNBC.
A majority of respondents across all wage brackets said current economic conditions negatively impacted their finances.
So, while the Misery Index indicates that the inflation RATE has slowed, it masks the fact that Americans are far worse off under Bidenomics.
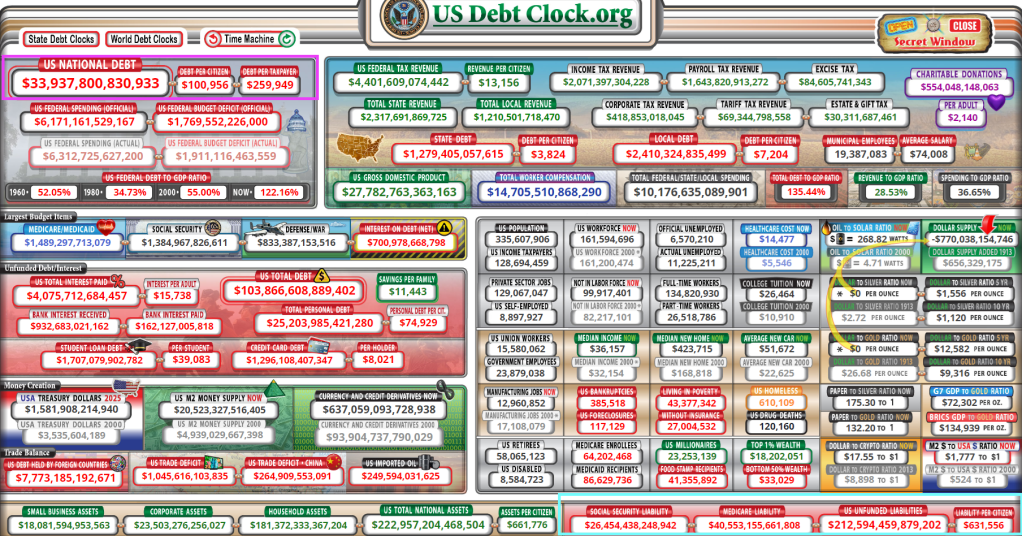
Biden is lucky in that many portray him as a senile, dumb US Senator who happens to be President. Perhaps Biden is actually insidious allowing for open borders in the hopes of crashing the US economy by overloading the welfare system and driving national debt through the roof?
Biden, like Clinton and Obama before him, has been a Cloward-Piven discipile. Who are Cloward and Piven you ask? Two sociologists at Columbia University. (Cloward pass away in 2001, while Piven is still living). Here are Cloward and Piven attending the Voter Registration (aka, Motor Voter Law) Act signing by President “Willie Slick” Clinton.
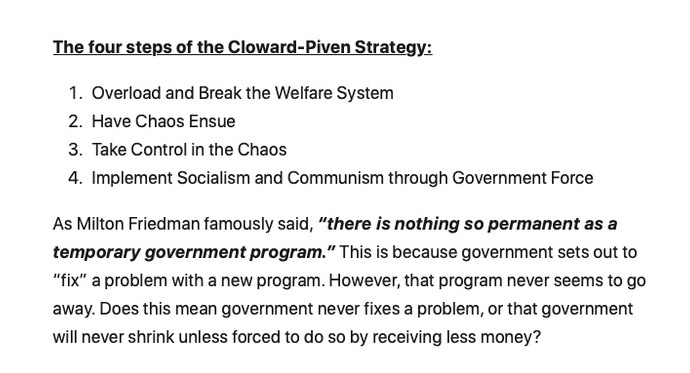
The Cloward-Piven strategy is to overload the welfare system to the point of chaos, take control and implement Marxism through government force. To that extent, Biden and his incoherent sidekick, Kamala Harris, have been wildly successful. Sociology and Political Science are two of the most worthless college degrees (with Management in the Business School being a close third). Taking advice from Sociologists or Political Science majors or faculty is insane.
Biden should be familiar to Latin American, African and Chinese immigrants who are used to Marxist dictators who try to have their political opponents taken of the ballots and prosecucted.
Yes, the US welfare rolls are overflowing with illegal immigrants and unfunded liabilities are out of control. Perhaps Biden and Harris should be replaced with Cloward and Piven (even though Cloward is dead). But Newsom, Hillary Clinton and Michelle Obama share the idiocy of the Columbia sociology faculty members. Hillary even teaches a course at Columbia!
What about compassion for immigrants? Great! Let’s close the borders and return to LEGAL immigration to halt human trafficking, Fentanyl imports, and cartels controlling the border. But Cloward-Piven’s strategy is best accomplished with open borders and weak-willed politicians.
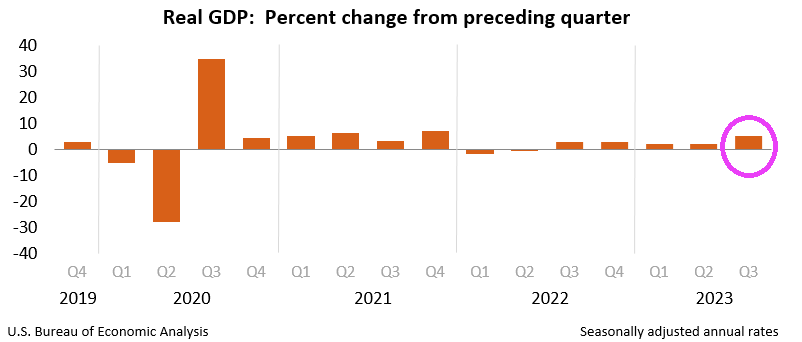
As expected, Q3 Real GDP was revised upwards to 5.2% annualized. Of course, this shatters JKP’s talking points that Biden inherited a train wreck of an economy from Trump. Q3 2020 Real GDP grew at over 30%.
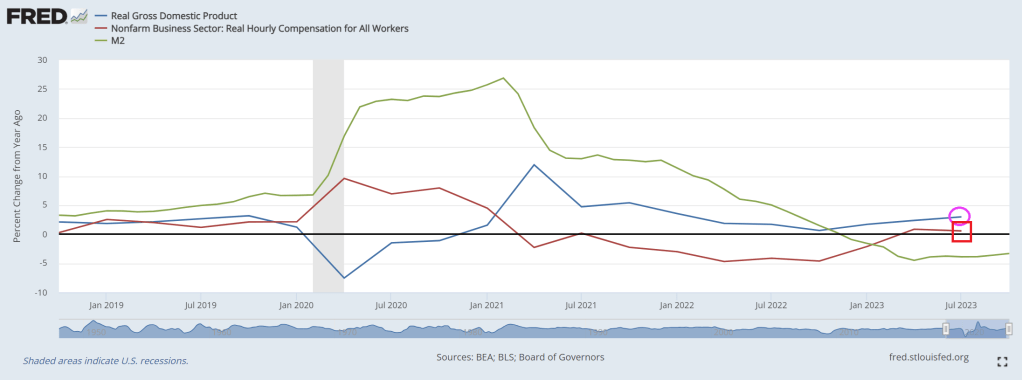
And on a year-over-year (YoY) basis, US real GDP grew at 3.0% in Q3. Unfortunately, real hourly compensation grew at a measly 0.6% YoY.
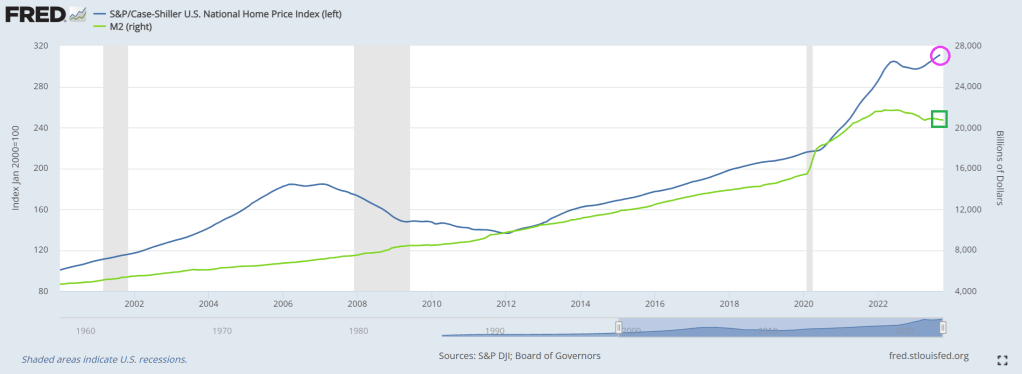
Meanwhile, home prices have hit an all-time high. Too bad real wages are so low.
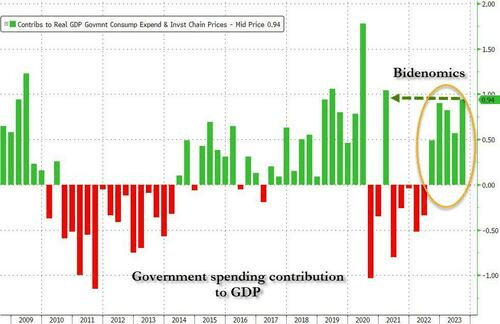
Why is growth so strong? One factor has been government spending which grew an unsustainably 4.7% in real terms over the last year. Outside the pandemic, this is one of the fastest rates in decades and works at a cross purpose with monetary policy objectives.


You must be logged in to post a comment.