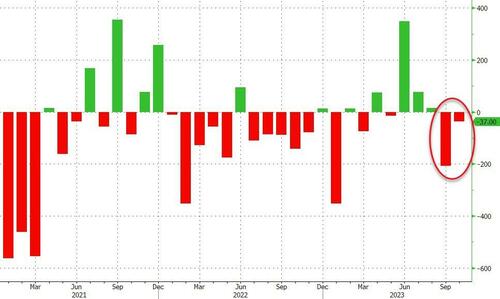
After ADP has printed lower than BLS for the last two months…
Source: Bloomberg
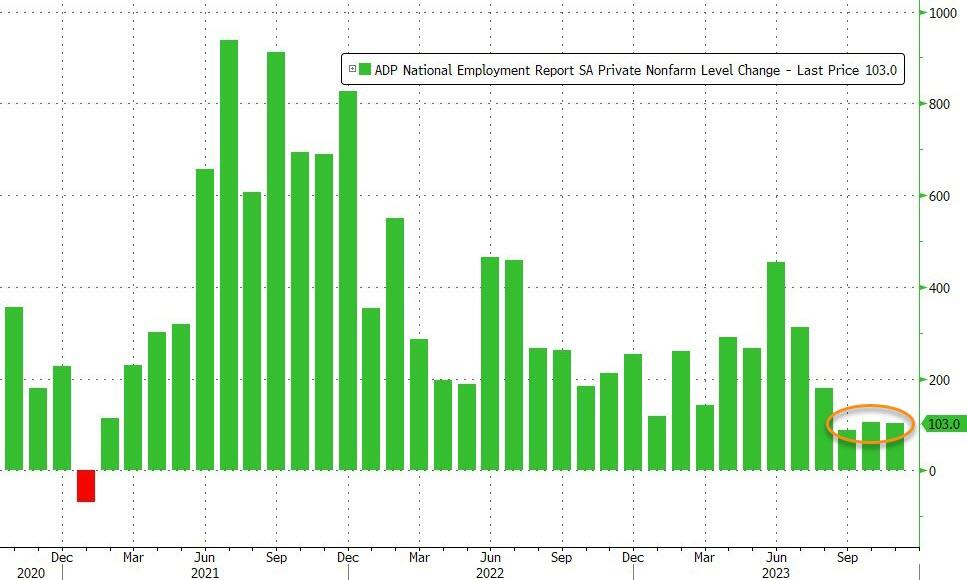
…expectations were for a small tick higher in November (from 113k to +130k), despite the ugly JOLTS print. However, ADP reported just 103k jobs added (and October revised down to 106k)…
Source: Bloomberg
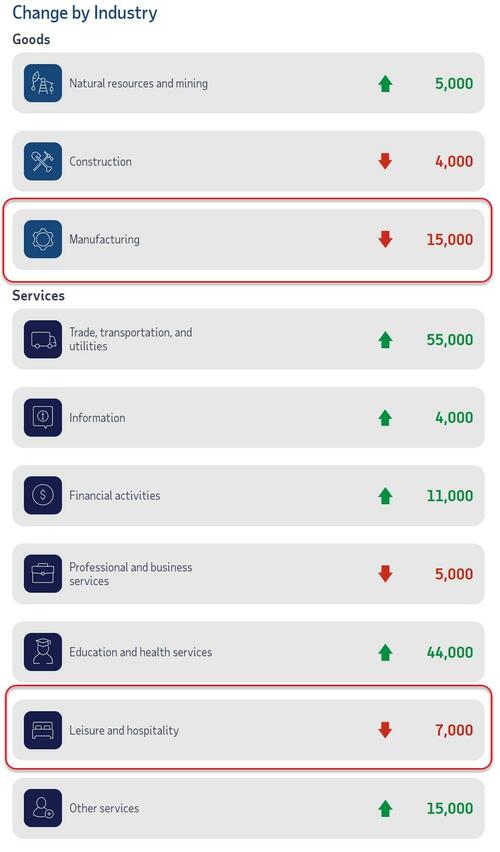
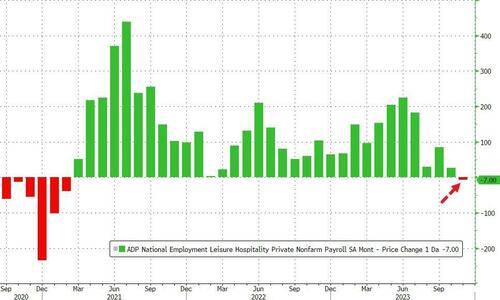
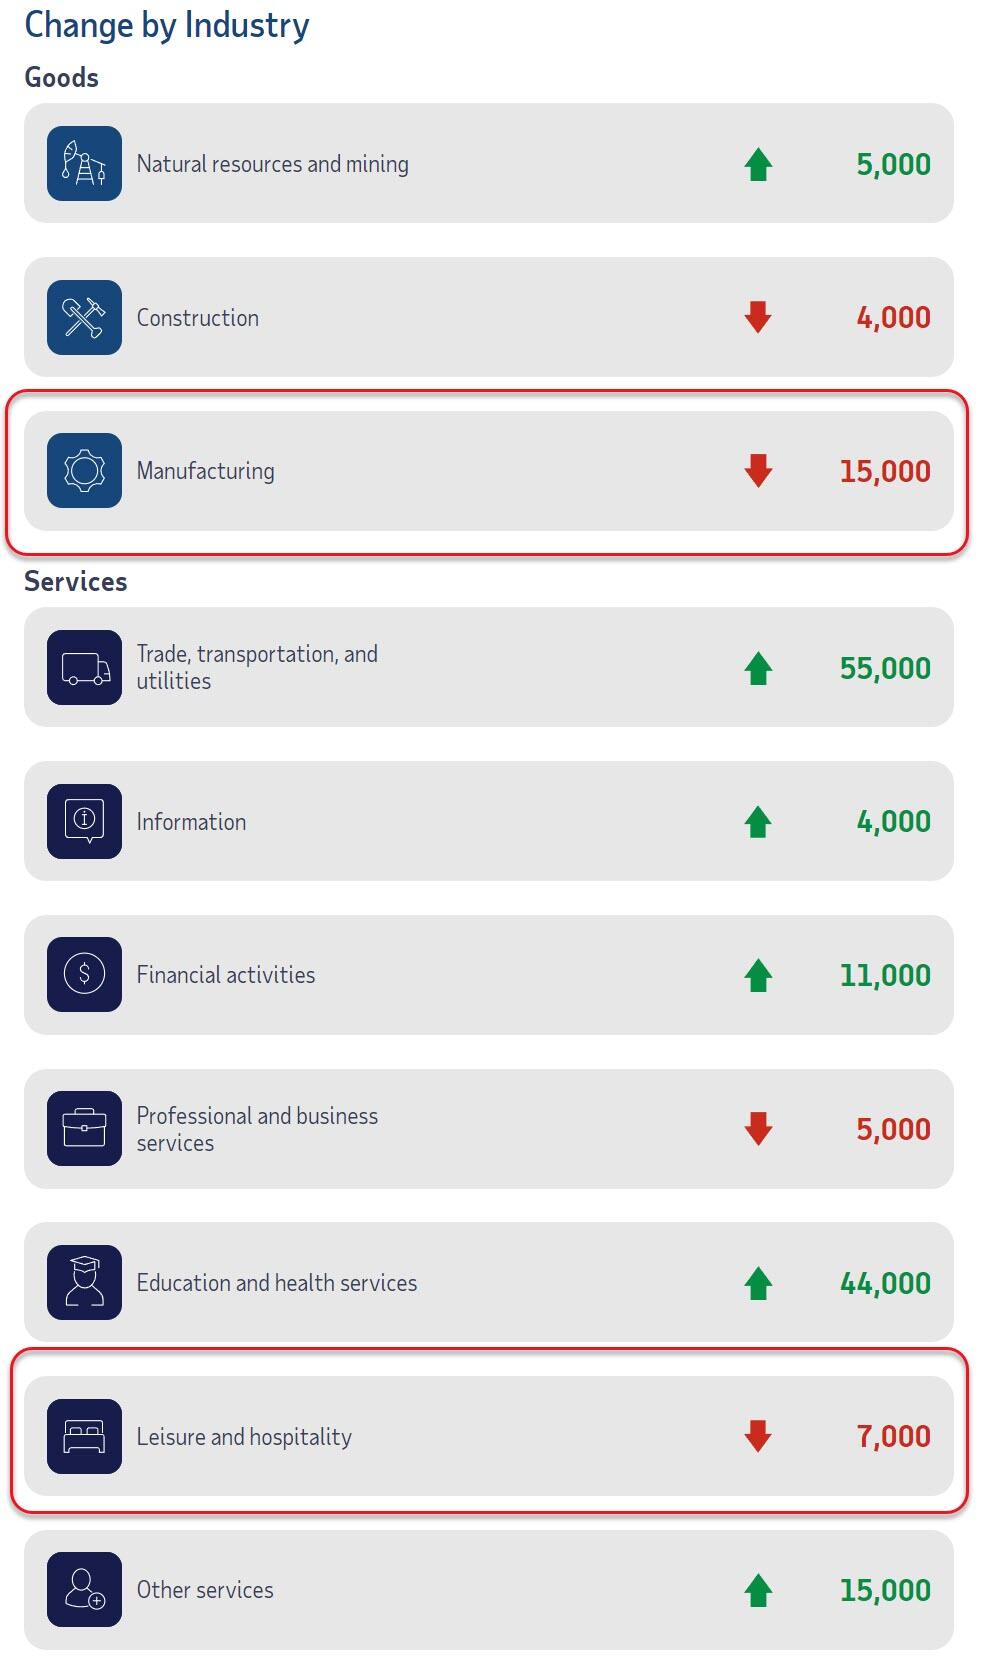
Manufacturing saw the biggest job losses but Leisure and Hospitality lost jobs for the first time since Feb 2021…
ADP’s Chief Economist Nela Richardson notes that:
“Restaurants and hotels were the biggest job creators during the post-pandemic recovery. But that boost is behind us, and the return to trend in leisure and hospitality suggests the economy as a whole will see more moderate hiring and wage growth in 2024.”
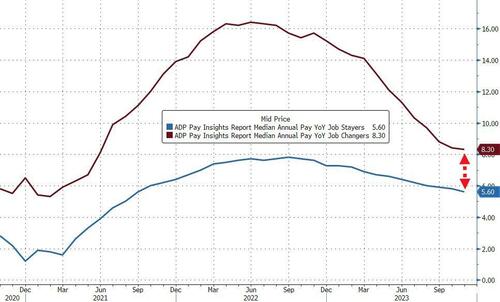
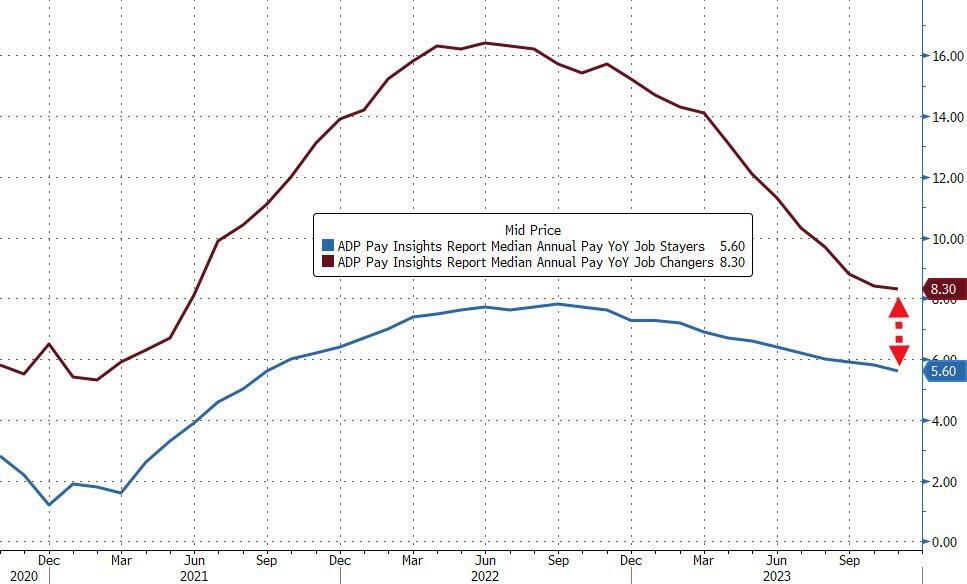
Bidenomics…
Job-stayers saw a 5.6 percent pay increase in November, the slowest pace of gains since September 2021. Job-changers, too, saw slowing pay growth, posting pay gains of 8.3 percent, the smallest year-over-year increase since June 2021. The premium for switching jobs is at its smallest in three years of data.
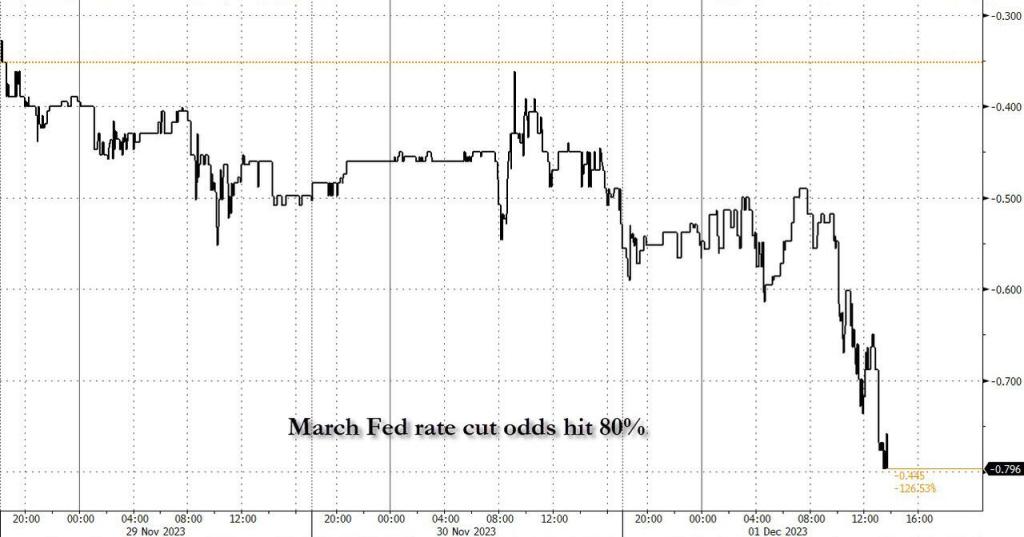
Is this the recessionary signals the STIRs market is banking on for 125bps of rate-cuts next year? Because stocks sure aren’t thinking recession.
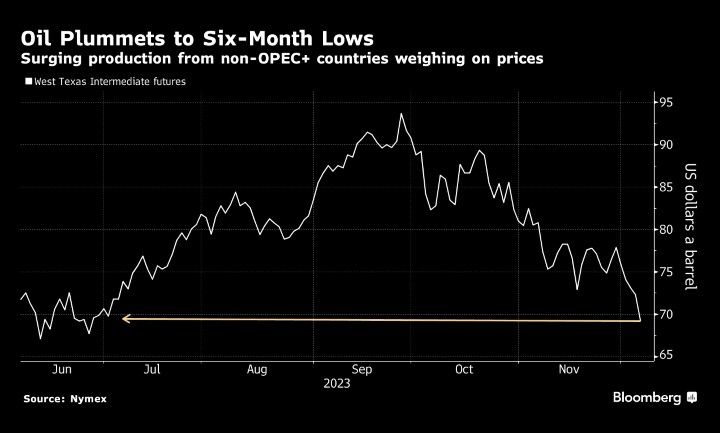
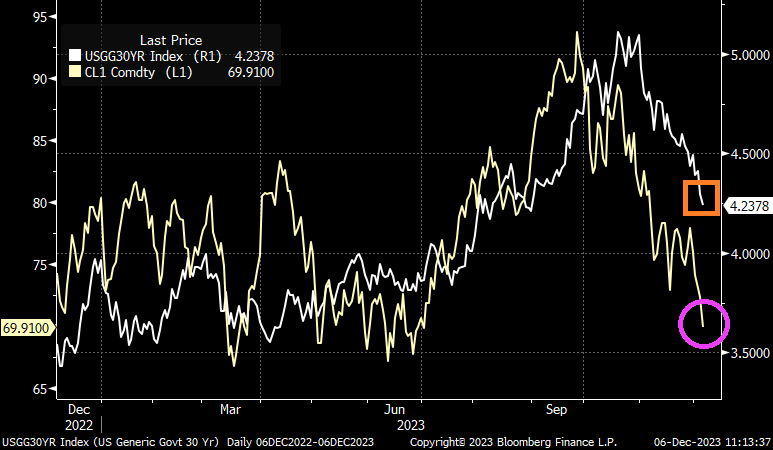
And as US Treasury 30Y yield drop, so do crude oil prices.
While the exciting headline is “Mortgage Purchase Demand rises 35%!” bear in mind that the level of mortgage purchase demand is still relatively low. This is volatility in mortgage applications.
Mortgage applications increased 2.8 percent from one week earlier, according to data from the Mortgage Bankers Association’s (MBA) Weekly Mortgage Applications Survey for the week ending December 1, 2023. Last week’s results include an adjustment for the observance of the Thanksgiving holiday.
The Market Composite Index, a measure of mortgage loan application volume, increased 2.8 percent on a seasonally adjusted basis from one week earlier. On an unadjusted basis, the Index increased 43 percent compared with the previous week. The seasonally adjusted Purchase Index decreased 0.3 percent from one week earlier. The unadjusted Purchase Index increased 35 percent compared with the previous week and was 17 percent lower than the same week one year ago.
The Refinance Index increased 14 percent from the previous week and was 10 percent higher than the same week one year ago. Mortgage rates declined last week, with the 30-year fixed-rate mortgage falling to 7.17 percent – the lowest level since August 2023.
And with 5 rate cuts priced in, we should see mortgage demand increasing in 2024.
On the hotness front, here are the 10 smokin’ housing markets. Strange that the hotness score is highest for generally depressed economic cities like Manchester NH, Rochester NY and Rockford IL. Hey, at least Columbus Ohio made the top 10 on the hotness list!
You might as well face it, markets are “addicted to gov.” Government monetary interference, that is. Government money printing and massive Federal spending.
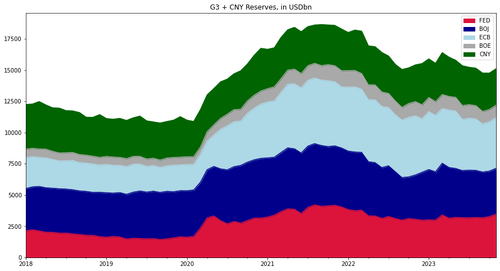
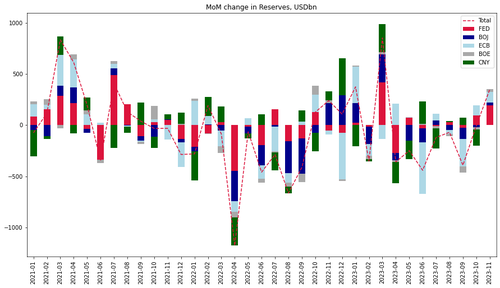
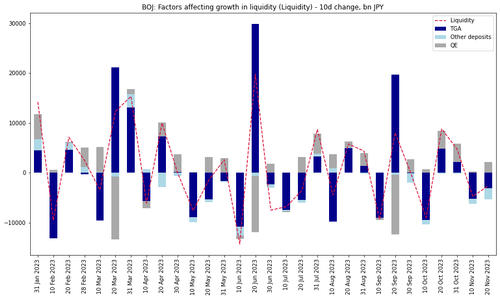
According to Goldman calculations, $350BN of liquidity (in USD terms) was added in November from the G4 central banks + the PBOC was nothing short of a fire hose.
In fact, this was the third largest monthly increase this year after January and March 2023.
The US addition of $60bn for a third consecutive week plus weaker dollar are the main drivers.
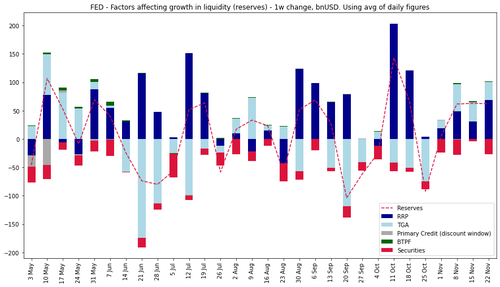
While the BoJ keeps adding liquidity via bond purchases, increases in the TGA balances in the past 20 days have net drained Yen liquidity.
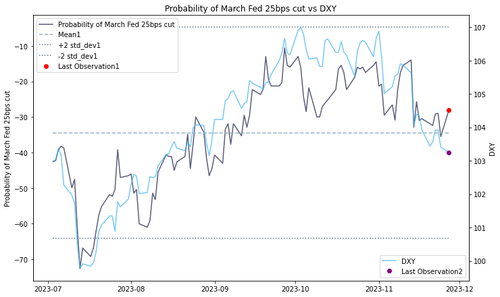
Looking forward over the year end and at the start of 2024, Goldman thinks that the US can keep adding liquidity via high bill issuance and RRP withdrawal over the next couple of months (something we discussed last month in “How Treasury Averted A Bond Market “Earthquake” In The Last Second: What Everyone Missed In The TBAC’s Remarkable Refunding Presentation“), while the dollar contribution to benign liquidity conditions could face some headwinds due to the risk of pricing out of some of the March Fed cuts as a result of the strong positive FCI impulse in November.
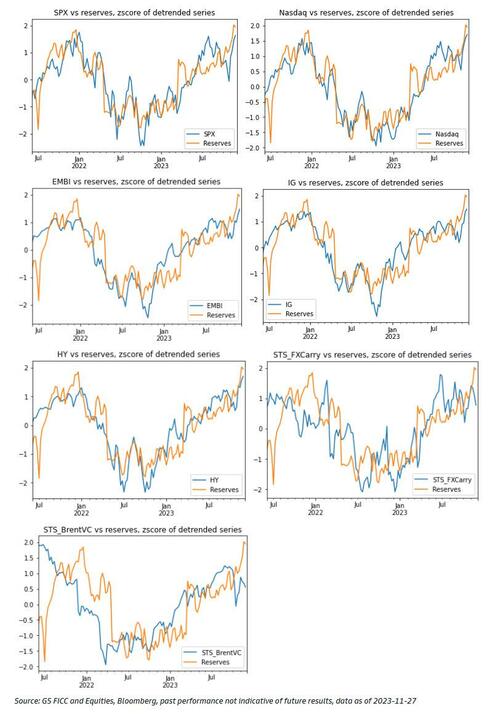
Goldman’s one-factor model for risky assets based on the liquidity cycle suggests that US IG and EM hard currency debt are cheap and the bank’s STS FX carry and Brent Vol Carry indices have under-performed the benign liquidity environment and may catch up the next two months.
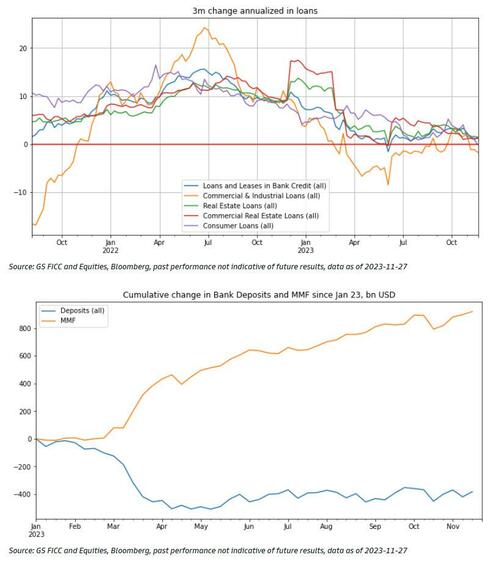
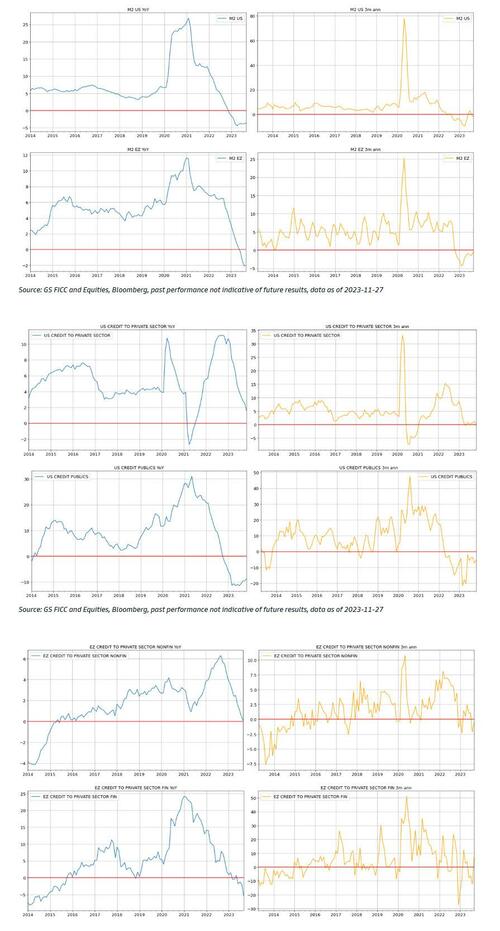
The US and Eurozone money supply and lending growth indicators remain weak, implying extended downside bias in domestic demand and inflation in H1-2024 (i.e., higher likelihood for easing absent a reflationary shock out of China or a supply-driven commodity price surge).
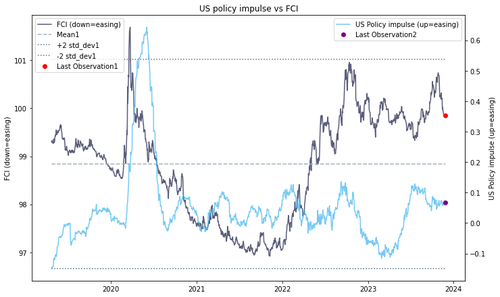
Finally, The US policy impulse (comprising of liquidity, fiscal stance, as well as nominal and real forward rates) has moved sideways in October and November after some renewed tightening in September. The GS FCI index eased nearly -100 basis points (-1.4z) in November.
Doctor, doctor (Yellen), we got a bad case of distortionomics (where the 1% wins and the 99% fall behind). After all, under Dr. Yellen as our Treasury Secretary, we are suffering from massive fiscal inferno with wild government spending. I would use “Government Gone Wild!” but the thought of Yellen … well, never mind.
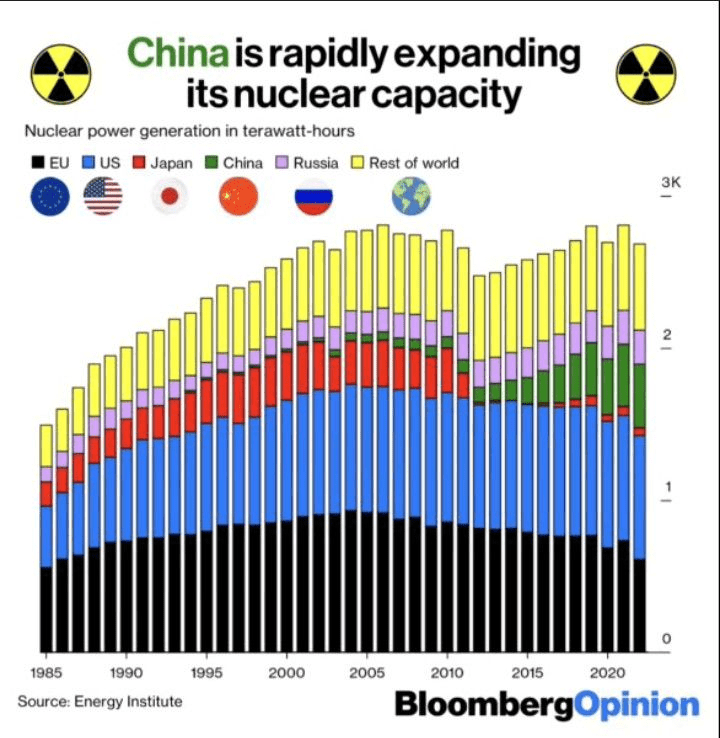
Meanwhile, while John Kerry pushes for ending ALL coal powered plants (good luck charging the thousands of EV charging stations on wind/solar power!), China is building NUCLEAR plants. While US green wimps (Kerry comes to mind) whine whenever nuclear plants are mentioned for the US.
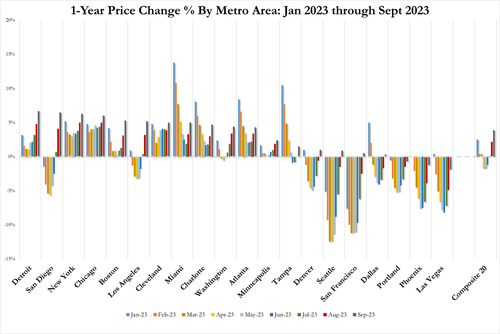
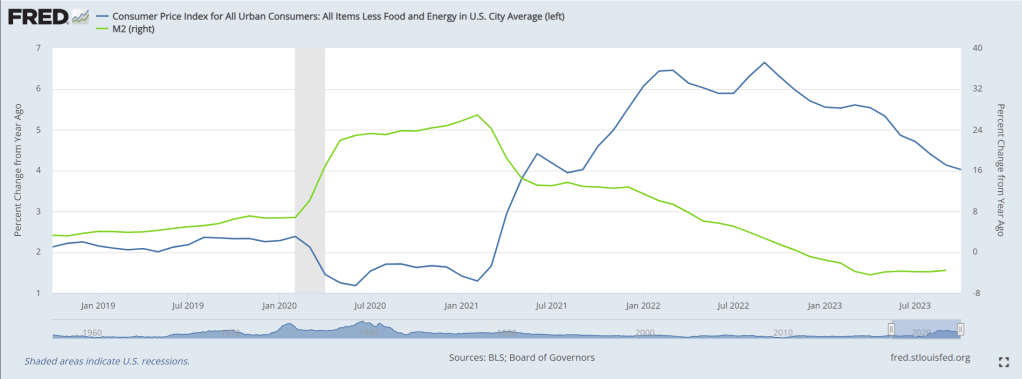
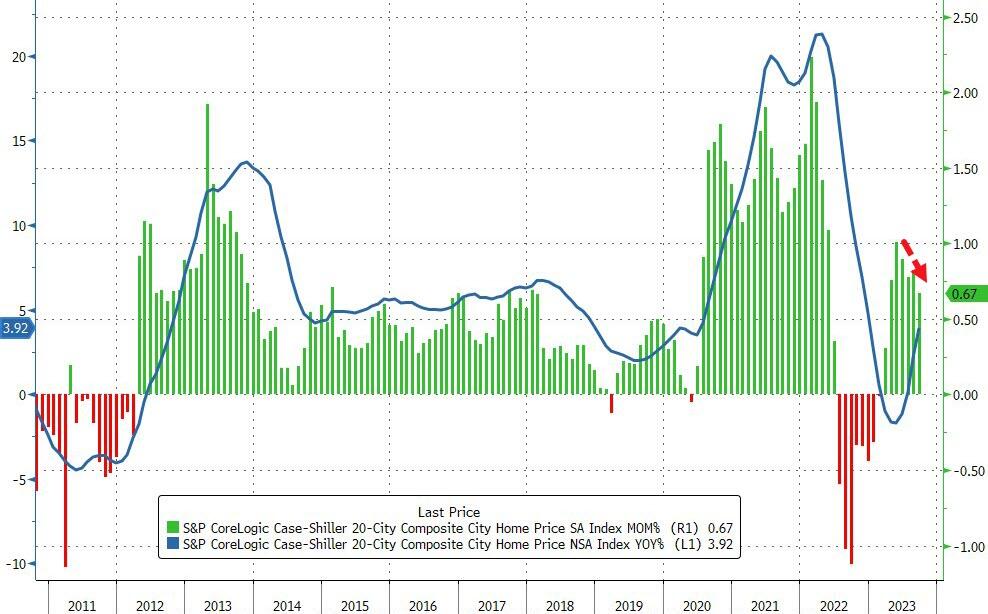
While the Case-Shiller National home price index is rising again, it has been slowing since March 2022. This is happening as “the honey pot” (aka, M2 Money printing) growth is now negative. While real hourly compensation growth is slightly, the average rate of growth since April 1, 2021, is -2.1%. (Not exactly what Biden wants to broadcast as a feature of Bidenomics).
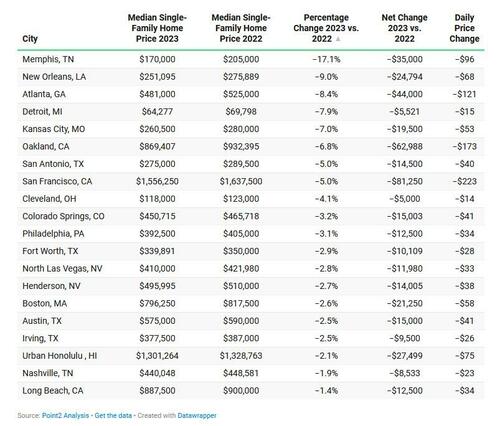
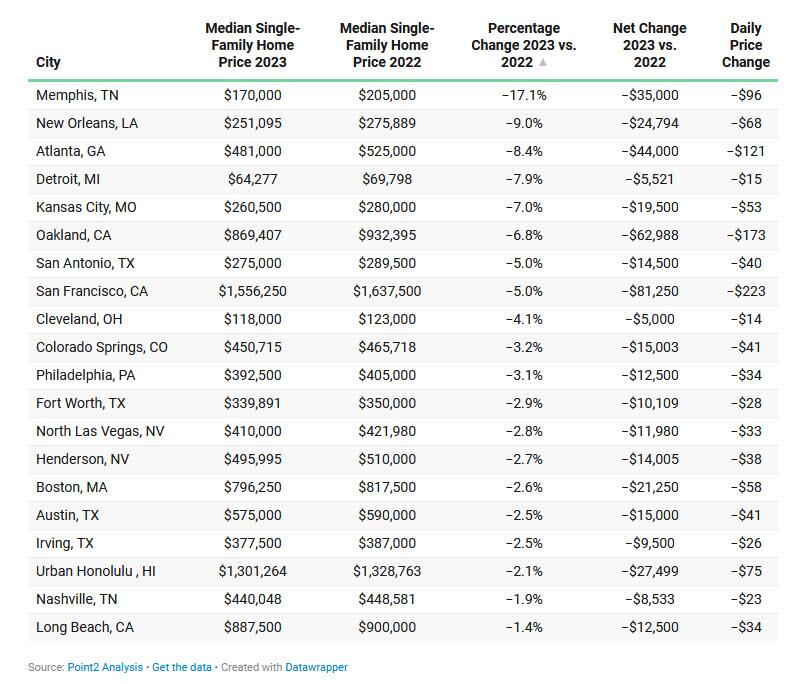
According to a recent report from Point2 Homes, many recently bought homes, particularly in the hottest regions, are deep in the red. On average, single-family homeowners have been shedding $223 in property value every day since they bought their homes last year.
Condo owners are faring even worse, losing up to $336 a day in San Francisco, or a stunning $122,500 a year.
“This double-blow market means that the most newly minted owners were first hit by the highest home prices in history, only to be cut off from building wealth by the current falling prices,” analysts wrote.
Some major markets are seeing massive net losses
Single-family homes in 16 cities examined in the analysis have faced price declines of over $10,000 over the past year.
Memphis saw the most significant single-family price plunge, as well as the second-largest decline in condo prices, which analysts say could be due to rising inventory in the city.
Condo prices in 37 cities are also weakening, including in New York and Oakland.
So, what does this mean for homeowners? Folks who shelled out plenty of cash last year to secure their deals are now grappling with depreciating property values, which means it’s harder to build equity.
And if they want to sell in today’s market, they risk reaping less for their homes than what they paid for them. Zillow reports new buyers won’t sell at a profit until they’ve spent over a decade in their homes.
In another report from Redfin, analysts estimated that more than 3% of homes sold at a loss between August to October this year. The median amount was recorded at around $40,000, although some properties lost up to six figures on the sale.
Again, San Francisco sellers reported the biggest losses, with 1 in 7 homeowners losing money on their sales. And Memphis TN leads in percentage loss at -17.1%!
There are a couple of factors that could be contributing to the Golden City’s housing woes, including the rise of remote work coupled with tech layoffs pushing residents to relocate to other areas.
“There are buyers out there, but they’re a lot more cautious and picky than they were when mortgage rates were low,” Redfin Premier real estate agent Andrea Chopp said in September.
“The Bay Area housing market was unsustainable before, so this correction is probably healthy, but the unfortunate thing is prices remain unaffordable for a lot of people—especially with rates now above 7%,” she said.
97% of sellers are in the money, though
It’s not all doom and gloom for sellers—at least not for those who’ve been residing in their homes for a long time and bought when prices were much lower than they are today.
In many markets, sellers have been reluctant to let go of their low mortgage rates and apply for a home loan at a much higher rate, and that’s keeping inventory tight and prices high.
In the three months ending July 31, 97% of sellers across the country sold for a profit, with the typical home selling 78.4%, or $203,232, more than the seller bought it for, says Redfin.
And while San Francisco has been reporting more losses than usual, the median homeowner is still reaping $625,500 more on their home sale compared to the original purchase price.
The Godfather of San Francisco property losses, California Governor Gavin Newsom.
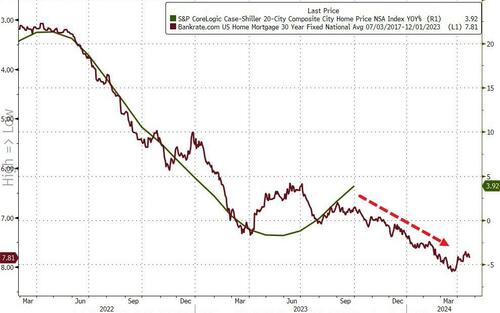
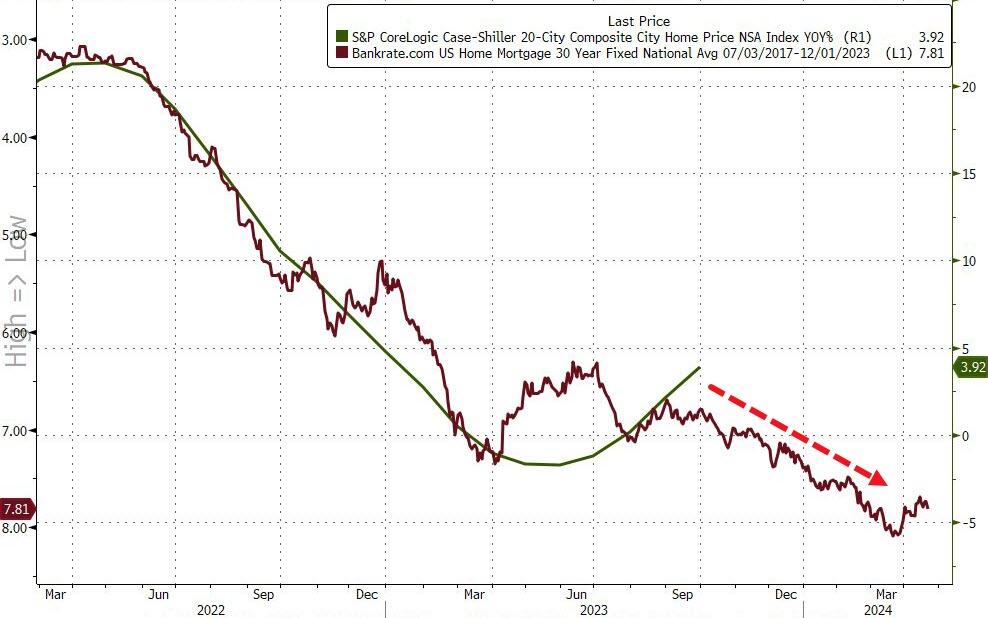
That pushed the YoY rise in prices up 3.92% – the fastest pace since Dec ’22 – but as the chart shows the MoM gains are slowing rapidly.
Source: Bloomberg
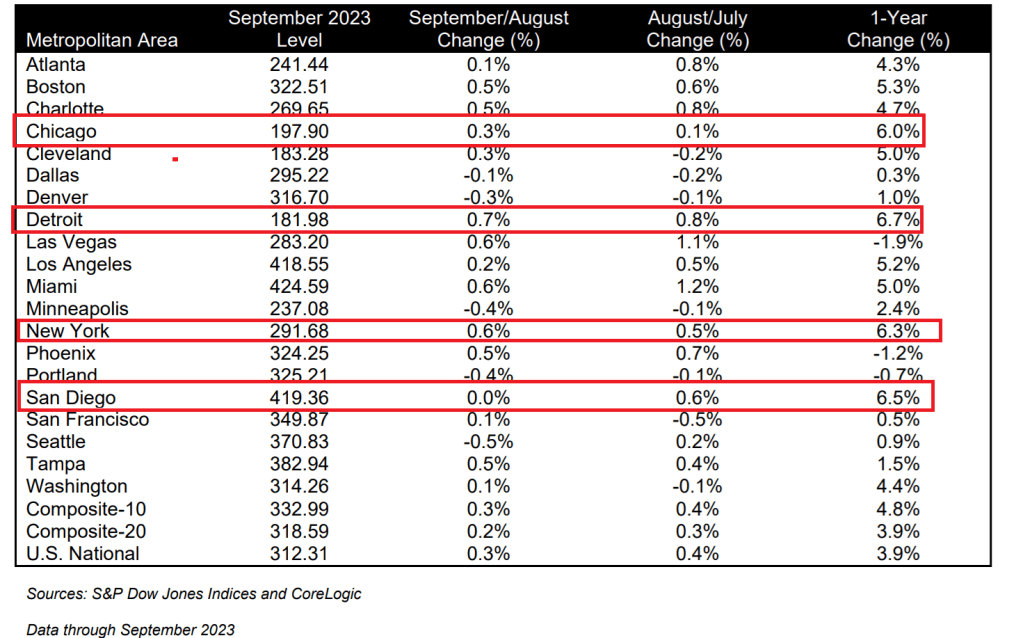
“On a year-over-year basis, the three best-performing metropolitan areas in September were Detroit (+6.7%), San Diego (+6.5%), and New York (+6.3%),” according to Craig J. Lazzara, Managing Director at S&P DJI.
“We’ve commented before on the breadth of the housing market’s strength, which continued to be impressive. On a seasonally adjusted basis, all 20 cities showed price increases in September”
But, judging by the resumption of the rise of mortgage rates since the Case-Shiller data was created, we would expect prices to also resume their decline…
Source: Bloomberg
Inventory is increasing (as homebuilders dump new homes on to the market), but existing home-buyers and -sellers are stuck still (affordability for the former and the mortgage cost gap for the latter), and – despite the market’s hopes – The Fed isn’t cutting rates any time soon (unless the economy utterly collapses). Be careful what you wish for…
Odd that 4 metro areas with 6% or higher home price growth are all cities with larger illegal immigrant migration: Chicago, Detroit, New York and San Diego (all blue cities). This is what is called housing displacement, A surge in immigration leads to rent stock being absorbed and housing prices rising.
The Federal Reserve reminds me of The Stones’ song “Tumbling Dice.” Why? The Fed can’t tell if inflation is cooling or re-accelerating. Hence, they are just rolling dice.
Let’s start with mortgage rates, a critical component of the housing and CRE markets. Mortgage rates remain up 163% since 2021, not great for housing affordability. Despite recent small declines in the mortgage rate. The 10Y-2Y Treasury curve is also going deeper into reversion … again.
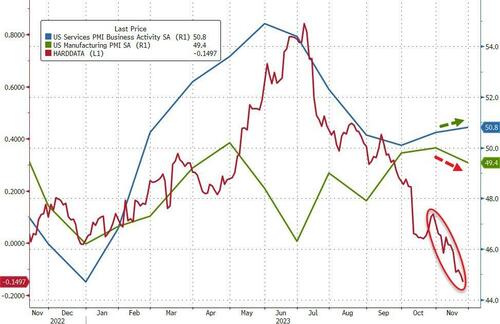
However, the data was more mixed with US Manufacturing falling more than expected to 49.4 – back into contraction – (vs 49.9 exp) from 50.0 in October. However, US Services unexpectedly rose from 50.6 to 50.8 (exp 50.3).
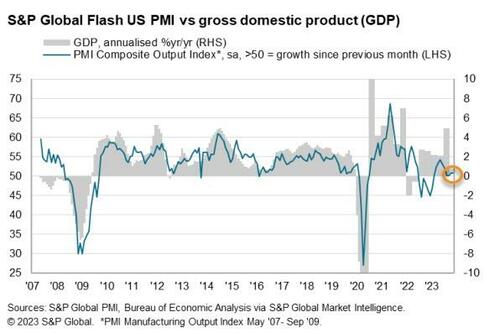
“The US private sector remained in expansionary territory in November, as firms signalled another marginal rise in business activity. Moreover, demand conditions – largely driven by the service sector – improved as new orders returned to growth for the first time in four months.
The upturn was historically subdued, however, amid challenges securing orders as customers remained concerned about global economic uncertainty, muted demand and high interest rates.
Businesses cut employment for the first time in almost three-and-a-half years in response to concerns about the outlook. Job shedding has spread beyond the manufacturing sector, as services firms signalled a renewed drop in staff in November as cost savings were sought.
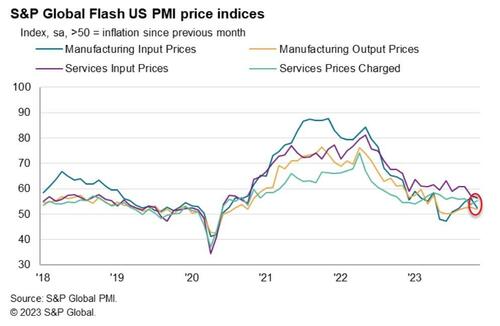
“On a more positive note, input price inflation softened again, with cost burdens rising at the slowest rate in over three years. The impact of hikes in oil prices appear to be dissipating in the manufacturing sector, where the rate of cost inflation slowed notably.
Although ticking up slightly, selling price inflation remained subdued relative to the average over the last three years and was consistent with a rate of increase close to the Fed’s 2% target.”
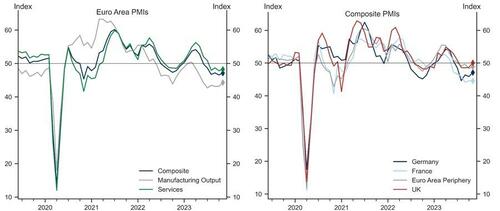
The US data comes after yesterday’s Euro area composite flash PMI increased by 0.6pt to 47.1, above consensus expectations, driven by a meaningful acceleration in Germany and the periphery, partially offset by a marginal decline in France. In the UK, the composite flash PMI improved meaningfully and entered expansionary territory at 50.1, above consensus expectations, on the back of a pickup in both sectors, with the services sector index entering positive territory at 50.5.
Goldman sees three main takeaways from today’s data.
First, we see a potential turning point in Euro area activity, with forward-looking indicators all improving in November, potentially setting a positive stage for the remainder of the year and the beginning of 2024. While the improvement seems to be broad-based, the upside surprises in the manufacturing sector in Germany and the Euro area as a whole may point to early signs of the sector’s revival.
Second, inflationary pressures, after moderating for some time, show signs of renewed intensification in the Euro area, as reflected by the output and input price components ticking up in November.
Third, UK growth momentum was meaningfully better than last month, and is picking up across the board, with the headline and services indices coming in above 50. This, however, is now accompanied by an increase in cost pressures, with both the input and output price indices edging up in November.
Finally, back to the US, S&P Global found that US business uncertainty was also heightened among US firms, as expectations regarding the year-ahead outlook slipped to the weakest since July.
A record 130.7 million people are expected to shop in stores and online in the U.S. on Black Friday this year, the National Retail Federation (NRF) estimates. The event is known for crowds lining up at big-box stores at dawn to scoop up discounted TVs and home appliances.
But at 6 a.m. on Friday at a Walmart in New Milford, Connecticut, the parking lot was only half full.
“It’s a lot quieter this year, a lot quieter,” said shopper Theresa Forsberg, who visits the same five stores with her family at dawn every Black Friday. She was at a nearby Kohl’s (KSS.N) store at 5 a.m.
Fifth Avenue, one of the world’s top shopping streets, is dead quiet on Black Friday — at least by New York’s boisterous standards.
The strip of high-end shops from brands like Louis Vuitton and Cartier has largely recovered since its pandemic lull, where vacancies had once reached nearly 30% in Midtown East. Some vestiges of that struggle remain, with a few empty storefronts covered up or filled with little art installations. Yet the street has managed to keep its title as the most expensive retail area on the planet by rent per square foot, according to Cushman & Wakefield.
Mortgage rates up 163% since 2021, manufacturing PMI in contraction and Black Friday shopping muted. Not good. The Fed is rolling the dice on what to do next.
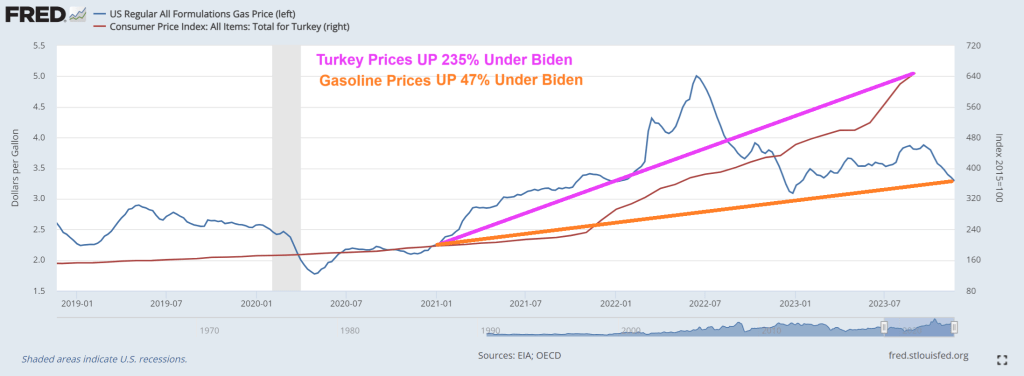
Yes, prices of turkey (that we eat) and gasoline (used to drive to family/friends) have declined a little recently. BUT turkey prices are still up by 235% since Biden was sworn in as President. And gasoline prices are still up 47%. One of Biden’s “economists” came out and said gasoline is now lower than it was in 2020. WRONG! Look at the chart below from The Federal Reserve of St. Louis.
Being politicians, The Biden Administration take credit for RECENTLY declining prices, but failing to mention that declining prices have more to do with declining M2 Money growth (now -3.6% YoY) after the enormous burst in Federal spending with Covid.
With turkey prices up 235% under Biden, I will be eating turkey SPAM tonight. And a small portion at that!
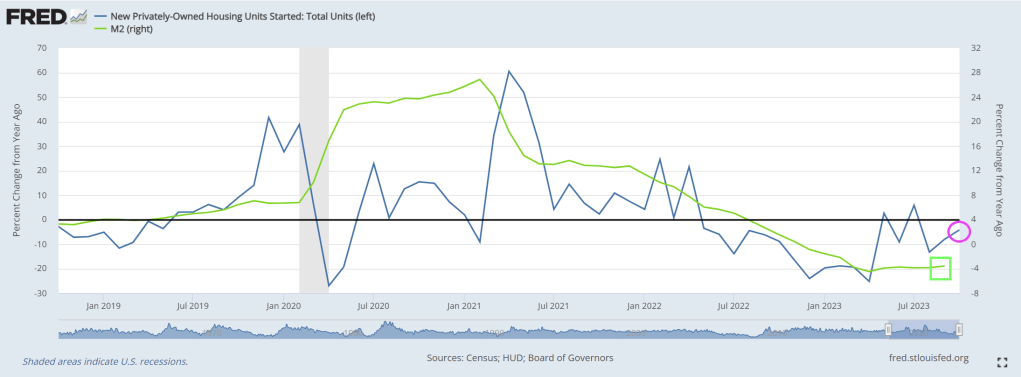
Housing Starts: Privately‐owned housing starts in October were at a seasonally adjusted annual rate of 1,372, the October 2022 rate of 1,432,000. Single‐family housing starts in October were at a rate of 970,000; this is 0.2 percent above the revised September figure of 968,000. The October rate for units in buildings with five units or more was 382,000.
Building Permits: Privately‐owned housing units authorized by building permits in October were at a seasonally adjusted annual rate of 1,487,000. This is 1.1 percent above the revised September rate of 1,471,000, but is 4.4 percent below the October 2022 rate of 1,555,000. Single‐family authorizations in October were at a rate of 968,000; this is 0.5 percent above the revised September figure of 963,000. Authorizations of units in buildings with five units or more were at a rate of 469,000 in October.
Total starts were down 4.2% in October compared to October 2022. And starts year-to-date are down 11.3% compared to last year.
In YoY terms (change since one year ago), shows housing starts declining with dying M2 Money growth.
Starts have been down year-over-year for 16 of the last 18 months (May and July 2023 were the exceptions), and total starts will be down this year – although the year-over-year comparisons are somewhat easier in Q4.


You must be logged in to post a comment.