US Q2 GDP Revised Sharply Downwards To 2.1% (We Got Trouble In Potomac City!)

Bidenomics has a new themesong! We got trouble in Potomac City (aka, Washington DC). US Q2 GDP was revised sharply downwards to 2.1% QoQ. Much lower than the expected 2.4% QoQ.

Real gross domestic product (GDP) increased at an annual rate of 2.1 percent in the second quarter of 2023, according to the “second” estimate released by the Bureau of Economic Analysis. In the first quarter, real GDP increased 2.0 percent.

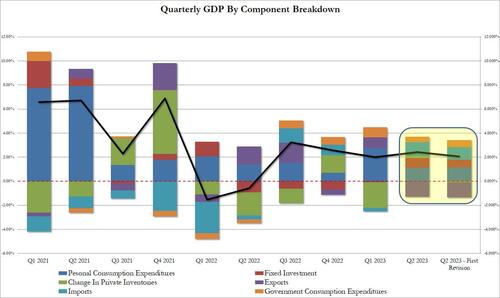
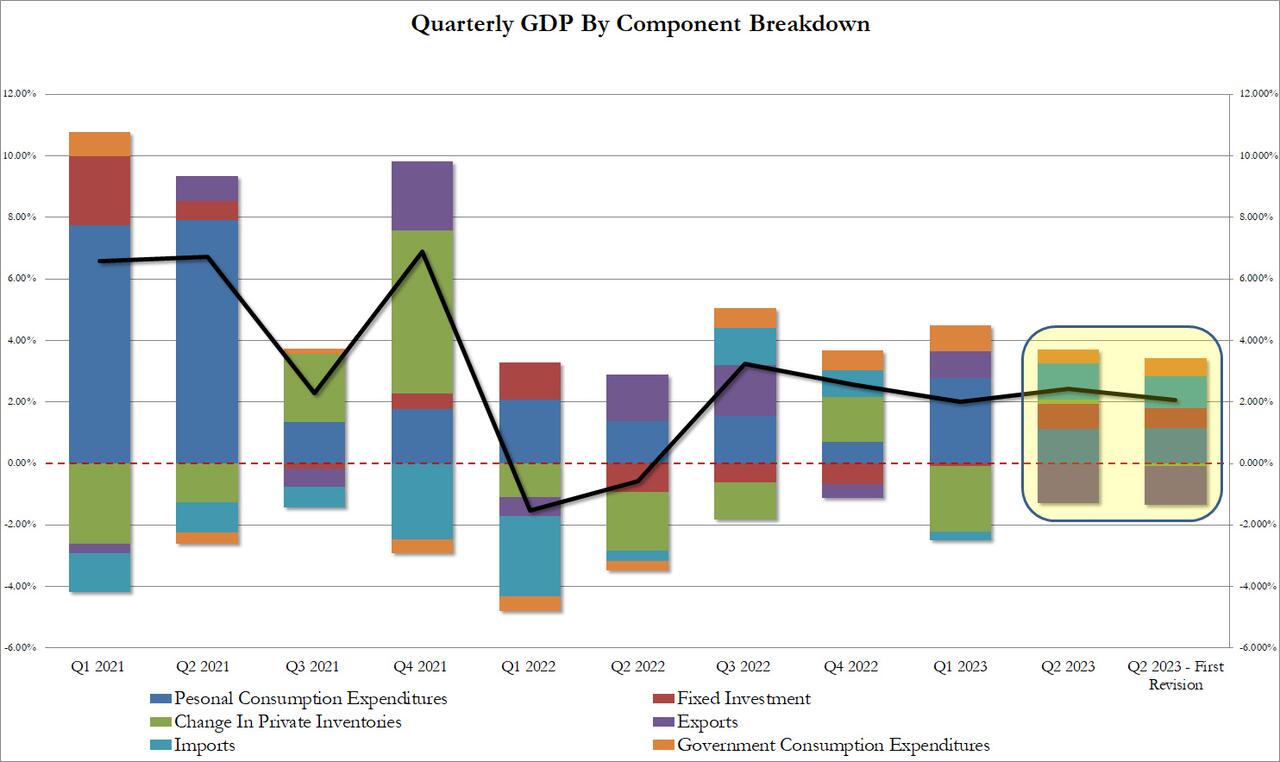
The GDP estimate released today is based on more complete source data than were available for the “advance” estimate issued last month. In the advance estimate, the increase in real GDP was 2.4 percent (refer to “Updates to GDP”). The updated estimates primarily reflected downward revisions to private inventory investment and nonresidential fixed investment that were partly offset by an upward revision to state and local government spending.

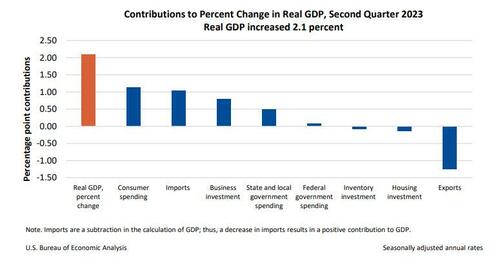
The increase in real GDP reflected increases in consumer spending, nonresidential fixed investment, state and local government spending, and federal government spending that were partly offset by decreases in exports, residential fixed investment, and private inventory investment. Imports, which are a subtraction in the calculation of GDP, decreased.

The revision according to the BEA, “reflected a smaller decrease in inventory investment and an acceleration in business investment. These movements were partly offset by a downturn in exports and decelerations in consumer spending and federal government spending. Imports turned down.”  In short, everything was uglier,

Taking a closer look at the data, we find the following changes to the bottom line:

  • Personal consumption added 1.14% to the bottom line print or just over half, up from 1.12% in the original print; annualized this comes out to 1.7% which was below the 1.8% estimate.
  • Fixed investment contributed 0.66%, down from 0.83%
  • Change in private inventories now subtracting 0.09% from the bottom line number, a big swing from the positive 0.14% print in the original estimate. And it will be revised even lower next month as more of the “shrink” emerges.
  • Net exports were  also revised lower, with gross exports trimmed from -1.28% to -1.26%, while imports were revised from 1.16% to 1.04%
  • Finally the ever handy plug that is government consumption (which is a garbage concept since the government does not actually create anything of economic value in the economy but merely allocated graft and embezzlement of public funding), actually rose from 0.45% to 0.58% (of bottom line GDP). Without this revision, Q2 GDP would have printed below 2.0%

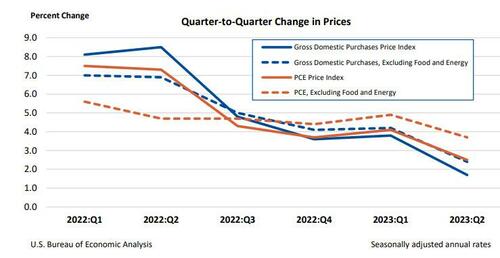
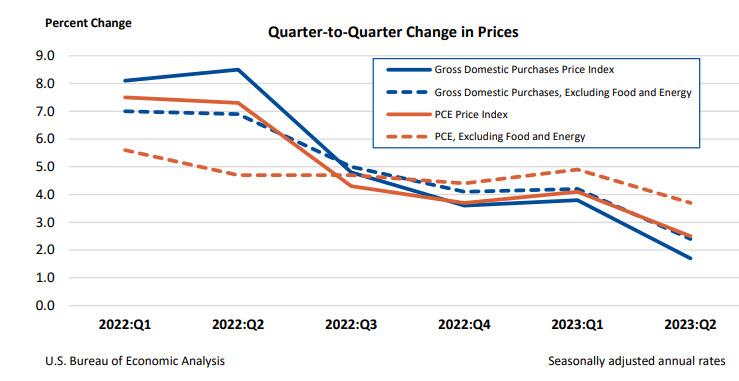
Separately, gross domestic purchases prices, the prices of goods and services purchased by U.S. residents, increased
1.7% in the second quarter after increasing 3.8 percent in the first quarter, above the 1.6% estimate last month but below the consensus 1.8%. Excluding food and energy, prices increased 2.4% after increasing 4.2%.

Personal consumption expenditure (PCE) prices increased 2.5% in the second quarter after increasing 4.1% in the first quarter. Excluding food and energy, the PCE “core” price index increased 3.7% after increasing 4.9%. This number was also revised lower from 3.8% and missed estimates of 3.8%.

Finally, the BEA reported corporate profits decreased 0.4% at a quarterly rate in the second quarter after decreasing 4.1% in the first quarter. Profits of domestic financial corporations decreased 12.1% after decreasing 2.3 percent. Profits of domestic nonfinancial corporations increased 0.9% after decreasing 5.0 percent. Profits from the rest of the world (net)increased 4.4 percent after decreasing 2.0 percent. Corporate profits decreased 6.5 percent in the second quarter from one year ago.

Needless to say, all this is a far cry from the rebound in corporate profits that companies themselves reported in their various GAAP and non-GAAP metrics, which is to be expected in a world where there is now an uncrossable chasm between economic data and its government fabrications.

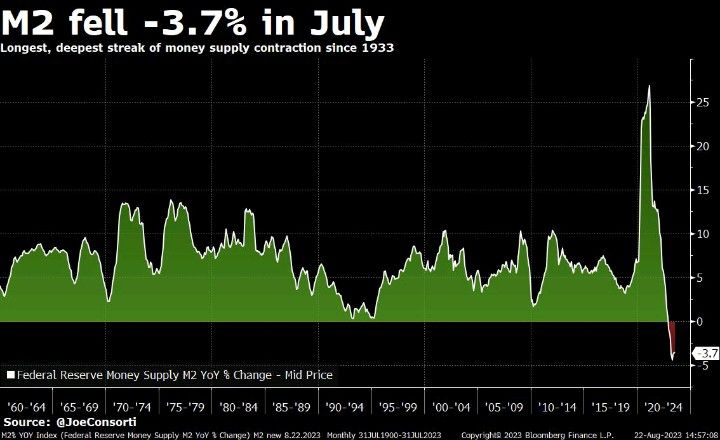
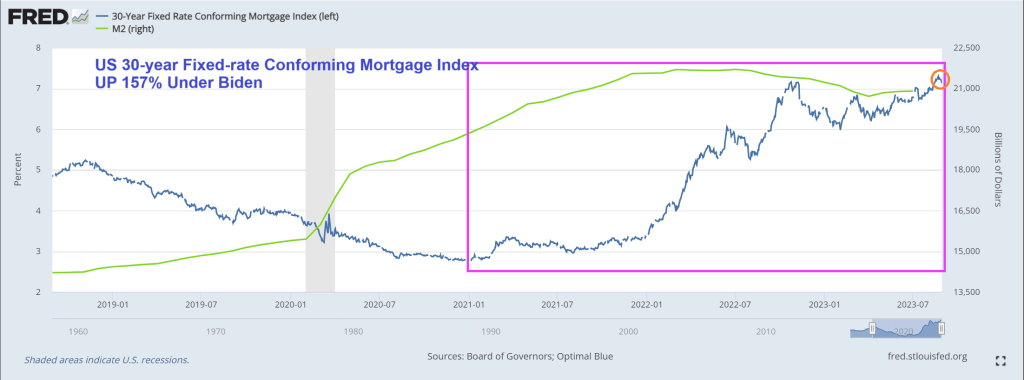
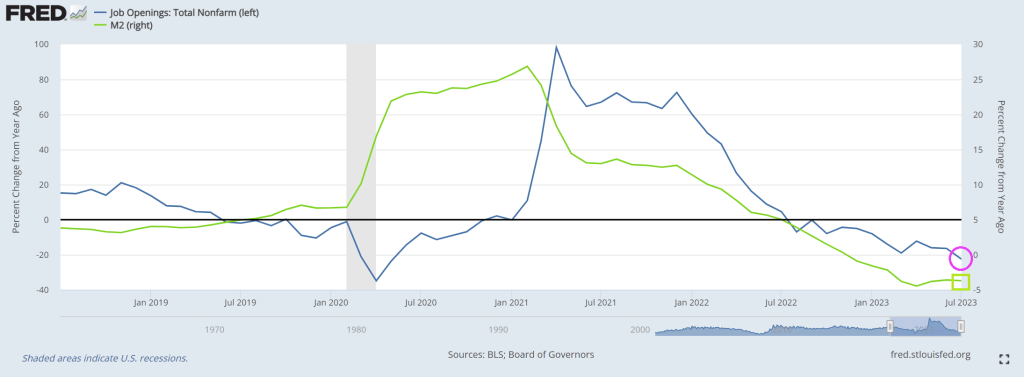
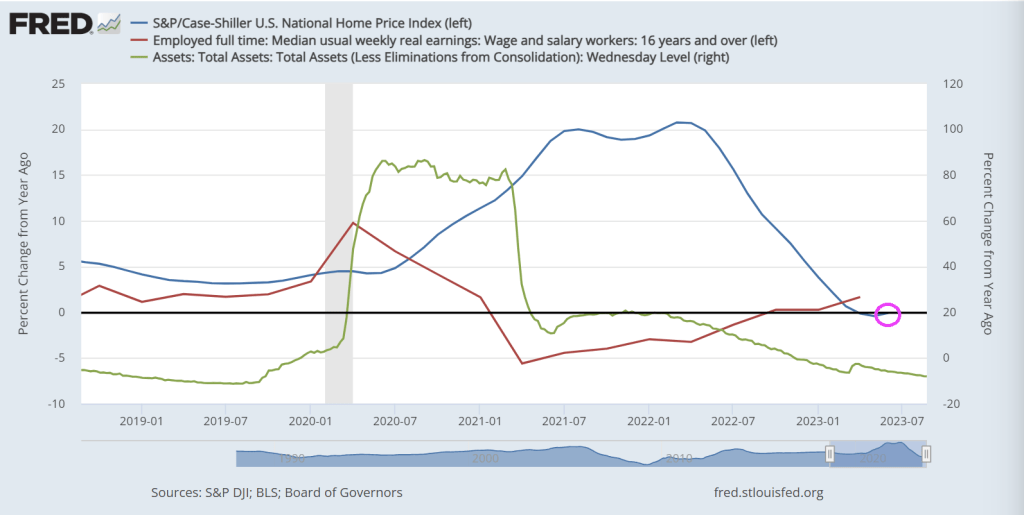
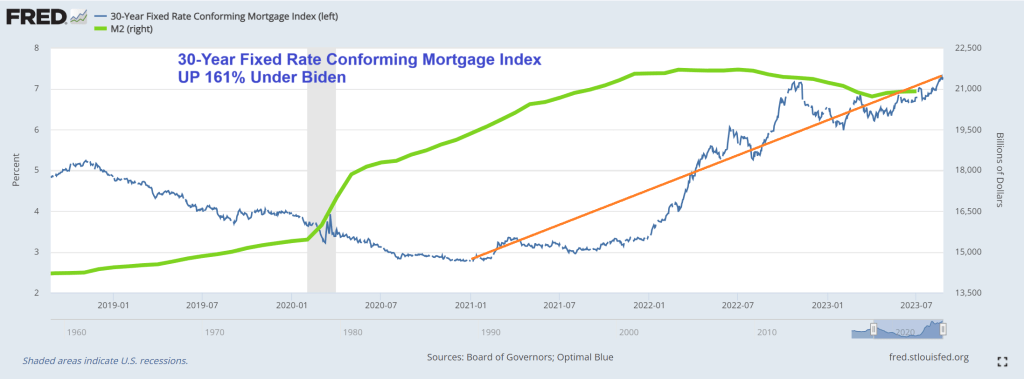
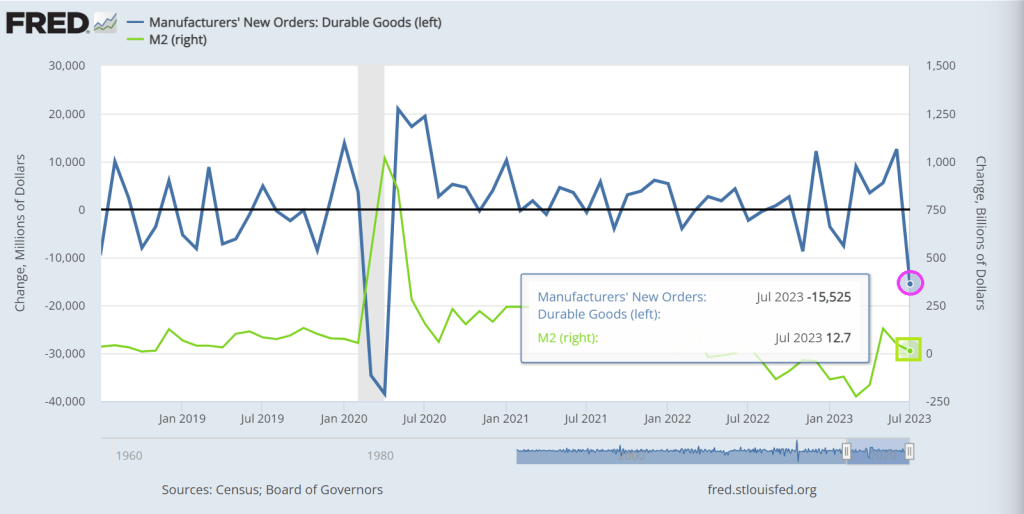
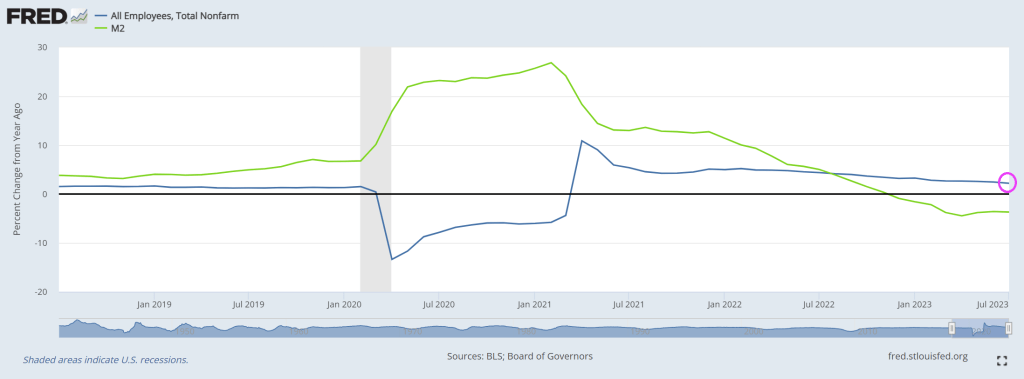
Then we have M2 Money collapsing, down -3.7% in July. Longest, deepest contraction of money suppy since 1933.

Biden, making Zelenskyy rich again!! The US bought Zelenskyy a new villa! “The document indicates that the villa was purchased by Zelenskyy’s mother-in-law in May 2023. The price of the villa is 150,000,000 Egyptian pounds or approximately $4,850,000.” Thanks Biden!!! America last!

Bidenomics At Work! US Purchase Mortgage Demand Decreased 0.3% Since Last Week, Down -27% Since Last Year (Mortgage Rate UP 157% Under Biden)

I wonder if Biden will use his writeboard to brag about the 30-year mortgage rate rising 157% under his economic Reign on Error? Aka, Bidenomics.

Mortgage applications increased 2.3 percent from one week earlier, according to data from the Mortgage Bankers Association’s (MBA) Weekly Mortgage Applications Survey for the week ending August 25, 2023.

The Market Composite Index, a measure of mortgage loan application volume, increased 2.3 percent on a seasonally adjusted basis from one week earlier. On an unadjusted basis, the Index increased 1 percent compared with the previous week. The Refinance Index increased 3 percent from the previous week and was 28 percent lower than the same week one year ago. The seasonally adjusted Purchase Index increased 2 percent from one week earlier. The unadjusted Purchase Index decreased 0.3 percent compared with the previous week and was 27 percent lower than the same week one year ago.

Bidenomics Gets Jolted! US Job Openings Fall To 8.82 Million In July (Down -22.4%) As M2 Money Growth Collapses

Bidenomics just got jolted! US job openings in July collapsed by -22.4% to 8.82 million job openings. As M2 Money growth remains negative.

You can see the same collapse in growth of job openings in this chart.

Apparently, Powell and The Gang at The Federal Reserve have to keep on printing!

Here is alleged Civil Righter advocate Joe Biden saying the N- word in Congress. I can’t believe this stupid, demente fool is our President.

.

Bizarro World! Case-Shiller National Home Price Index Flat For June, But SF Falls -9.7% YoY And Seattle Falls -8.8% While Chicago And Cleveland Lead The Nation!

The US housing market is truly bizarro world! San Francisco and Seattle are down near 10% year-over-year (YoY) while Chicago and Cleveland lead in price gains.

The S&P CoreLogic Case-Shiller U.S. National Home Price NSA Index, covering all nine U.S. census divisions, reported 0.0% annual change in June, up from a loss of -0.4% in the previous month. The 10-City Composite showed a decrease of -0.5%, which is an improvement on the -1.1% decrease in theprevious month. The 20-City Composite posted a year-over-year loss of -1.2%, up from -1.7% in the previous month.

Notice that The Fed’s balance sheet is slowly unwinding (green line) and real weeky “usual” earnings are finally positive after two long years of decline (red line). No growth or loss in home prices at the national level.

How about at the metro level? Chicago, Cleveland, and New York again led the way reporting the highest year-over-year gains among the 20 cities in June. Chicago remained in the top spot with a 4.2% year-over-year price increase, with Cleveland in at number two with a 4.1% increase, and New York held down the third spot with a 3.4% increase. There again was an even split of 10 cities reporting lower prices and those reporting higher prices in the year ending June 2023 versus the year ending May 2023; 13 cities showed price acceleration relative to the previous month.

But The West is where home prices fell and fell hard. The biggest losers were San Francisco (-9.7% YoY) and Seattle (-8.8% YoY). Bubble cities of Phoenix (-7..5% YoY) and Las Vegas (-8.2% YoY) round out the four biggest losers in the nation.

The really interesting chart show the surge in home prices following The Great Recession of 2008 and ensuing financial crisis and post Covid. Of course, the commonality in the surge is the massive expansion of money supply thanks to a hyperactive Federal Reserve.

The puppetmaster of bizarro world? The Federal Reserve!

Livin’ La Vida Bidenomics! US Conforming Mortgage Rate Up 161% Under Biden, Home Prices UP 26%, Real Median Weekly Earnings DOWN -5%

We are livin’ la vida Bidenomics!

The 30-year conforming mortgage rate is currently 7.23%, up 161% under Biden and Bidenomics (code for massive Federal spending on green initiatives that go to large Democrat donors and Ukrainian oligarchs). Meanwhile, M2 Money supply is up 9.4% under Biden.

At the same time. home prices are UP 26% under Biden while Real Median Weekly Earnings are DOWN -5%.

On a sad note, it looks like The Federal government is starting to rattle its Covid saber just in time for the 2024 Presidential election. Odds are the US will ramp up online voting, early voting, etc. Think of John Fetterman (aka, Walter White’s twin brother) and the Pennsylvania voting experience.

Team Biden!

Simply Unaffordable! Home Affordability Worst Since 1984 (Home Prices UP 26% Under Biden While REAL Median Weekly Earnings DOWN -5%)

As Robert Palmer nearly sang, US housing is simply unaffordable.

If we look at the Case-Shiller National home price index against real weekly wage growth, you can see the problem clearly. Since Covid and The Fed’s overreaction by providing staggering monetary stimulus, home prices shot up while real median weekly earnings collapsed.

Buying a house requires a much bigger slice of people’s income now — making this the most unaffordable housing market since 1984, by one measure.

And that crushing lack of affordability isn’t expected to improve much in the near future.

In just the last few weeks, US home prices rose for the first time in months and the 30-year fixed mortgage rate hit a 22-year high of 7.23%.

That has made what was already a dismal affordability picture even worse.

At today’s rates, buying a median-priced home would require a monthly principal and interest payment of $2,440 for those making a 20% down payment, according to Black Knight, a mortgage technology and data provider.

The rising cost of shelter represented 90% of last month’s inflation.

That’s $1,172 a month more in mortgage payments from just two years ago, before the Federal Reserve raised its benchmark lending rate 11 times in 18 months, Black Knight found. It’s a 92% increase — and is taking a growing chunk out of household budgets already facing inflation on many fronts.

Currently, 38.6% of the median household income is required to make the monthly payment on the average home purchase, making housing the least affordable it’s been since 1984, according to Black Knight.

“To put today’s affordability levels in perspective, it would take some combination of up to a 28% decline in home prices, a more than 4% reduction in 30-year mortgage rates, or up to a 60% growth in median household incomes to bring home affordability back to its 25-year average,” said Andy Walden, vice president of enterprise research and strategy at Black Knight.

Must as well face it, we’re addicted to gov. Or at least Fed monetary stimulus.

Just look at Personal Interest payments under Bidenomics.

The themesong for Bidenomics should be “Let’s Go Crazy” with spending … on green donors!

Biden and Powell probably sing “Hurt so good!”

Household Essentials Cost Far More Under Bidenomics! Gasoline Prices Up 72%, Rent Of Primary Residence Up 16%, Food At Home Up 20% Under Biden! (30Y Mortgage Rate UP 163% Under “Middle Class Joe”)

Middle class Joe my ^%&!

Joe Biden will always be remembered for lying about never raising taxes on households making under $400,000. Inflation is a permanent tax, mostly on those making under $400,000 per year. And household essentials are up substantially under Biden: gasoline prices are up 72%, rent CPI of Primary Residence is up 16%, and food at home CPI is up 20%! That is a HUGE tax on the middle class.

When mainstream economists and politicians cite “improvements” to the inflation problem in the US in recent months, what they are commonly referencing are changes to the Consumer Price Index (CPI).  However, the CPI is not a measure of total inflation, rather, it is a median snapshot of prices at a particular point and time.  True inflation is cumulative – A 10% increase one year and a 5% increase the next year is not a win, it means that you are now paying 15% more on average for everything you buy in the span of only two years.   

When CPI falls this does not mean that prices on goods and services are going down, it only indicates that prices are rising slower than they were the month or the year before.

Another misconception about CPI is that it measures the inflation rate accurately for regular consumers on common purchases.  In reality, the CPI represents mean average price rate increase for a vast basket of goods; over 94,000 items and services with over 200 separate categories.  Most of these items and services you will never use or rarely purchase in the span of a year.  In other words, inflation declines in uncommon goods can dilute the numbers, making it seem like inflation is dropping while prices on daily necessities continue to spike.  

The CPI is weighted according to consumer spending patterns, which is where the calculations can be “adjusted” to a certain extent in an arbitrary manner.  Then there is outright government manipulation through various means.  As we witnessed recently with the Biden Administration’s claims that “Bidenomics” has defeated the inflation threat, what these reports don’t mention is that Biden has been dumping US strategic oil reserves on the market for the past year.  And since energy prices effect the inflation of so many other categories, Biden has artificially manipulated the CPI down using one key resource.  

Now that his ability to dump oil reserves has ended, CPI will rise once again along with energy prices.

The point is, it’s impossible to get a sense of the real damage from inflation without looking at the cumulative inflation in necessities (the goods and services that people are required to purchase on a regular basis to live day to day).  If we throw out the CPI distraction and look at common necessities since 2020, the economic picture is far more bleak.  

Overall food prices have soared by 25%-30% in only three years (again, this means that you are now paying 30% more this year for food than you were paying at the beginning of 2020). Chicken is up from $3 per pound to $4 per pound.  Beef is up from $3.50 to $6 per pound.  Corn is up from $3.50 per pound to $4.70 per pound.  Wheat is up from $5 per pound to $7 per pound.  In 2019 the average American household was spending $8100 on food annually; with a 30% increase, in 2023 Americans will be spending at least $10,500 per household.          

By the end of 2019, the average rental price of a single family home was around $1450 per month.  This year the price is around $2000 per month.  At the beginning of 2020, the median cost of a home was $320,000; by 2023 the price skyrocketed to an average of $416,000.  

For gasoline, the price in early 2020 was around $2.50 per gallon.  The price has fluctuated dramatically due to Biden’s manipulation of the market using strategic reserves, but still remains high today at $3.80 per gallon.  

The cost of electricity has risen swiftly, holding steady around .13 cents per kilowatt hour for a decade, then spiking to at least .17 cents per kilowatt hour by 2023.

Remember, most of these costs are static and are difficult to reduce through household spending cuts.  These are not items that are easily removed from a monthly budget and the expenditures add up to considerable pressure on consumer accounts.  This is probably why around 74% of the public in polls say that the economy is getting worse, not better.  It’s because government statistics are not highlighting the true inflationary crisis.

When we look at the cumulative climb of prices in necessities since before the inflation crisis officially began, the truth is that Americans now have to increase their wages by at least 25%-30% on average to maintain the same standard of living they had three years ago.  This is a disaster not seen since the stagflationary event of the 1970s and early 1980s.  If you have a strange feeling like your bank account is being rapidly drained in recent months, that’s because it is.    

And the 30-year mortgage rate is up 163% under Middle Class Joe.

Thrill Is Gone … From Bidenomics! US Durable Goods Orders Fall -15.23% From June To July While Fed M2 Money Grew 12.7% (Turning Back On The Money Machine!)

The Thrill Is Gone … from Bidenomics.

July durable goods [blue] new orders plummet, recording the worst month since C19 in April 2020. Durable goods fell on a MoM basis by -5.2%, versus -4% consensus estimate. Durable goods ex-transportation [orange] still rose on a MoM basis by +0.5%, perhaps highlighting the weakness in durable goods orders.

Ex-transportation, durable goods order rose slighlty in July by 0.5%.

But according to The Fed of St Louis, durable goods new orders were down -15.525% from June to July (MoM) while M2 Money printing growth rose 12.7% MoM.

The KC Fed’s symosium in Jackson Hole WYO is underway and The Fed’s money machine is firingg up again. Here is the evil spirit of Statism speaking at Jackson Hole.

Bidenomics! US Payrolls Were Likely 306,000 Lower Than Previously Estimated (July Jobs Growth Slowed To 2.2% YoY As M2 Money Growth Slowed To -3.7% YoY)

  • Preliminary benchmark revision smaller than some had projected
  • Biggest payrolls adjustment in transportation and warehousing

Are you surprised that the Biden Administration has been lying about job creation?? Not really since Biden compulsively lies about everything. Including his corruption.

US job growth was probably less robust in the year through March than previously reported, according to government data released Wednesday.

The number of workers on payrolls will likely be revised down by 306,000 for March of this year, according to the Bureau of Labor Statistics’ preliminary benchmark revision.

Even without the revision, job growth has slowed to 2.2% YoY in July as M2 Money growth slowed to -3.7% YoY.

Let see what our Overlords say at the Jackson Hole Fed symposium.

Burning Down The Housing Market! Mortgage Demand Decreased in Weekly Survey Purchase Applications “Lowest Level Since April 1995”

The Talking Heads said it best. Bidenomics is burning down the housing market. Bidenomincs (or trying to recover from Yellenomics) is responisble for interest rates rising to flight inflation and the collapse of mortgage lending. And she was … Janet Yellen.

Mortgage demand (applications) decreased 4.2 percent from one week earlier, according to data from the Mortgage Bankers Association’s (MBA) Weekly Mortgage Applications Survey for the week ending August 18, 2023.

The Market Composite Index, a measure of mortgage loan application volume, decreased 4.2 percent on a seasonally adjusted basis from one week earlier. On an unadjusted basis, the Index decreased 6 percent compared with the previous week. The Refinance Index decreased 3 percent from the previous week and was 35 percent lower than the same week one year ago. The seasonally adjusted Purchase Index decreased 5 percent from one week earlier. The unadjusted Purchase Index decreased 7 percent compared with the previous week and was 30 percent lower than the same week one year ago.

The spread betweenn Bankrate’s 30 year rate at 7.62% and the effective rate on mortgage debt outstanding at 3.595% has exploded as mortgage rates jump.

Today’s mortgage rates are up to 7.49%. OMG!

Bidenomics (code for making large donors wealthier and the middle class getting the boot) and catch-up for Yellenomics (rates too low for too long), and Powell are helping to burn down the housing market.