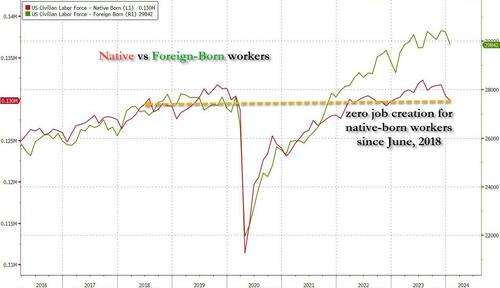
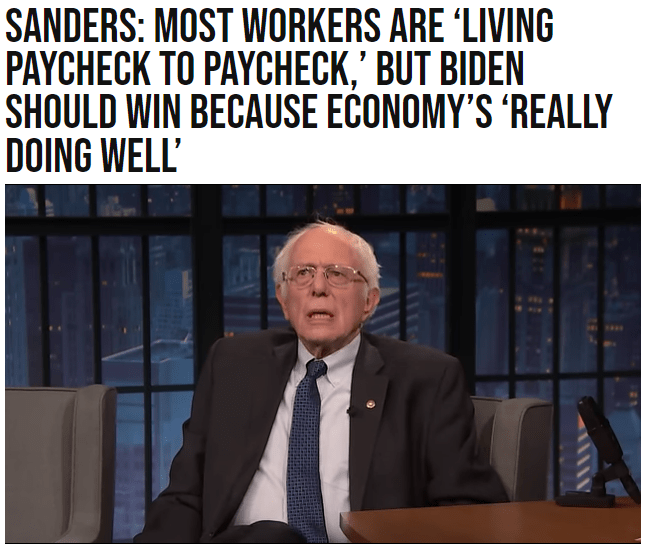
As soon as Joe Biden started bragging on his low-energy campaign trail about inflation declining I knew it would go up. And it is increasing again.
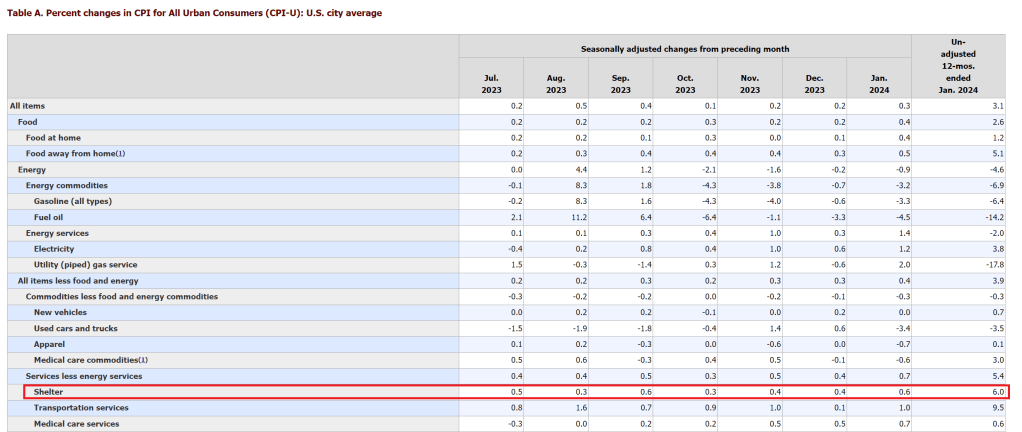
Shelter cost (aka, housing) is still growing.
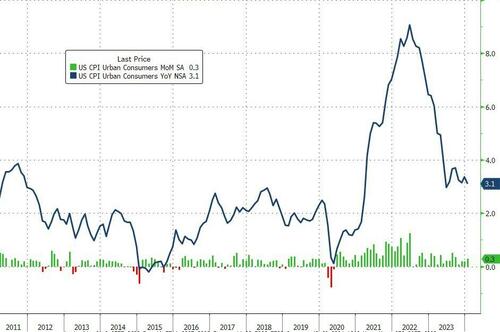
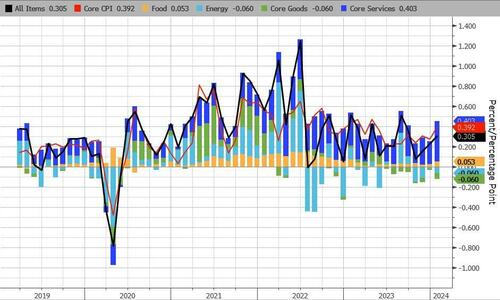
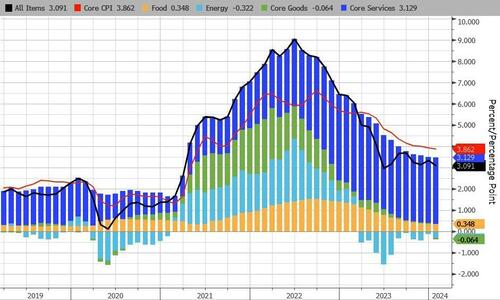
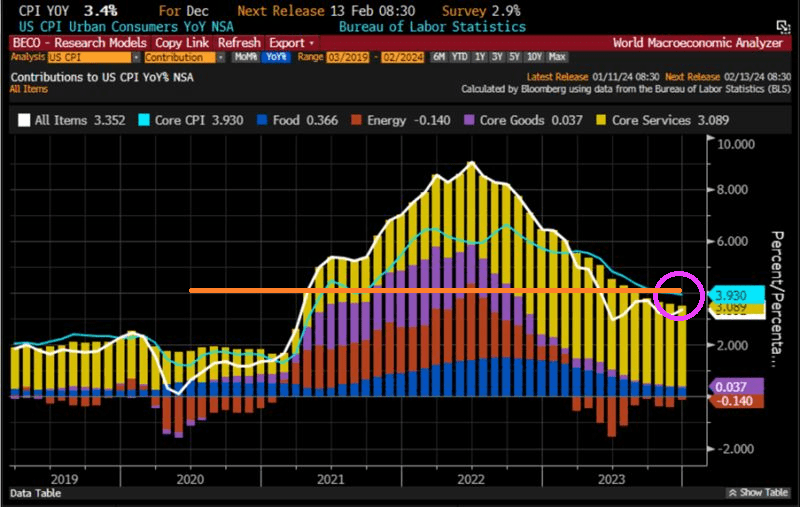
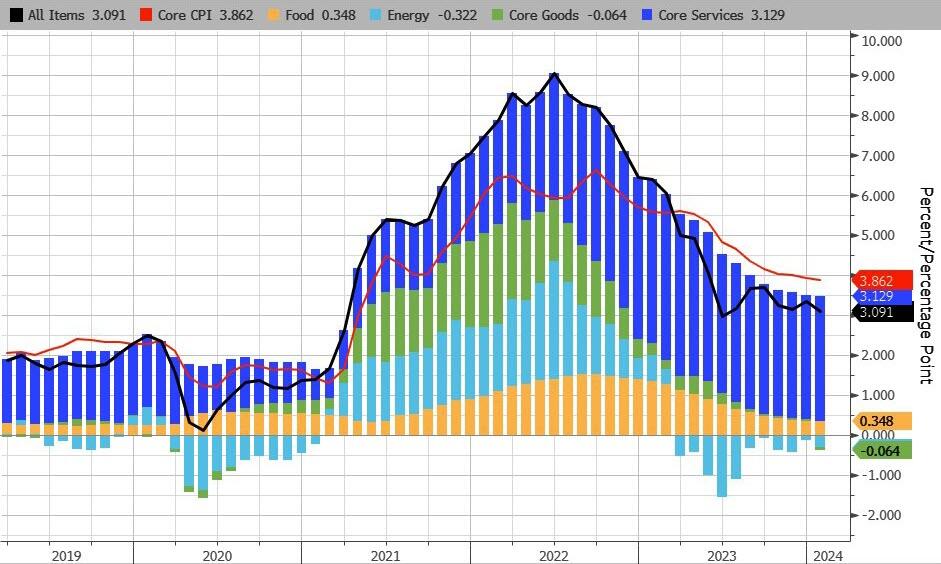
Expectations were for a big drop in the YoY consumer price index (from +3.4% to +2.9%) but instead it surprised to the upside (just as we warned) with a +3.1% YoY print for headline CPI (spoiling the sub-3% partiers). Consumer prices rose 0.3% MoM (more than the 0.2% exp) but the headline did decline from +3.4% to +3.1% YoY…
Source: Bloomberg
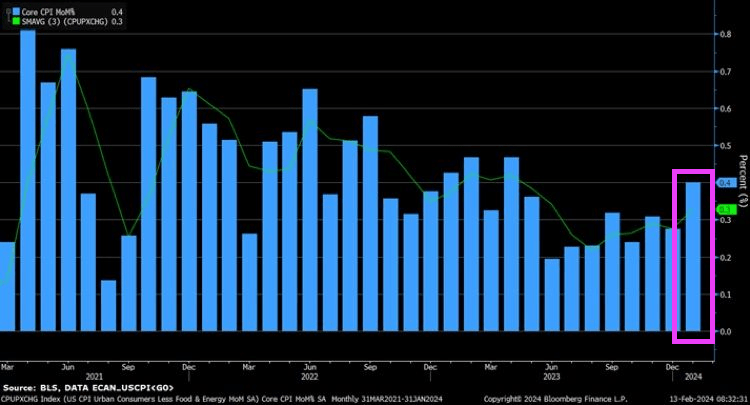
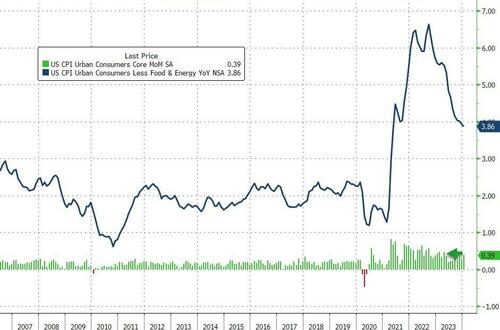
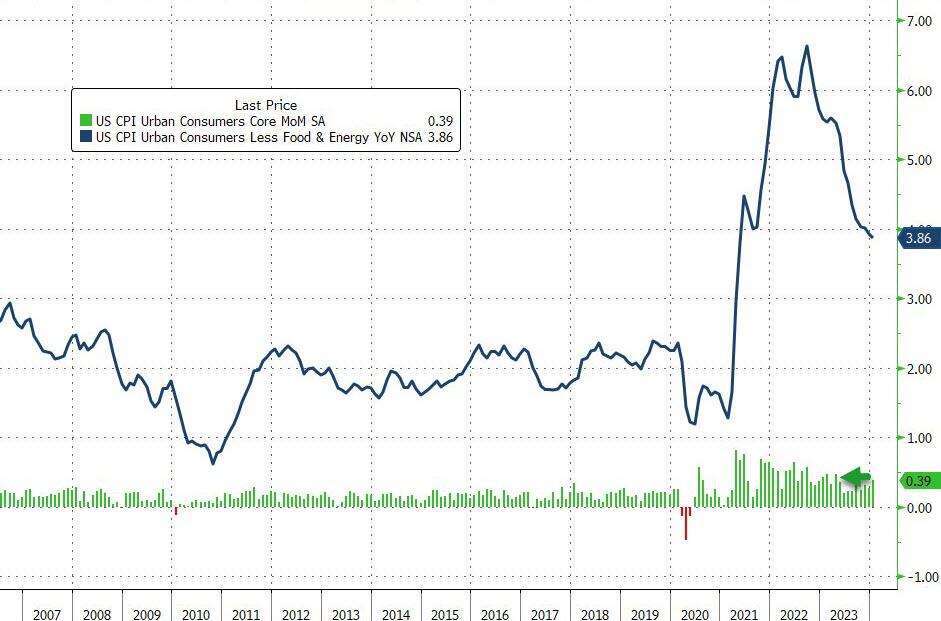
Core CPI fell below 4.00% YoY for the first time since May 2021, but the +3.86% YoY print was hitter than the 3.7% exp (with prices rising 0.4% MoM – the biggest jump since April 2023)…
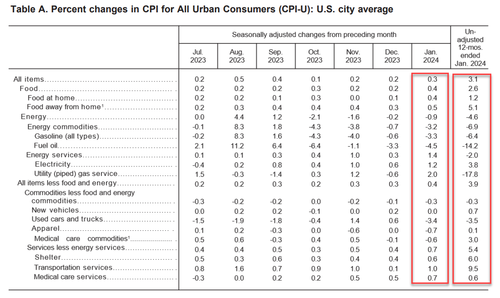
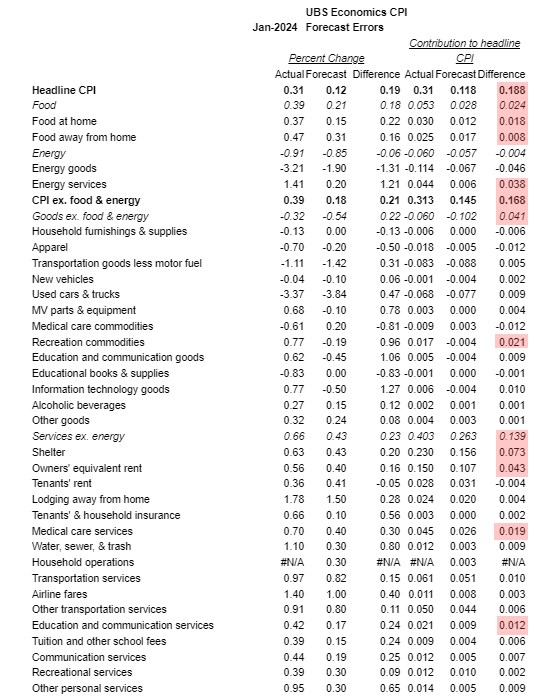
CPI Core: The index for all items less food and energy rose 0.4 percent in January.
- The shelter index increased 0.6 percent in January, and was the largest factor in the monthly increase in the index for all items less food and energy.
- The index for owners’ equivalent rent rose 0.6 percent over the month, while the index for rent increased 0.4 percent.
- The lodging away from home index increased 1.8 percent in January. The motor vehicle insurance index increased 1.4 percent in January, and the recreation index rose 0.5 percent in January.
- Among other indexes that rose in January were communication, personal care, airline fares, and education.
- The medical care index rose 0.5 percent in January.
- The index for hospital services increased 1.6 percent over the month and the index for physicians’ services increased 0.6 percent.
- The prescription drugs index fell 0.8 percent in January.
- The index for used cars and trucks fell 3.4 percent in January.
- The index for new vehicles was unchanged in January.
- The apparel index also decreased, falling 0.7 percent over the month.
Core Service inflation picked up MoM…
Under the hood, food and Energy services costs jumped MoM along with transportation services…
Here’s the biggest component upside surprises…
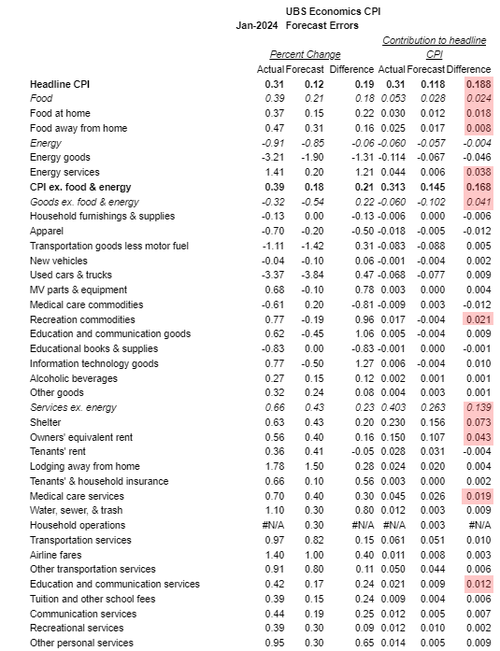
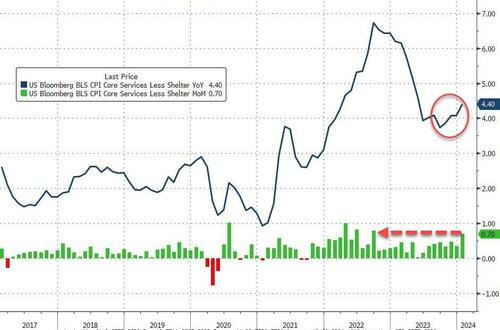
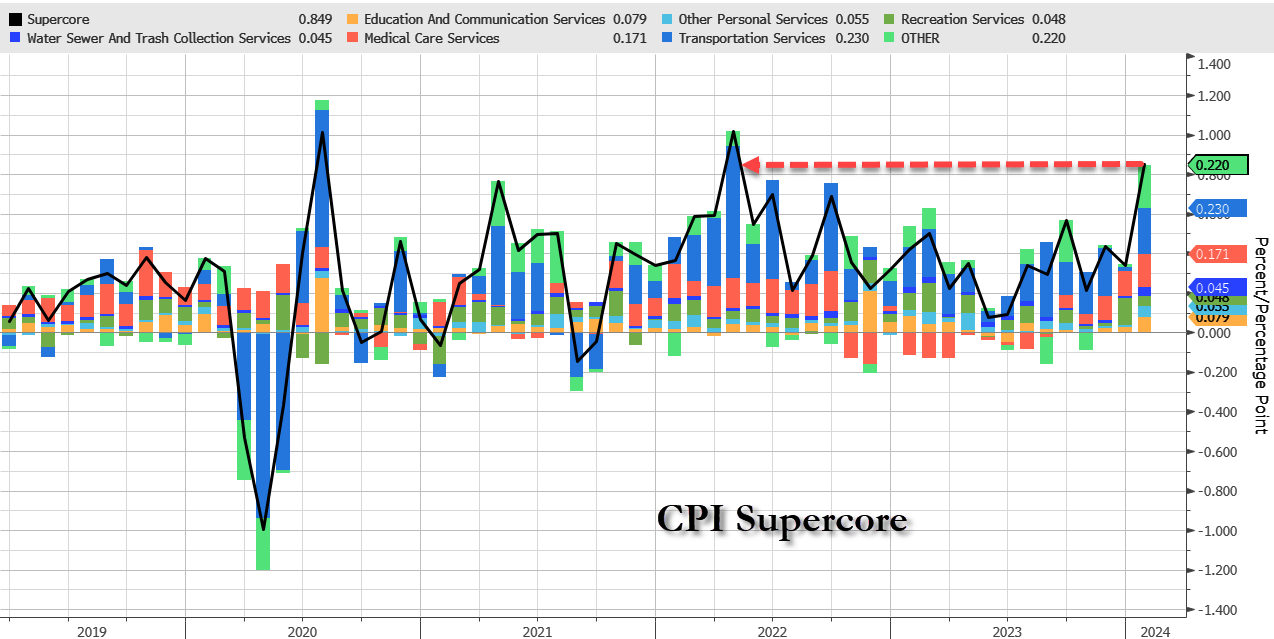
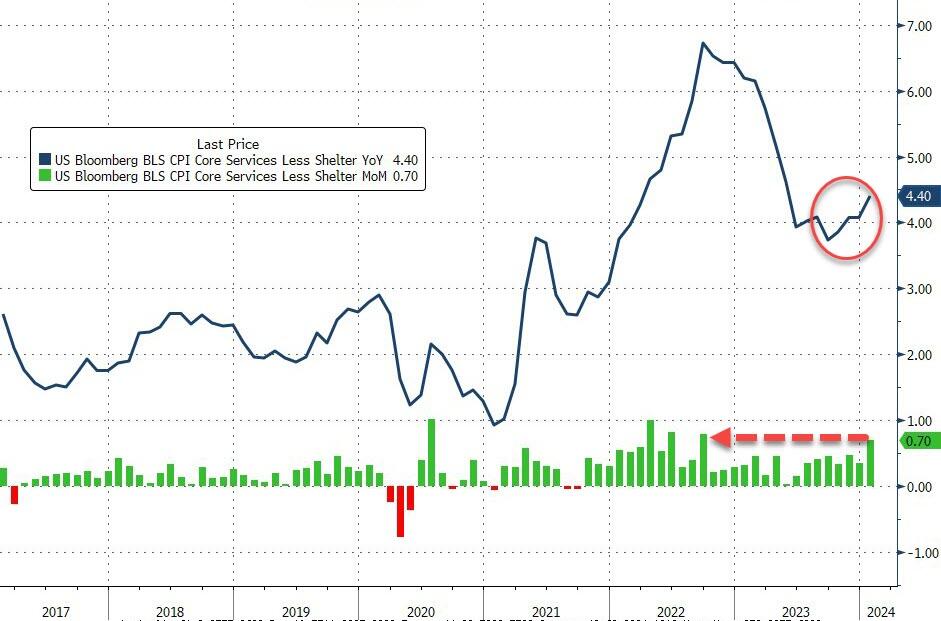
And one step deeper – the so-called SuperCore: Core CPI Services Ex-Shelter index – soared 0.7% MoM (the biggest jump since Sept 2022…

… driving the YoY change up to +4.4% – the hottest since May 2023….
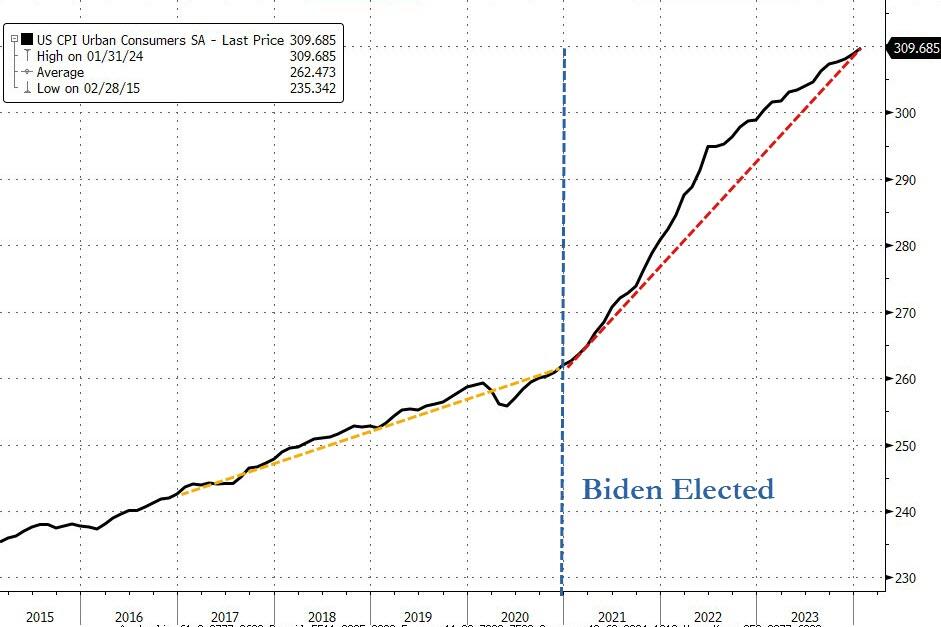
Finally, as a reminder, lower inflation does not mean lower prices.
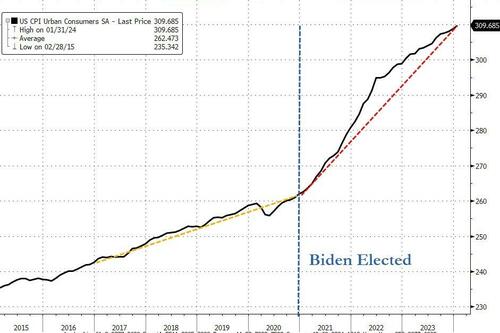
The actual index of consumer prices hit a new record high this month – and is up over 18% since President Biden’s term began (it was up 8% over President Trump’s full four year term).
And it gets worse…
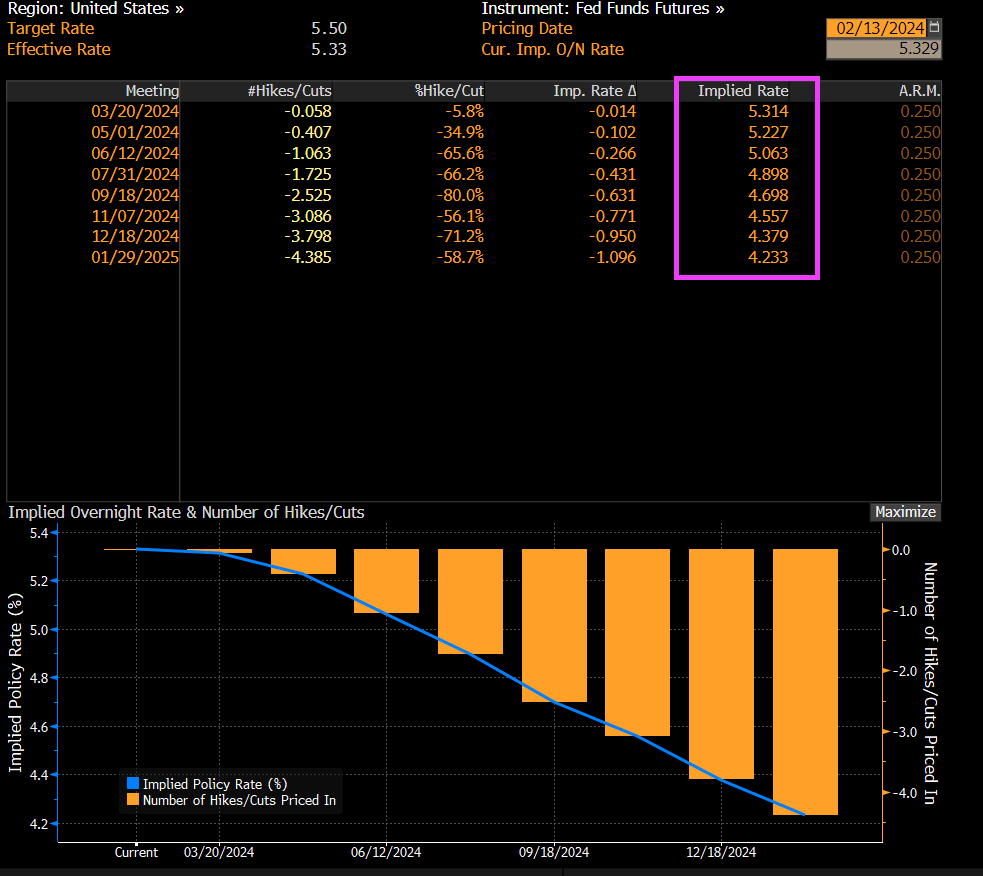
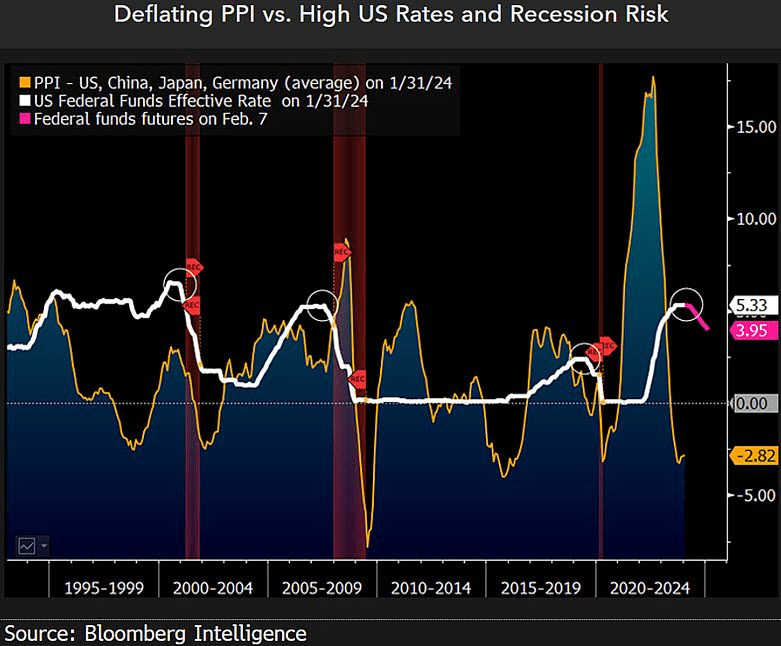
And on the higher than expected inflation report, we are still seeing bets on Fed Funds rate falling from 5.50% to 4.233% over the coming year.
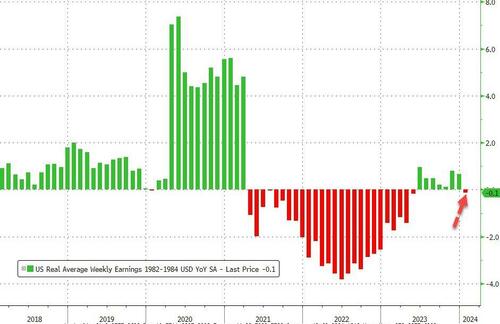
The re-accleration of inflation means wage growth is back in the red relative to prices.


You must be logged in to post a comment.