Today’s US industrial production and capacity utilization numbers showed a nice “steady as she goes” slow decline from previous months, though still positive at 3.90% YoY.
And it is difficult to argue that the US is in a recession when capacity utilization is at 80.27%.
Notice that industrial production growth falls below 0% during a recession and capacity utilization slumps. We are NOT there … yet.
However, M2 Money growth is shrinking awfully fast.
While the US is technically in default (two consecutive quarters of negative GDP growth), it doesn’t FEEL like a recession with 3.90% YoY industrial production growth and capacity utilization above 80%. During the Covid recession in early 2020, industrial production growth YoY had declined to -17.65% and capacity utilization shrank to 64.53%.
Speaking of a recession SIGNAL, the 10Y-2Y Treasury yield curve is SCREAMING impending recession.
The 2020 Covid outbreak led to a massive (and generally awful) reaction. There were economic shutdowns that caused extensive damage (particularly to small firms), but it was the massive overreaction by The Federal government in terms of Covid relief and The Federal Reserve’s expansion of the money supply that caused considerable damage.
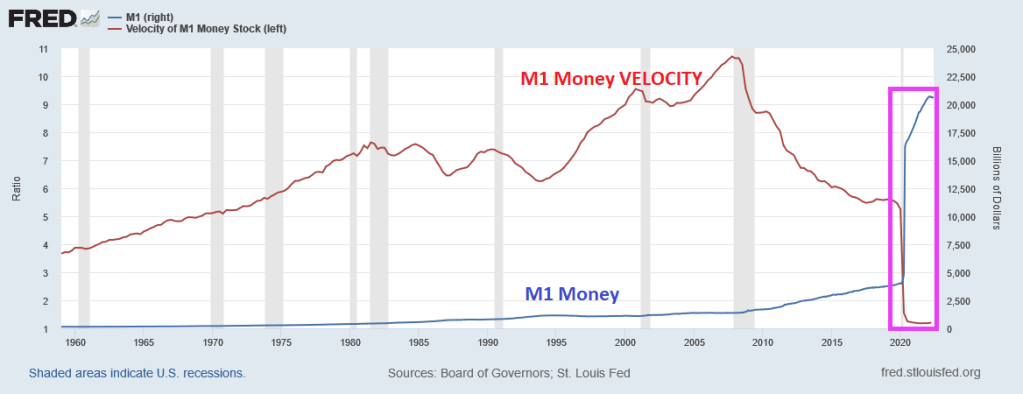
One truly horrific chart is that of M1 Money and M1 Money Velocity (M1/GDP). M1 Money surged with Covid driving M1 Money Velocity down to levels never seem before.
The broader measure of money, M2, isn’t as dramatic, but we also see that M2 Money VELOCITY has plunged to levels never seen before.
What does low money velocity indicate? Simply put, The Fed is printing trillions of dollars, but GDP isn’t moving much. But that won’t stop Congress from spending (and using The Fed to buy its debt).
So, here we sit. This morning, the US Treasury yield curve (10Y-2Y) remains inverted. This AM, the curve inverted another -.591 basis points to -42.725, a sign of impending recession.
Yes, we are living through Jay Powell’s famous chili episode where money velocity is near historic lows and we have an inverted yield curve.
BTW, congratulations to Will Zalatoris (aka, Happy Gilmore’s caddy) for his first PGA Tour victory at the FedEx St. Jude Championship!
Politicians like to (falsely) take credit for things, such as Biden bragging about gasoline prices declining. Bear in mind that regular gasoline prices were $2.88 when Biden was inaugurated as President, rose to over $5 a gallon in June and now have declined to $3.98 for which Biden is taking credit. So, regular gasoline prices are still up 34% under Biden. Ouch!
But other rates and prices are dropping too. Bankrate’s 30yr mortgage rate started at , broke the 6% plane on June 21, 2022 only to drop to 5.53% on Friday. CRB’s foodstuffs price index started at 370.58 on Biden’s inauguration as President, rose to 606.71 on May 17, 2022 then retreated to 561.32 on Friday, August 13th. Even headline inflation (CPI YoY) is cooling … slightly.
You can see the recent declines in mortgage rates, gasoline and food prices (pink box) that corresponds to a shrinking of the US M2 Money stock growth. M2 Money is still growing at torrid pace (8.5% YoY) almost back to pre-Covid stimulypto levels of 6.8% YoY. So shrinking M2 Money growth is helping reduce mortgage rates and inflation, food/gasoline prices.
Instead of trying to remove Fed stimulus even more, Biden and Congress passed the “Inflation Reduction Act” which will barely scratch inflation and raises taxes across the board (despite Biden’s promise that no one making under $400,000 will see a cent of increase taxes). And Biden’s preposterous promise ignores the inflation tax which has been severe and still growing at 8.5% YoY. Not 0% as Biden and Harris claimed.
But wait for winter as food, gasoline and heating prices start to soar again.
My favorite dim-witted explanation of inflation belongs to Democrat Representative Pramila Jayapal who recently claimed that “inflation is a theoretical word that economists use.” Like the brilliant Milton Friedman???
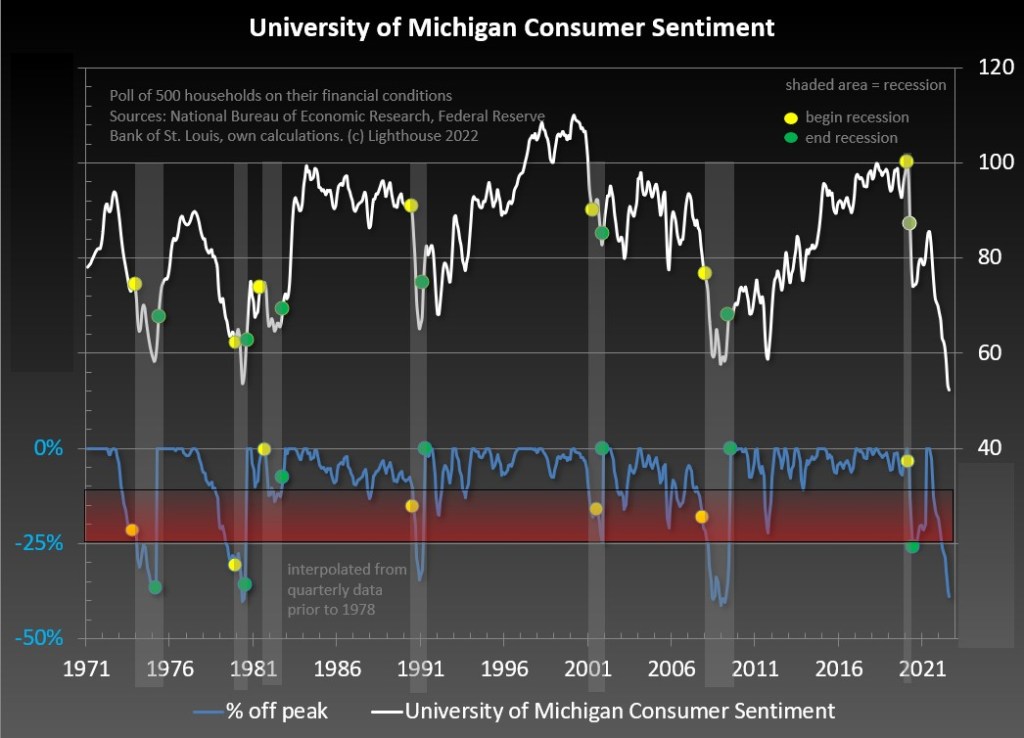
The University of Michigan consumer survey is out for August and the results show improvement … from disastrous to just plain horrible.
The University of Michigan Buying Conditions for Houses remained depressed and didn’t improve.
Bear in mind that today’s consumer sentiment reading in the lowest since 1970, lower than during any recession.
The Conference Board’s leading economic indicator plunged in June despite nearly $8 trillion in Fed stimulus still outstanding.
The good news? President Biden and his son Hunter boarded Air Force One for a carbon-spewing plane trip to South Carolina for a one-week vacation. At least he can do less damage to the US while on vacation.
I scratch my head when I here Fed talking heads discuss how to get inflation back down to 2%.
Of course, the easiest way is to 1) remove Biden’s anti-fossil fuel executive orders that limit the supply of crude oil and natural gas, but that isn’t going to happen. 2) stop Federal spending, but Manchin and Sienma enabled Biden/Schumer/Pelosi’s “drunken sailors in port” spending sprees, so Federal spending is likely to not be stopped. 3) raise taxes (Larry Summer’s suggestion) to cool-off demand. And give MORE money our Federal government? No thanks. 4) raise The Fed target rate to 22%.
Yes, the Taylor Rule suggests a target rate of … 22% to tame the savage inflation beast, based on 8.50% CPI YoY.
The problem, of course, is that 22% is higher than the previous high of 20% under Fed Chair Paul Volcker in 1981. And Volcker didn’t have the Bernanke Bonanza (aka, quantitative easing). Look at the monetary stimulypto, since 1981 and particularly since Covid.
Will The Fed raise rates to 22%? Well, Fed Futures is pointing at the target rate hitting 3.6% by March 2023, then falling again.
Its mission impossible to get to 22%, particularly since Biden/Schumer/Pelosi won’t cool it on Federal spending.
Agency mortgage-backed securities (MBS) prices started to degrade as The Federal Reserve started to try to combat inflation caused by Biden’s energy policies and rampant Federal spending. That is, under June when the implied Fed O/N rate (red line) cooled and the 30-year mortgage rate (blue line) has come down a little.
In terms of duration risk, the FNCL 3% MBS duration has risen with anticipated Fed tightening.
So, further Fed tightening will result in greater MBS losses AND rising duration risk.
The US housing market is simply unaffordable for millions of Americans. To illustrate the problem, here is a chart of the Case-Shiller National home price index less CPI YoY graphed against Average Hourly Wages less CPI YoY.
The gap between the REAL national home price index YoY and REAL US average hourly earnings YoY is near the largest since 1988. Inflation is making matters far worse since REAL average hourly earnings growth continues to decline.
The only thing positive to say is that REAL home price growth YoY is lower now than at the peak of the 2005 home price bubble that burst catastrophically.
Another “positive” is that the REAL 30-year mortgage rate has fallen to -3.23%. At the peak of the house price bubble in June 2005, the REAL 30-year mortgage rate was +2.58%. THAT is one big difference between the pre-2008 recession and today’s impending recession.
Today’s jobs report was … strange. While the US economy added more jobs than expected, we also saw labor force participation contract and real wage growth decline again.
The reaction in the bond market? US Treasury 10-year yields exploded by +14 basis points. As I used to tell my fixed-income students, any basis point jump or decline of 10 basis points or more is a BIG DEAL.
The implied target rate for The Fed (based on Fed Funds Futures) is now lower for the Jan 1, 2024 FOMC meeting (3.025%) than it is for the Sept 21, 2022 FOMC meeting (3.034%).
Mortgage rates? They will go up as The Fed removes its Brawndo, the economy mutilator.
The media is thrilled with today’s jobs report showing a sizzling 528k jobs added to the US economy. And with that, the media is cheering that recession fears are shrinking.
But hold on a second.
First, while 528k jobs were added in July (great news!), REAL average hourly earnings growth YoY fell to -3.8173. Why? Because the rate of inflation is greater than nominal average hourly earnings YoY of 5.2%. That is BAD.
This charts shows that inflation-adjusted (or real) wage growth is the worst in recorded history.
And the “sizzling” jobs report isn’t feeling any love in the bond market where the US Treasury yield curve (10Y-2Y) deepened its inversion to -37.593 basis points, a drop of -1.331 BPS. Note that the 10Y-2Y curve falls below 0% just prior to every recession.
Labor force participation actually fell to 62.1% from 62.2% in June.
I am assuming that The Fed will misread the jobs report and argue for LESS COWBELL.


You must be logged in to post a comment.