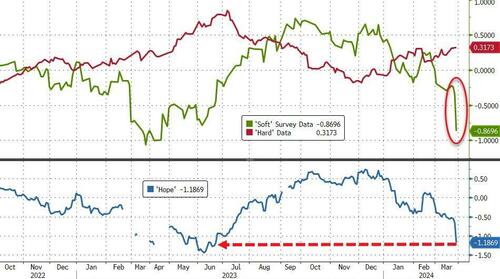
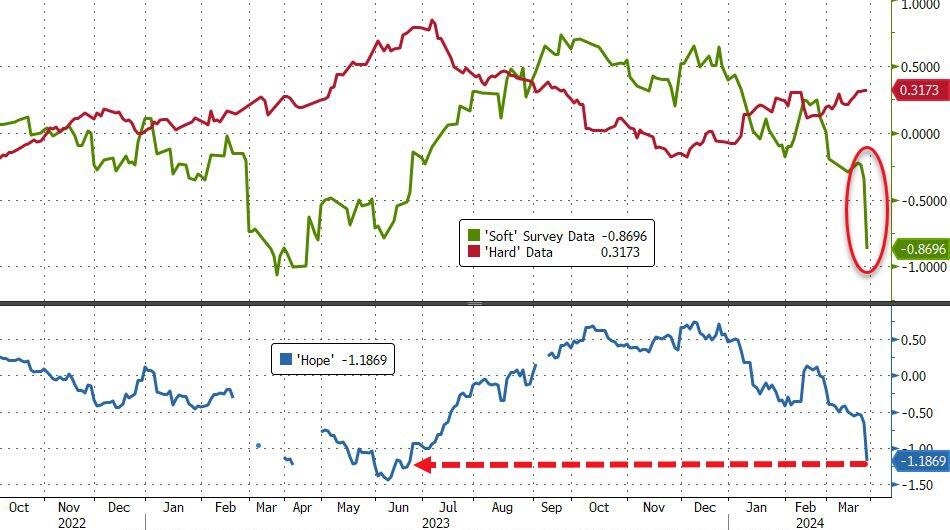
That smashed ‘hope’ – the spread between hard and soft data – back to cycle lows…
Source: Bloomberg
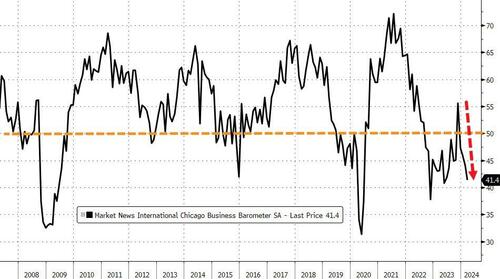
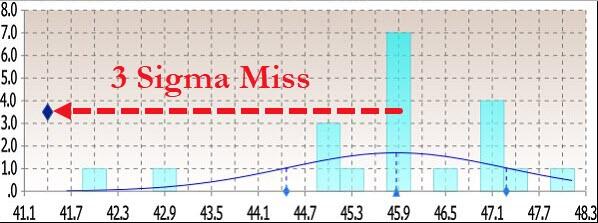
Today’s Chicago PMI plunged to 41.4 – its lowest since May 2023 – from 44.0 (and well below the expected bounce to 46.0)…
Source: Bloomberg
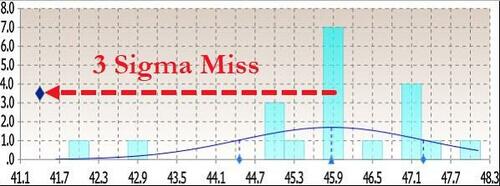
That was below all analysts expectations for the second month in a row…
Source: Bloomberg
Under the hood was even more problematic:
New orders fell at a faster pace; signaling contraction
Employment fell at a slower pace; signaling contraction
Inventories fell at a faster pace; signaling contraction
Supplier deliveries fell and a faster pace; signaling contraction
Production fell at a faster pace; signaling contraction
Order backlogs fell at a slower pace; signaling contraction
Worse still, Prices paid rose again!
So, in summary: slower growth, declining production, shrinking orders, falling employment… and accelerating inflation – is it any wonder that ‘soft survey’ data is collapsing – not exactly election-winning headlines.
Biden asking Zelenskyy for a loan so he can fix the bridge….
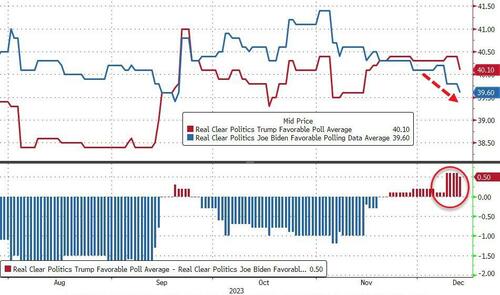
… in the process, sparking the biggest market meltup in a decade, we explained that there was no mystery behind the Fed’s sudden change of heart: it had everything to do with Biden’s woeful performance in the polls.
… maybe what that happened in the past two weeks had nothing to do with economic data, the state of the US consumer, or how hot inflation is running and everything to do with… phone calls from the increasingly angry White House, the same White House which after seeing the latest polling data putting Biden at the biggest disadvantage behind Trump despite the miracle of “Bidenomics” decided to pull its last political level, and had a back room conversation with the Fed Chair, making it very clear that it is in everyone’s best interest if the Fed ends its tightening campaign and informs the market that rate cuts are coming. It certainly would explain why despite keeping the 2026 projected fed funds rate unchanged at 2.875%, the Fed just as unexpectedly decided to pull one full rate cut out of the non-election year 2025 and push it into the pre-election 2024.
I don’t know why @federalreserve is in such a hurry to be talking about moving towards the accelerator. We’ve got unemployment, if anything, below what they think is full capacity. We’ve got inflation, even in their forecast, for the next two years above target. We’ve got GDP growth rising if anything faster than potential. We have financial conditions, the holistic measure of monetary policy, at a very loose level.
… to which we again replied that there is a very simple reason why the Fed is “moving toward the accelerator” and it again had to do with the fact that Biden approval rating is now imploding, so much so that even Time magazine has stepped in with an intervention.
But while once upon a time such a cynical, hyperbolic, and apocryphal view would have been relegated to the deep, dark corners of the financial blogosphere (duly shadowbanned and deboosted by the likes of such Democratic party stalwarts as Google, of course), that is no longer the case and in his latest note, SocGen’s in-house permaskeptic, Albert Edwards confirmed our view that the biggest driver behind the Fed’s decision making in recent months is neither the economy, nor the market, but rather the November presidential election, to wit:
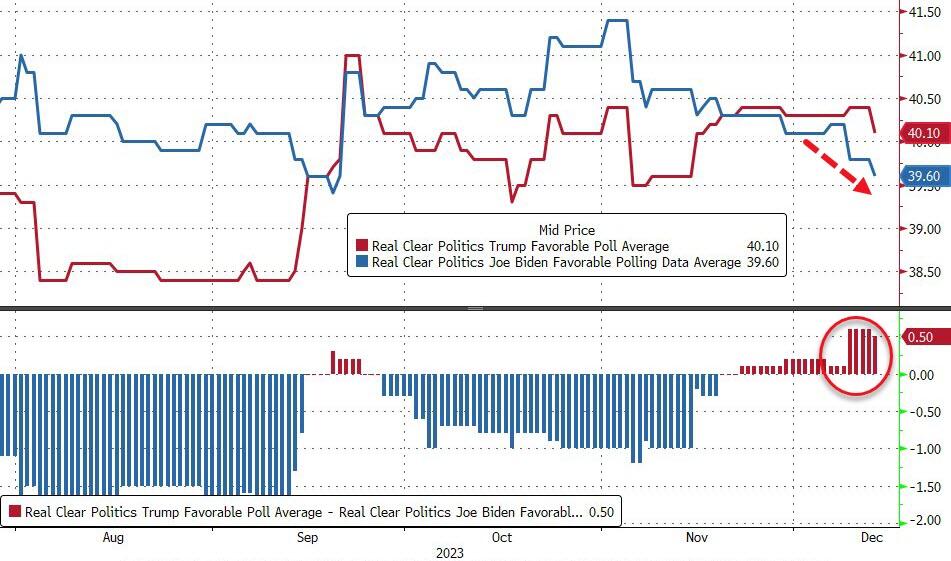
The widening inequality chasm in this US election year will be a real issue for policy makers. What will the Fed do? Traditionally, the Fed would not pivot rates policy to cushion inequality, which is usually addressed by fiscal policy. But growing inequality has been a key issue ever since the 2008 Global Financial Crisis triggered a backlash against ‘The Establishment’ – most evident in the rise in popularism (although many, including myself, believe that the loose money/tight fiscal policy mix was primarily responsible).
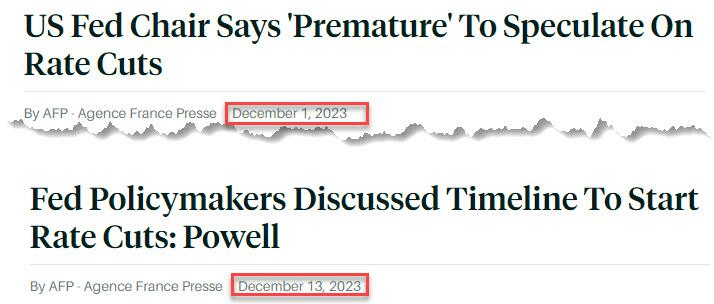
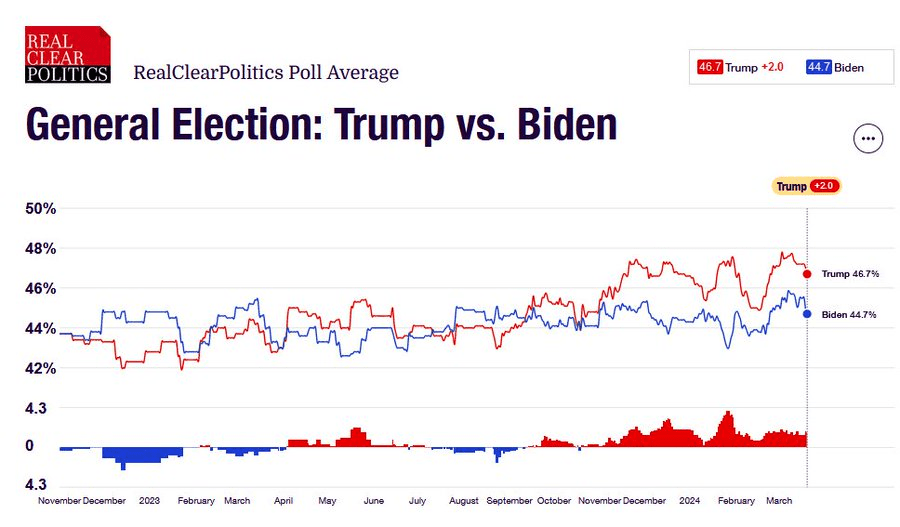
Might the unfolding inequality crisis force the Fed to bow to intense political pressure to cut rates faster and deeper? I think that is entirely plausible. Indeed we on these pages have previously observed, somewhat cynically, that Powell’s recent ‘surprise’ December 2023 dovish pivot came exactly at a time when Donald Trump was pulling ahead in the polls – link. But it would be a diehard cynic who could contemplate that the Fed, as part of ‘The Establishment’, would balk at the thought of Trump winning in November and juice up the economy to try and lower the odds of such an outcome. (I am that cynic.)
To be fair, we find it remarkable that Edwards – a long-tenured and respected veteran of the SocGen macro commentariat – would confirm our own observations. We doubt he is the only one, of course, but the others are far more afraid of losing their jobs, at least for now.
What we find less remarkable is that Edwards – whose job is to track down gruesome and painful ways for the market to die a miserable death – has done just that again and this time, in the aftermath of the BOJ’s long overdue exit from NIRP, ETF buying and Yield Curve Control, predicts that it is now only a matter of time before the YCC that was spawned in Japan will soon shift to the west.
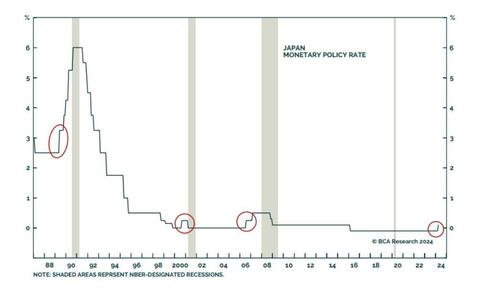
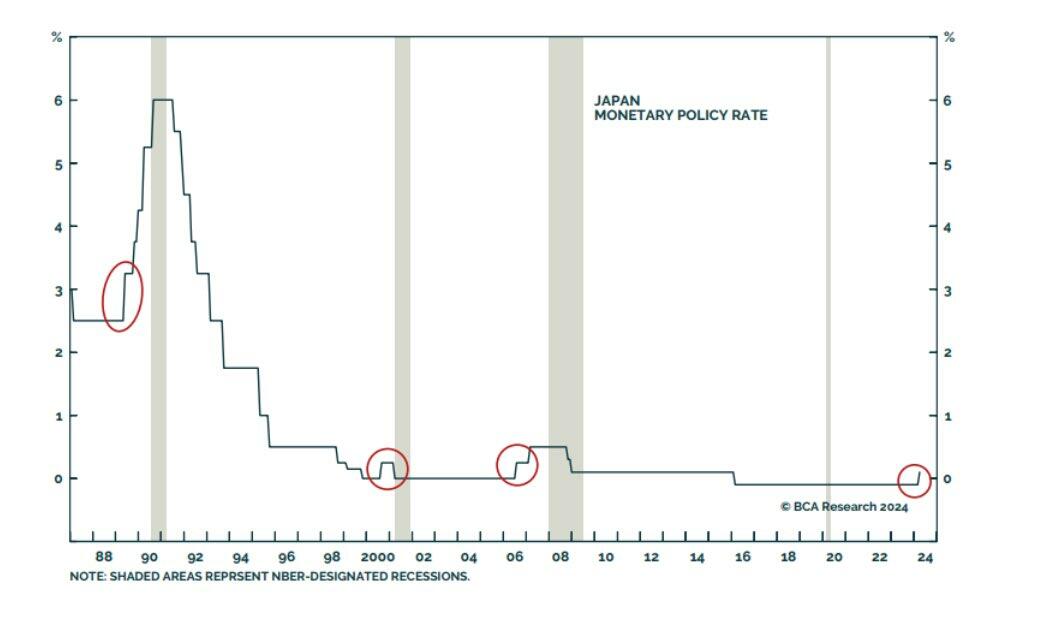
Edwards starts off by observing what has long been a “foolproof” signal of imminent recession: BOJ tightenging:
Market sentiment is now especially vulnerable to weak economic data because, as we pointed out last week, it seems everyone (and their dog) has left their recessionary worries far behind. But as my favorite bear, David Rosenberg, pointed out this week, recent weak retail sales, housing starts, and industrial production data might be setting us up for a negative US Q1 GDP print. Let’s see how the Fed reacts to that. And if you want one reliable predictor of a global recession, @PeterBerezinBCA notes that “In the history of modern finance, no single indicator has done a better job of predicting when the next global recession will start than when the Bank of Japan starts raising rates. Foolproof!”
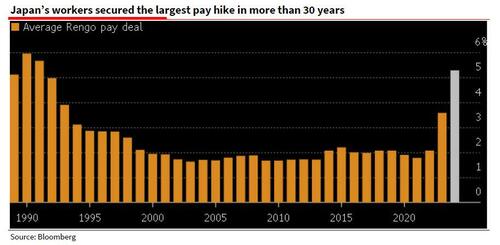
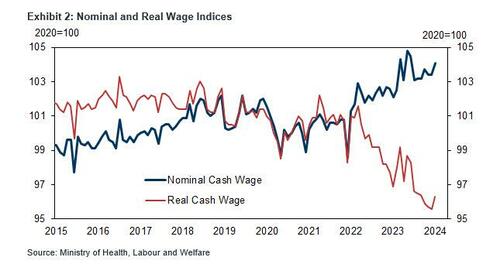
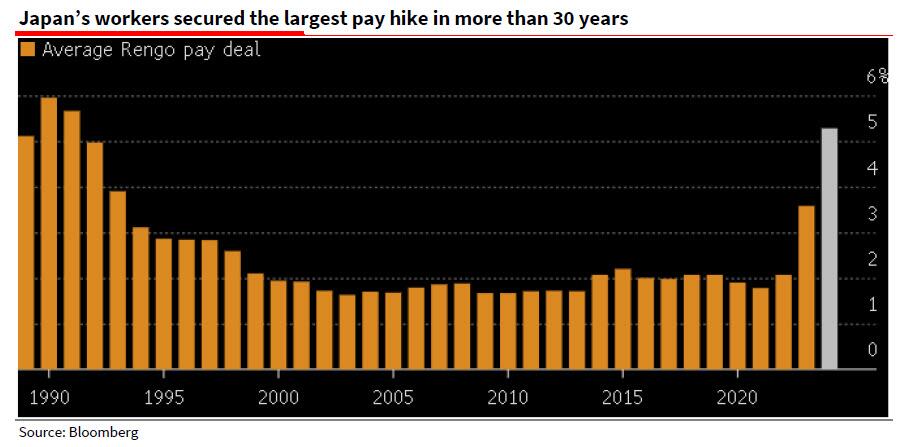
He then recaps last week’s main event, namely that after almost a decade, Japan finally exited negative interest rates and Yield Curve Control (YYC), primarily on the back of soaring (nominal, not real) wage gains: “Rengo, Japan’s largest trade union confederation, announced last Friday that its members have so far secured pay deals averaging 5.28%, far outpacing the 3.8% squeezed out a year ago — itself the highest gain in 30 years (see Bloomberg here and SG Economist Jin Kenzaki’s analysis of this data and the BoJ’s move here).“
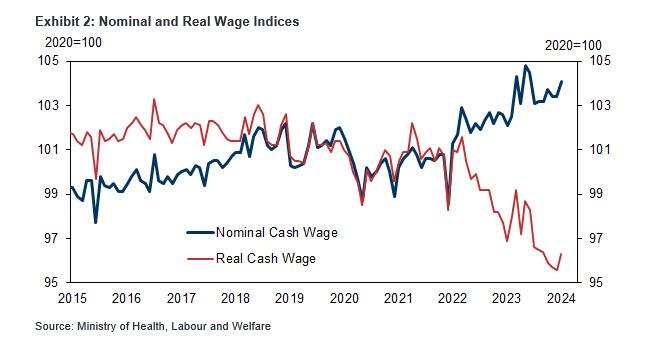
Of course, the problem in Japan is not that nominal wages are surging: it is that in real terms they are crashing, as the next chart clearly shows, and is why the BOJ will have to dramatically tighten – certainly much, much more than the laughable “dovish hike” it delivered last week which sent the yen plunging to a multi-decade low and inviting even more imported inflation – to avoid total collapse in Japan’s economy as it gradually accelerates toward hyperinflation:
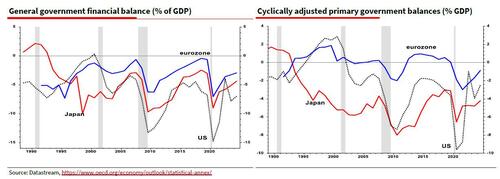
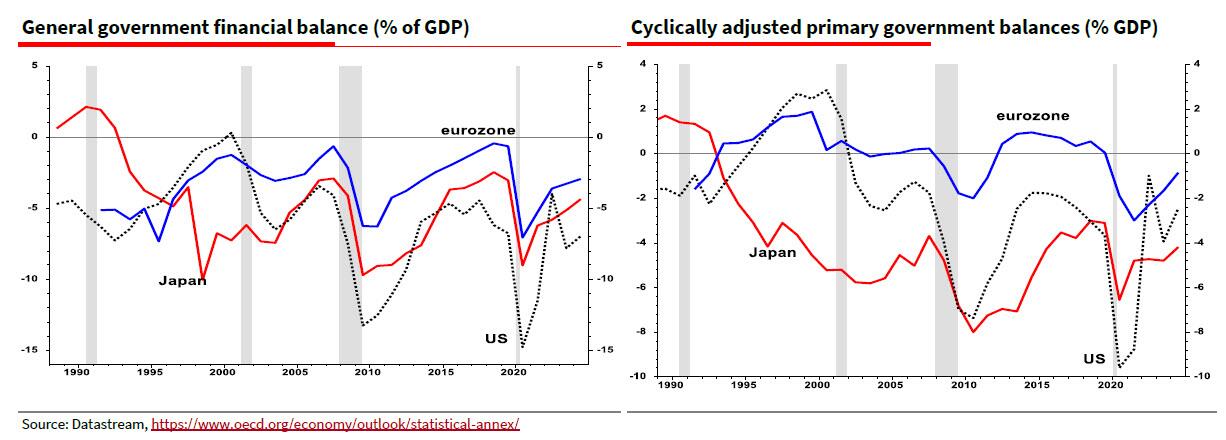
Of course, Japan can not actually tighten as that would instantly vaporize the economy and the bond market of a country whose central bank owns Japanese JGBs accounting for well more than 100% of GDP. But at least Japan has something goign for it: as Edwards notes, “the OCED estimates that interest on US debt amounts to 4½% of GDP, compared to only 0.1% of GDP for Japan (link). Hence the cyclically adjusted primary (ex-interest) deficit data show Japan as the most profligate borrower (see right hand chart). But the US still has to pay that interest somehow.” In other words, when adding interest payment, “it is the US that has been running the largest deficits since the 2008 GFC – bigger than even Japan (see left hand chart).”
Which brings us to Edwards’ punchline: “decades of excessively loose monetary policy has allowed governments to ruin their fiscal situations to the point that public debt to GDP ratios are on wholly unsustainable trajectories. Just look at the CBO’s projections for the US here. Yet with an ever-intensifying populist backlash against high levels of inequality, I can only see one way out of this mess for western economies. Nothing less than Financial Repression including Yield Curve Control – yes, the very same YCC that Japan has just abandoned.”
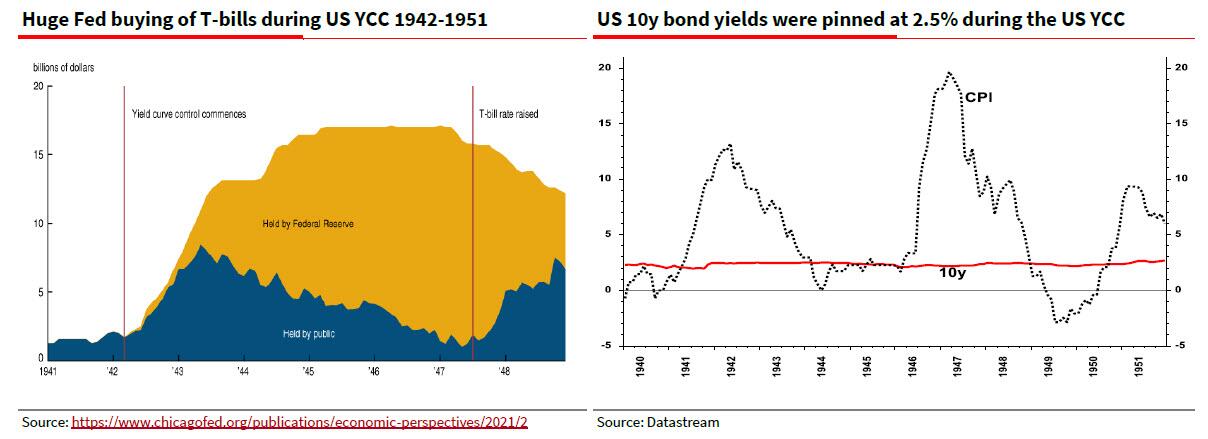
For those who may not have been around back in the 1940s when the US – and the Federal Reserve – was the first developed nation to utilize YCC to kickstart the US economy at a time of record debt to GDP, here is a quick primer from the SocGen strategist: “Financial Repression essentially entails holding interest rates below the rate of inflation for a lengthy period to allow debt to be ‘burned off’. This is a tried and trusted way for governments to wriggle free from excessive debt (eg the US after WW2). The leading economic historian Russell Napier explained how this works in an informative 2021 interview with The Market NZZ – link.”
And indeed, it was only a few years ago, just before the pandemic sparked a stimulus flood of epic proportions, that western policy makers were switching to average inflation targeting and stating that they would run economies hot to create that higher inflation (they got it but not because of AIT). That was the first notable attempt to shift toward Financial Repression, but as Edwards notes, “unfortunately they were too successful and let the rampant inflation cat out of the bag.”
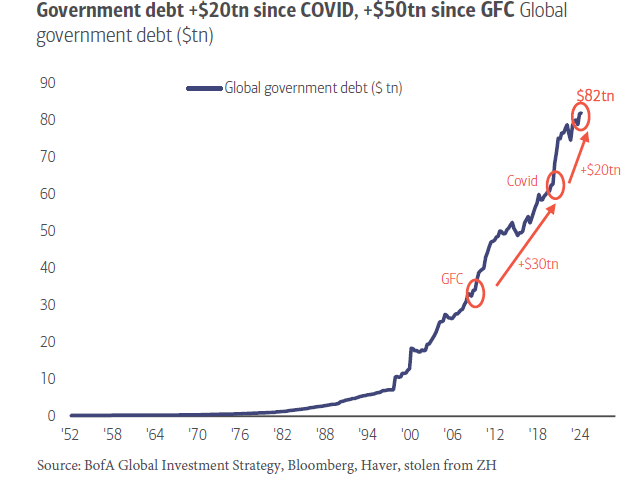
Which brings up the $64 trillion question: “Do the Fed and ECB really want inflation to return to pre-pandemic inflation lows?” Well, with global debt now about 7x higher in just the 21st century, and fast approaching $100 trillion, meaning it will all have to be inflated away somehow…
… Edwards’ answer is: “Not in my view.” And so while western economists deride Japan for its YCC policies, Albert says “that is where I think the US and Europe are heading as intractable government deficits drive up bond yields. During the next crisis, don’t be surprised to see yet more Japanification of western central bank policy. Plus ça change.” And don’t be surprised if the dollar – while appreciating against the rest of the world’s doomed currencies in the closed fiat-system loop – hyperdevalues against such finite concepts which mercifully remain out of the fiat system, such as gold and crypto.
After witnessing the debacle called “The State of the Union Address” or “Crazy Grandfather Screams At Nation To Get Off His Lawn,” I was hoping that today’s jobs report would make me happier. It didn’t. In fact, the February jobs report was downright awful.
Maybe now you can understand why Biden gave his angry SOTU speech. Perhaps he saw how bad February’s jobs report was for Middle class America and was trying to redirect the rage away from himself towards the Supreme Court, MAGA Republicans, corporate America (his biggest donors?), and the 6 year old that walked across The White House Lawn uninvited.
The Hollies said it best: Stop, stop, stop. FIAT Money Printing that is.
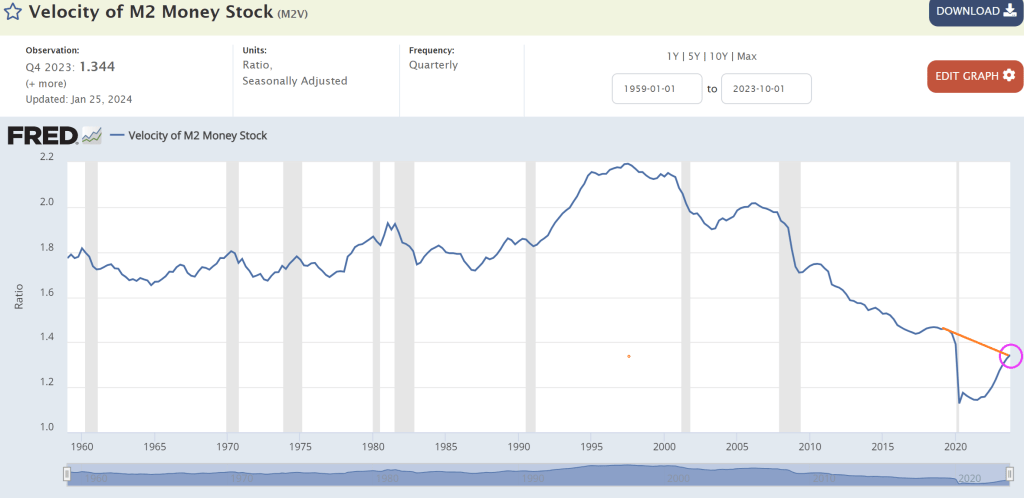
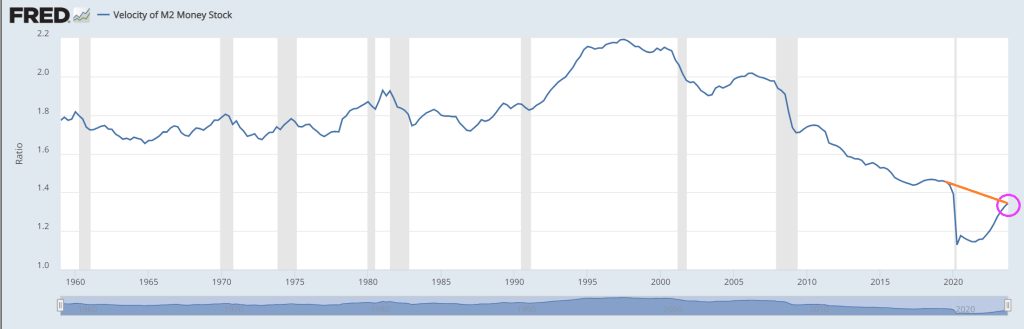
Typically, we look at M2 Money Velocity (GDP/M2) as a measure of how much the economy grows by expanding the money supply.
M2 Money Velocity is currently at 1.344, and still below where we were under Trump prior to Covid. After Powell printing palooza after Covid, M2 Money Velocity collapsed and is slowly rising, but remains low by historic standards.
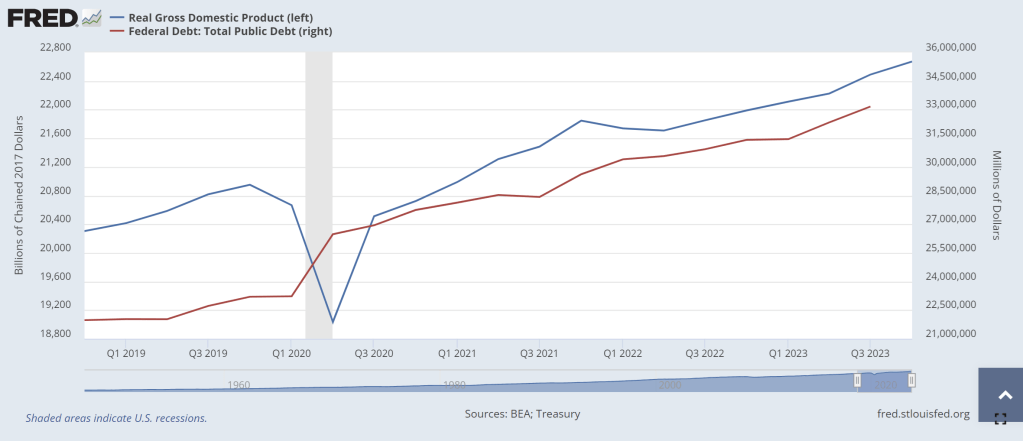
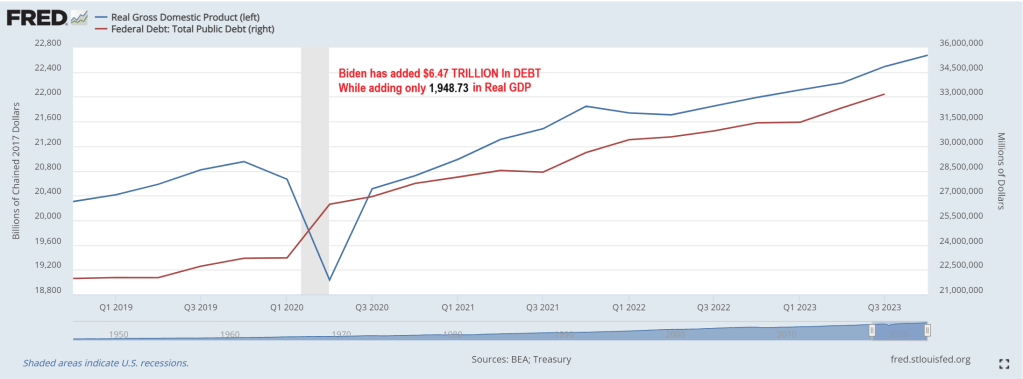
Perhaps a more interest velocity is DEBT velocity (GDP/DEBT). Under Biden’s Reign of Error, Federal debt has increased by $6,539,359 million while real GDP has increased by only $1,948.731 billion (or roughly $2 trillion in GDP growth after $6.54 trillion in debt). Or a DEBT velocity of 0.3. Yikes! No wonder China is bailing on US debt!
This chart makes debt issuance look better than it really is. Again, the DEBT VELOCITY of 0.3 is terrible meaning that for every $1 of Federal debt, we get 30 cents in Real GDP under Biden. One of my macroeconomics textbooks stated that debt growth is fine as long as real GDP growth rises faster than debt growth. Apparently, Treasury Secretary Janet Yellen didn’t read that textbook! Real GDP has grown by 9.43% under Biden while Federal debt has grown by … gulp .. 24%.
Yes, the US is borrowing like the proverbial drunken sailor while they “invest” in green energy, wars in Ukraine and the Middle East, and massive social welfare programs (like the old breads and circuses from the dying Roman Empire). When watching the media’s obsession with Taylor Swift and Chief’s Tight End Travis Kelce at The Super Bowl, it reminded me of “Breads and Circuses” as our nation is collapsing like a dying star. (That is why I Iike Gold, Silver and Bitcoin!)
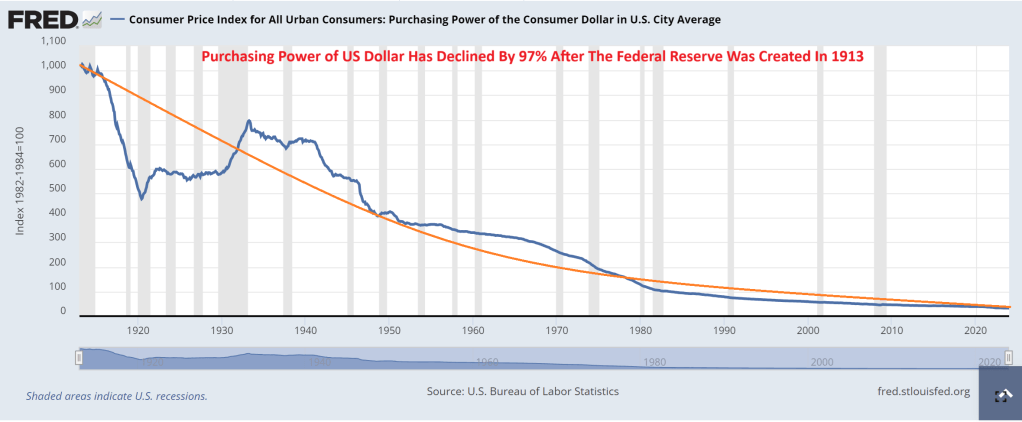
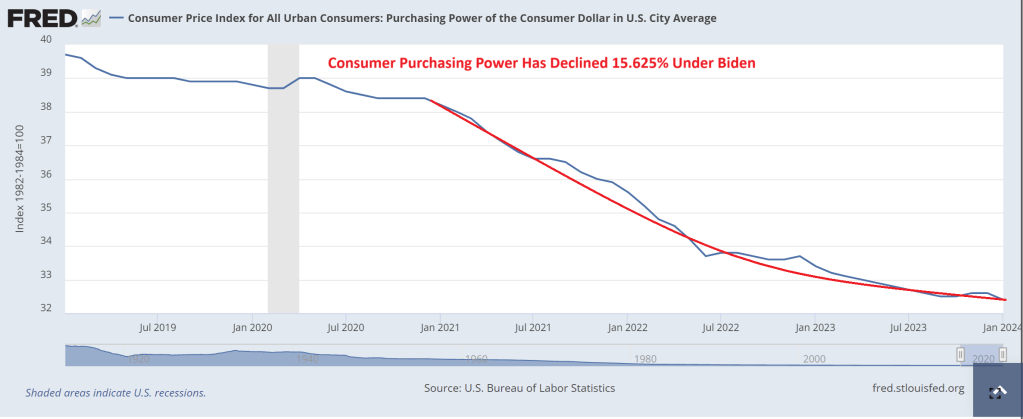
What about The Federal Reserve? It was created in 1913 after signed into existence by President Woodrow Wilson. Since The Fed’s inception, consumer purchasing power has declined by 97%.
And under Biden, inflation has been so bad that consumer purchasing power is down 16%.
In summary, The Federal Reserve has been printing like crazy (I would say Batshit Crazy, but I actually think bats are adorable). And Treasury (under former Fed Chair Janet Yellen) has been borrowing like crazy too. While politicians claim the economy is in great shape, it is really because The Fed is printing wildly, Yellen is borrowing wildly, and much of US GDP is not due to the private sector, but Federal government spending … to the donor class. This is NOT a sustainable and will eventually crash into a ravine.
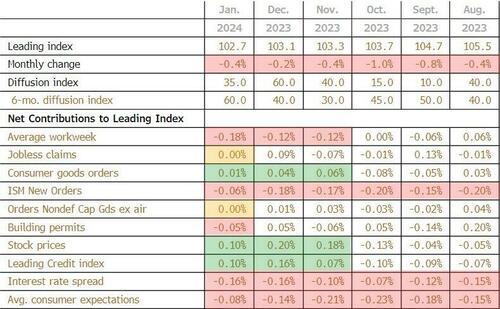
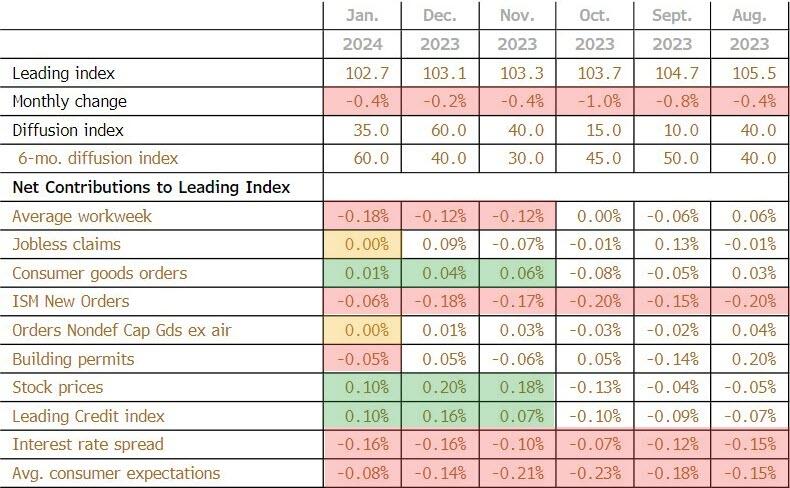
The biggest positive contributor to the leading index was stock prices (again)at +0.10
The biggest negative contributor was average workweek at -0.18
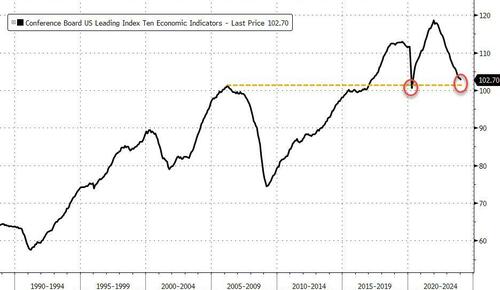
This is the 22nd straight MoM decline in the LEI (and 23rd month of 25) – equaling the longest streak of declines since ‘Lehman’ (22 straight months of declines from June 2007 to April 2008)
“While the declining LEI continues to signal headwinds to economic activity, for the first time in the past two years, six out of its ten components were positive contributors over the past six-month period (ending in January 2024).
As a result, the leading index currently does not signal recession ahead.
While no longer forecasting a recession in 2024, we do expect real GDP growth to slow to near zero percent over Q2 and Q3.”
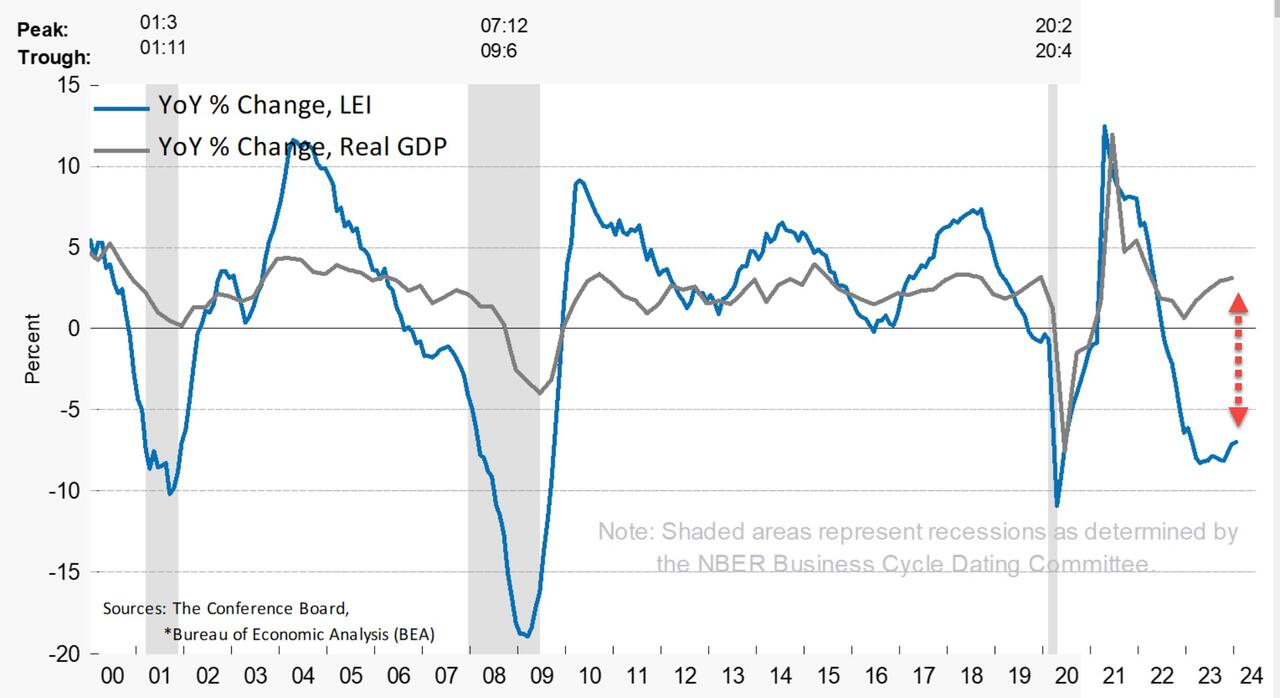
While the Conference Board seems optimistic, we are struggling to see any signs of hope! tumbling back below the peak in March 2006…
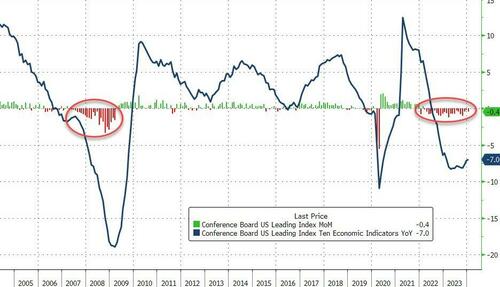
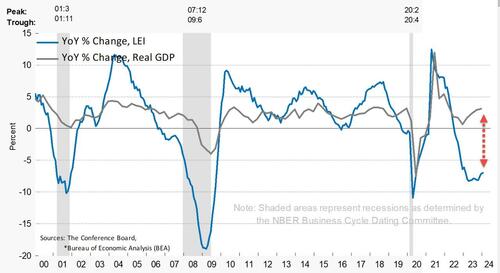
And on a year-over-year basis, the LEI is down 7.0% (down YoY for 19 straight months) – still close to its biggest YoY drop since 2008 (Lehman) outside of the COVID lockdown-enforced collapse (but starting to inflect)…
The annual growth rate of the LEI remains deeply negative and decoupled from Real GDP…..
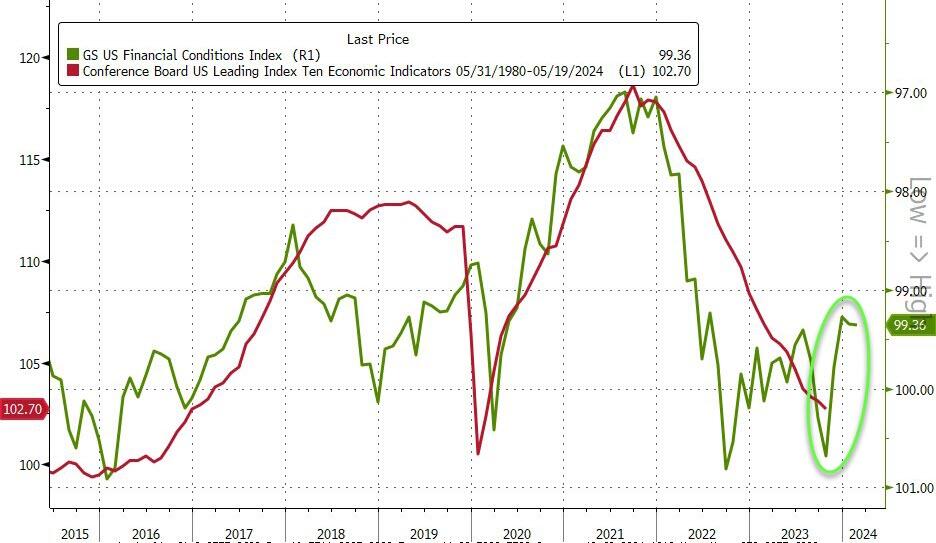
Finally, the massive easing of financial conditions in the last few months suggests a turn in LEI is imminent…
And hence the ‘soft landing’ mission is accomplished… so no need for rate-cuts? (Except for the banking crisis that looms in March).
The Federal Reserve (aka, The Keep) is back in the saddle again. The Fed has been unable to control inflation since Federal government spending was so fast and furious after Covid that little thought was given to the long-term ramifications of insane spending. Not to mention The Fed’s overreaction to Covid.
Example?
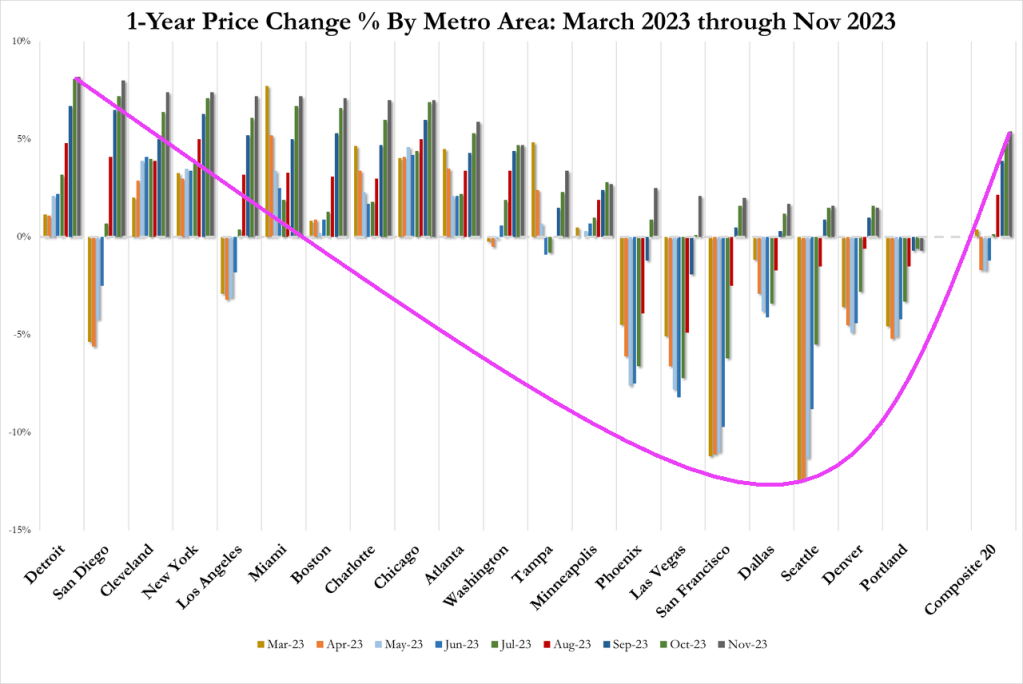
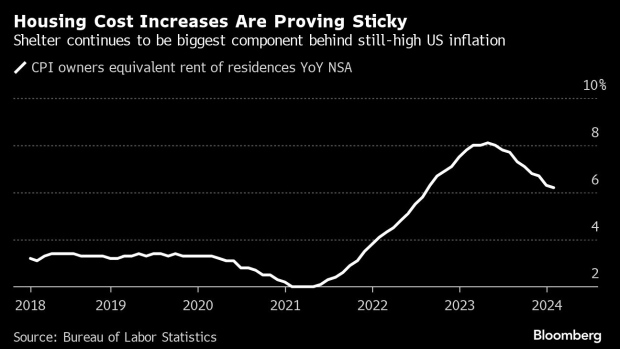
Home price growth is rising again. Home prices in traditional “bubble cities” out west were cooling, but are reaccelerating. Even Detroit and Cleveland are seeing rapid home price acceleration.
Yes, housing inflation is sticky.
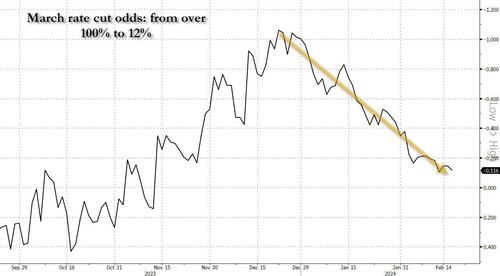
In retrospect, this wholesale dovish euphoria may have been rather short sighted, because after several strong economist reports hit the tape (with the Nov 2024 election growing closer by the day, that should hardly have been a surprise), March rate cut odds collapsed from over 100% in late December, to just 12% currently…
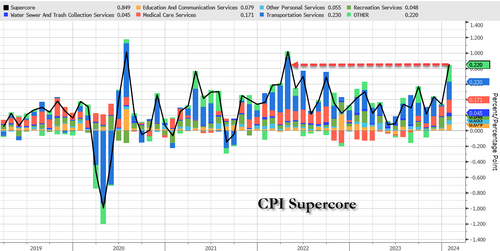
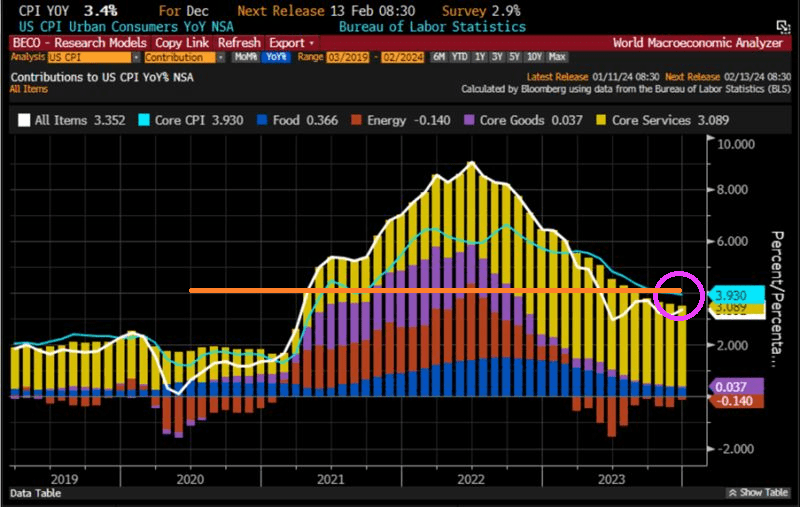
… as first the January CPI printed red blazing hot– with core coming in at 3.9% far higher than the 3.7% expected, with the 3-month annualized rate jumping to 4% from 3.3% and the 6-month annualized rate spiking to 3.7% vs 3.2%, but the biggest highlight was SuperCore CPI (i.e., core CPI services ex-Shelter) which soared 0.7% MoM, the biggest jump since Sept 2022…
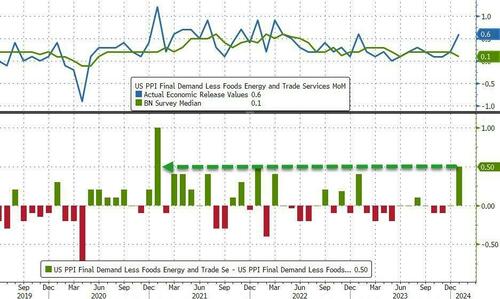
… and then the January PPI print come in even hotter, with a core component surging in January by 0.5%, smashing expectations and beating estimates by the most since Jan 2021.
The result: not only has the market rapidly priced out what if formerly saw as many as 6 rate cuts in 2024, but growing speculation that a rate cut may not come at all unless the Fed tightens some more first (and with the S&P500 now over 5000, it is pretty clear that the market has already priced in virtually all rate cuts and has cornered the Fed).
Of course, the mass migration across the Mexican border (who knows? could be up to 11 million under Biden’s Reign of Error). While Paul Krugman, the resident lunatic economist for the New York Times, extols the virtues of mass immigration for driving up GDP, fails to recognize that mass migration is helping drive up prices. This is inflation that The Fed can’t control. And Biden/Mayorkas want even MORE mass immigration.
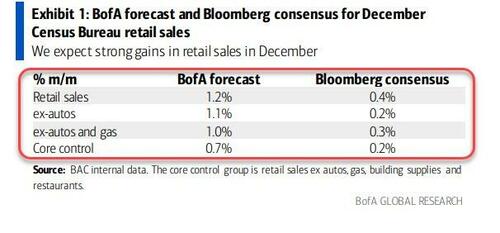
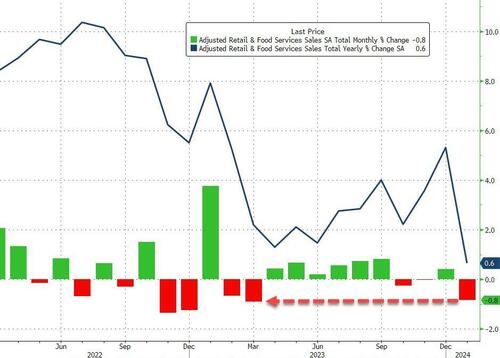
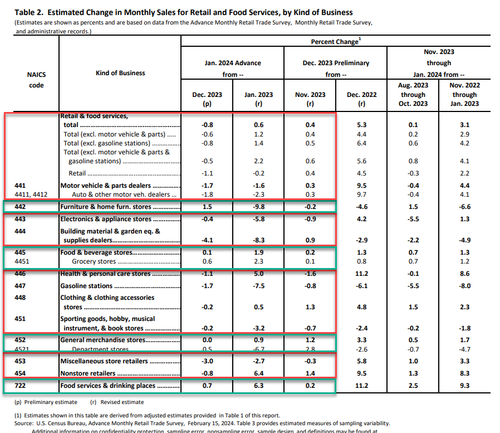
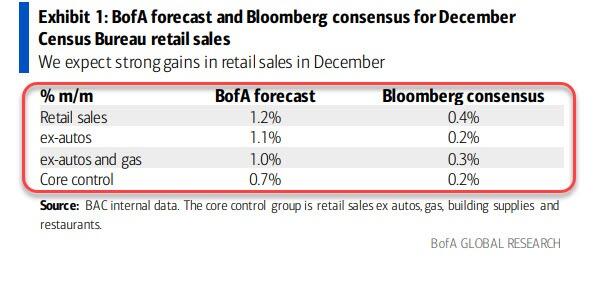
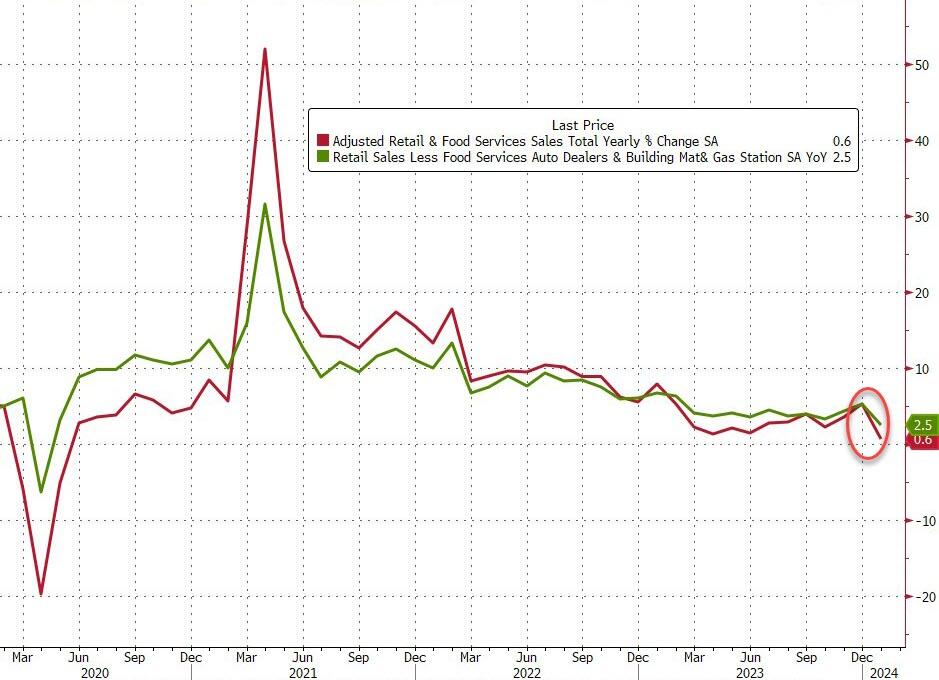
After they unexpectedly surged in November and December (driven in large part by a jump in Food Services), headline retail sales in January were expected to decline just 0.2%, but BofA nailed it once again with a large 0.8% MoM drop. That dragged the YoY retail sales down to just 0.6%…
Source: Bloomberg
That is the worst monthly decline since March 2023 and worst YoY rise since May 2020.
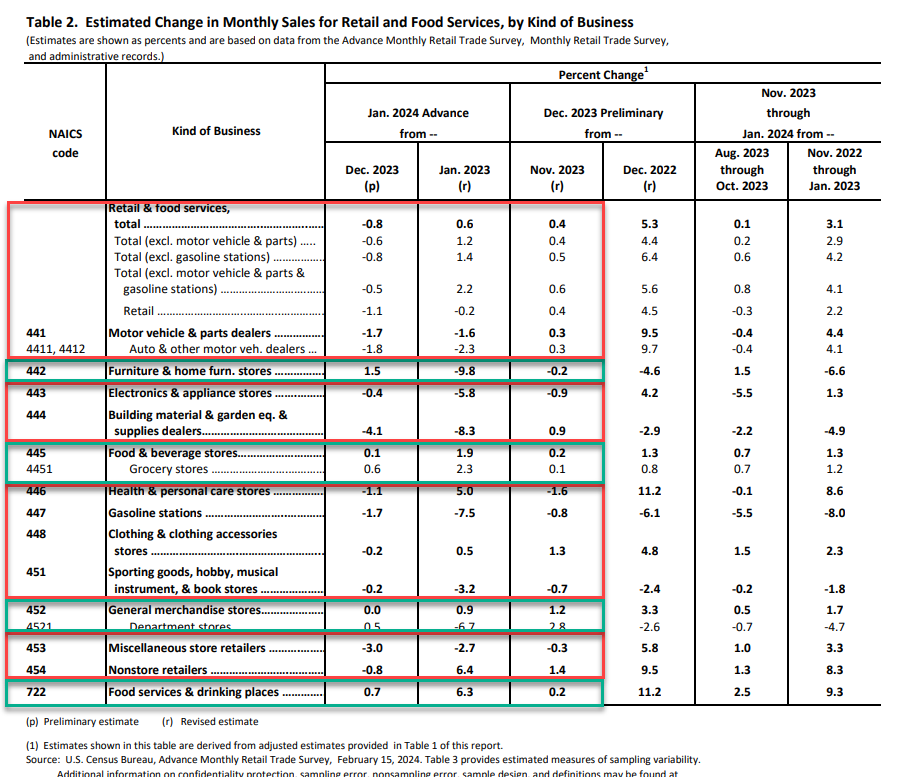
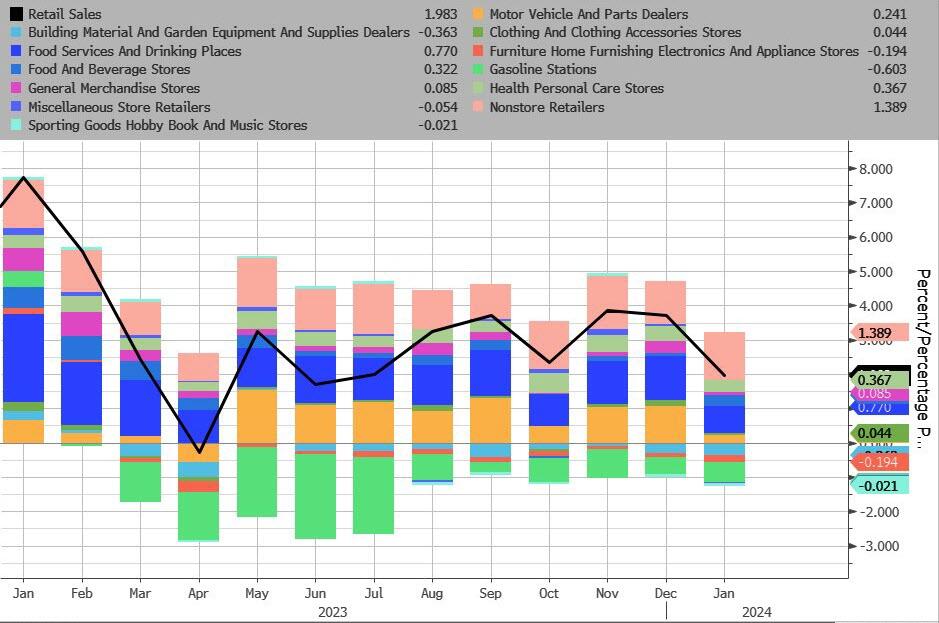
It wasn’t pretty…
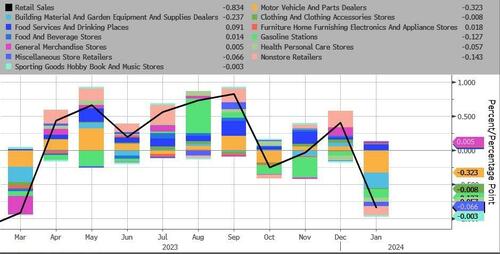
Motor Vehicles and Parts and Building Materials saw the largest decline MoM…
Source: Bloomberg
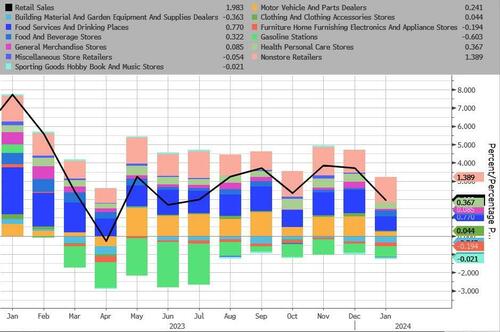
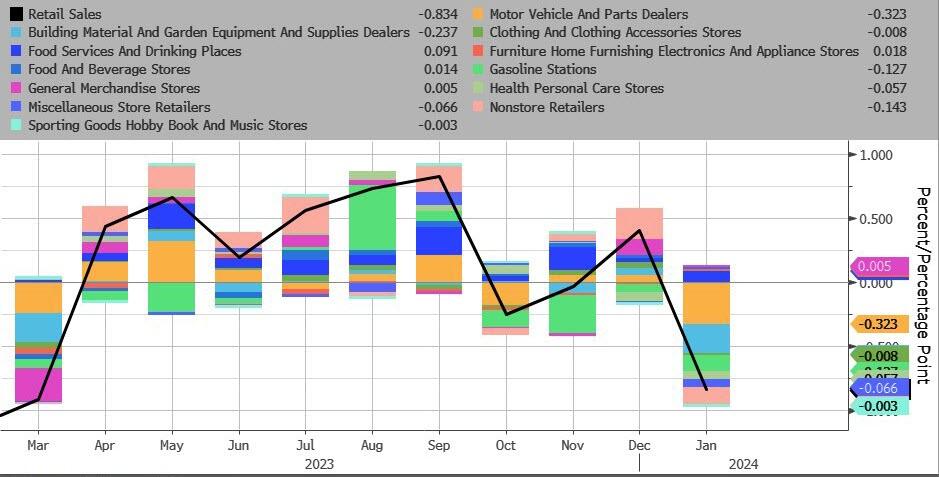
On a YoY NSA basis, Gas Stations and Building Materials were the biggest drag, while online retailers and Food Services were the biggest upside drivers…
Source: Bloomberg
Core Retail Sales also declined (-0.5% MoM vs +0.2% exp), which dragged the YoY levels down to their lowest since the COVID lockdowns…
Source: Bloomberg
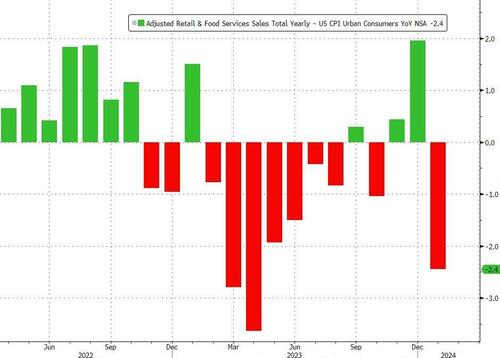
Adjusted (crudely) for inflation, this was a huge drop in ‘real’ retail sales. REAL retail sales have declined for 11 of the last 15 months – in other words, on a crude basis (Ret Sales – CPI), Americans aren’t buying more shit.
Source: Bloomberg
Finally, the control group – used to feed through to the GDP calculation – tumbled 0.4% MoM (vs expectations of +0.2%).
Soft-landing morphing into a stagflationary crash-landing?
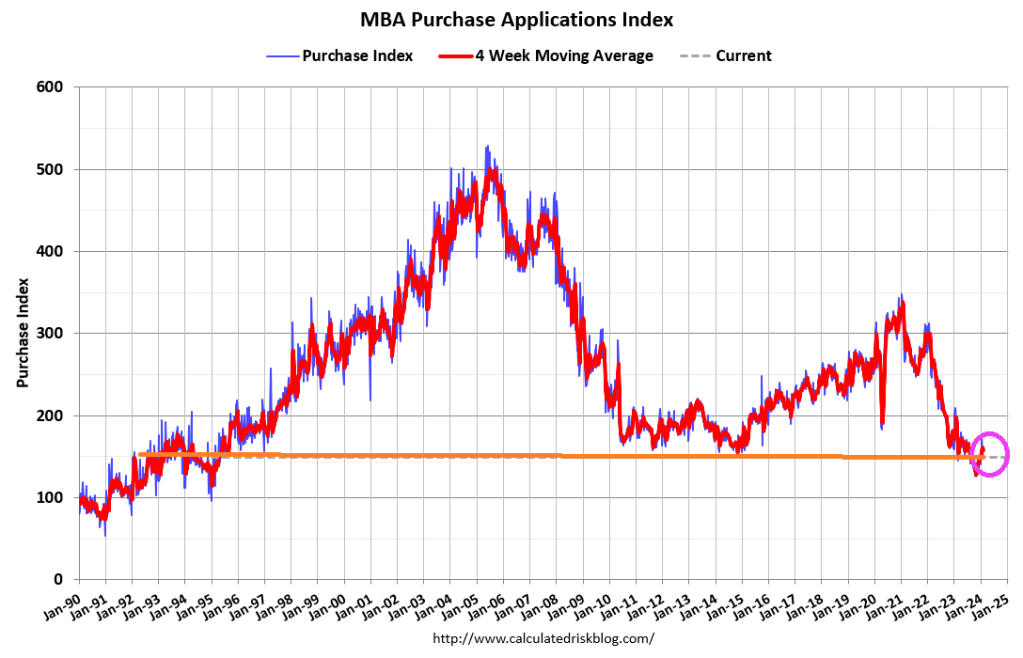
Mortgage applications decreased 2.3 percent from one week earlier, according to data from the Mortgage Bankers Association’s (MBA) Weekly Mortgage Applications Survey for the week ending February 9, 2024.
The Market Composite Index, a measure of mortgage loan application volume, decreased 2.3 percent on a seasonally adjusted basis from one week earlier. On an unadjusted basis, the Index increased 2 percent compared with the previous week. The seasonally adjusted Purchase Index decreased 3 percent from one week earlier. The unadjusted Purchase Index increased 4 percent compared with the previous week and was 12 percent lower than the same week one year ago.
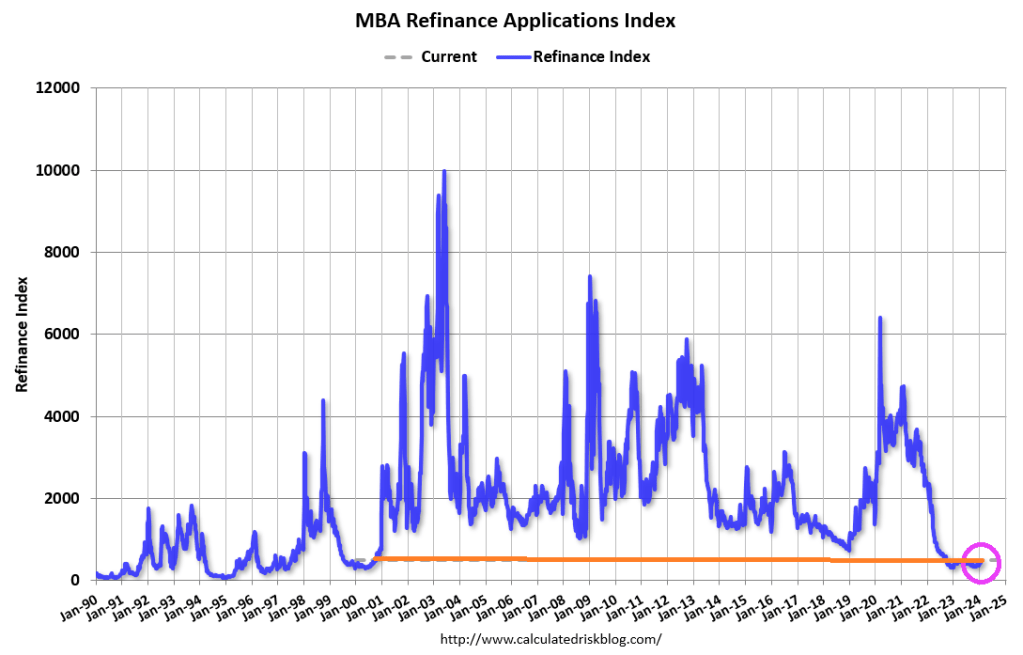
The Refinance Index decreased 2 percent from the previous week and was 12 percent higher than the same week one year ago.
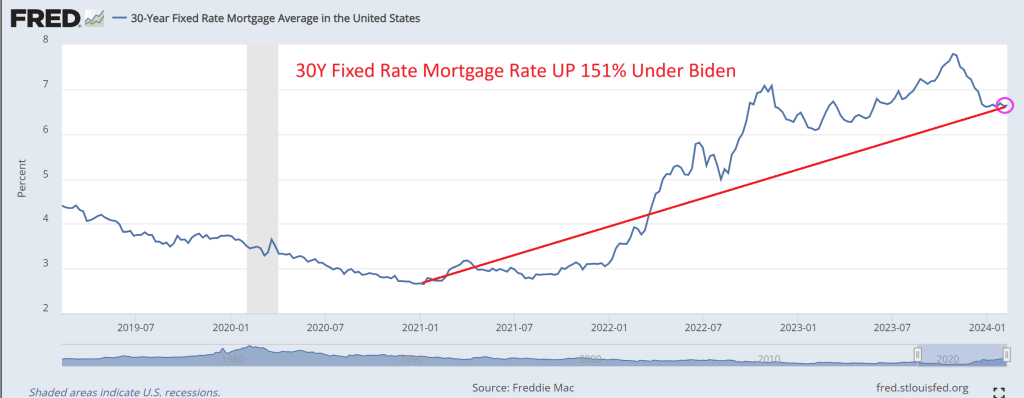
Mortgage rates (30Y fixed) are up 151% under Bidenomics.
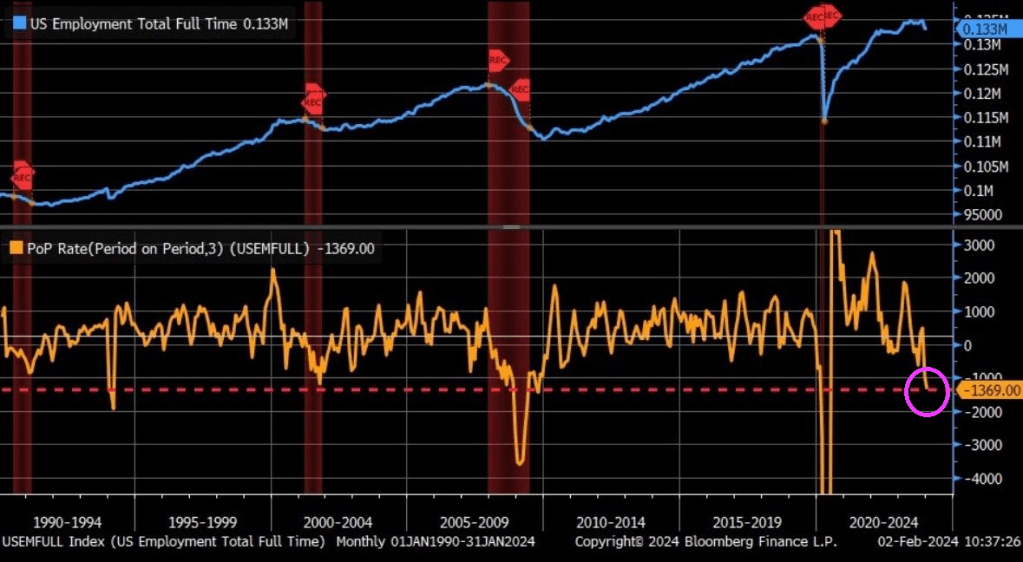
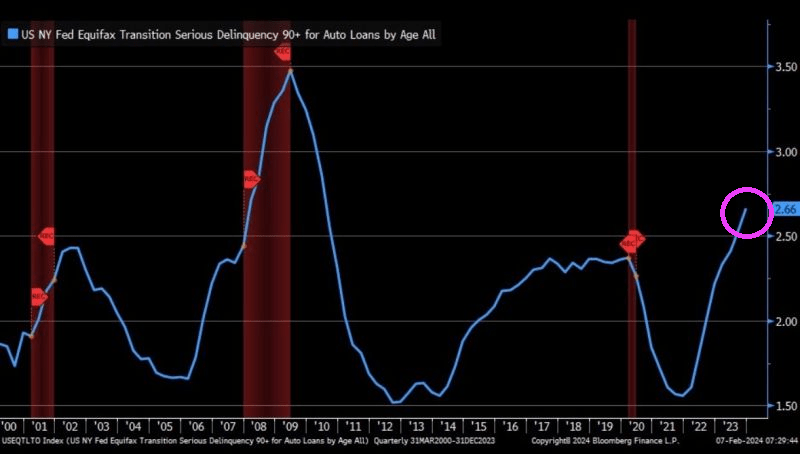
And with the God awful jobs report, serious delinquencies on auto loans is SOARING. To the highest rate since The Great Recession.
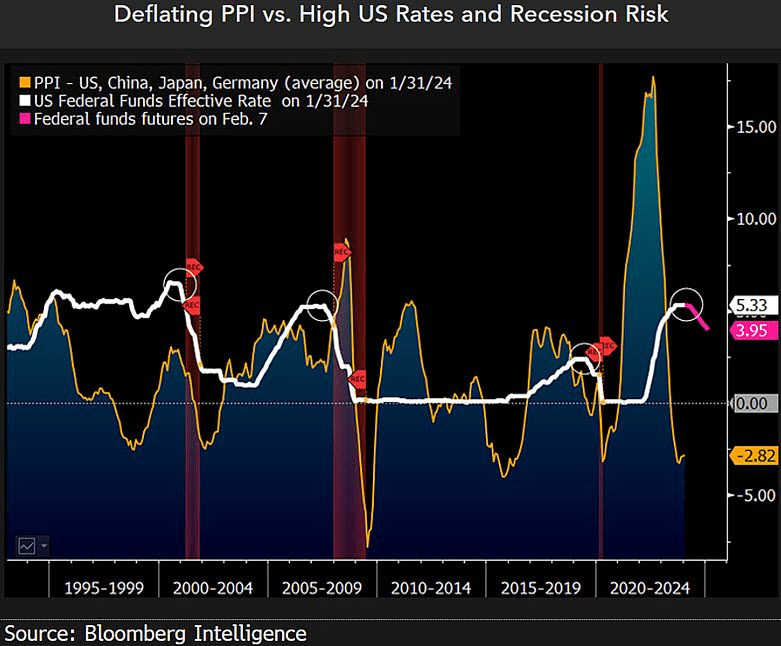
The Producers Price Index is deflating.
At least inflation is cooling down, but still higher than under he that can’t be mentioned on The View, Rachel Maddow or Morning Joe, Donald Trump, the Left’s Voldemort.
I admit, Travis Kelce should have been benched for shoving Head Coach Andy Reid during The Super Bowl. “Damn it, Taylor (Swift) flew here from Tokyo to watch me play and you aren’t throwing enough to me!” Welcome Travis Kelce to the elitist 1% who think the rules don’t apply to them. And your 2.0 GPA at University of Cincinnati certainly qualifies you to opine on the economy … on The View or MSNBC.
I watched Tucker Carlson’s interview with Russian President Vladimir Putin. Putin is an amazing contrast to our 81-year old President with dementia who can barely speak while Putin was articulate. Not at all what Hillary Clinton was raving about (she is still furious about losing to Trump after losing to Obama). One thing that caught my attention was Putin talking about The Fed’s endless printing of money. Well, THAT is how the US grows GDP these days. Borrow and spend with the private sector as an after thought.
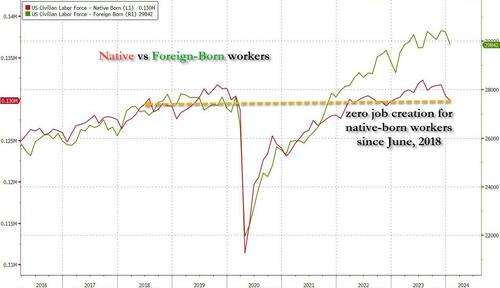
Let’s revisit the HORRIBLE jobs report from December. Not only were all job gains in the past year entirely thanks to part-time workers, but native-born workers plunged by a another whopping 560 thousand, bringing the two-month total drop to just under 2 million.This meant that not only has all job creation in the past 4 years been exclusively for foreign-born workers, but there has been zero job-creation for native-born American workers since July 2018 (don’t believe us? go ahead and check the data directly from the Fed).
So, the Federal government is borrowing trillions of dollars so that 1) part-time jobs are created and 2) foreign born workers have jobs, but not native born Americans?? (Blogger Paul Krugman thinks that immigration will add $7 trillion in real GDP over the next 10 years and this will save Social Security and Medicare. Huh? I admit, millions of immigrants will spend money, but many will be on the Federal and State doles, so its tax dollars going to immigrants to spend.) This seems like Obama/Biden are using Cloward-Piven tactics to overwhelm Social Security, Medicare and other social services, NOT grow the economy as Krugman projects.
Typically, economists look at measures like M2 Money Velocity (Real GDP/M2). M2 Money Velocity is rising … but still remains below where it was pre-Covid under Donald Trump.
But a more relevant velocity is the velocity of DEBT. As in GDP/Debt. Under Biden, the US has added almost $6.5 TRILLION in debt while real GDP has risen by only $1.949 trillion. That amounts to a DEBT velocity of 0.30. Meaning that the US gets an anemic $30 in real GDP for every $100 in additional Federal debt.
Yes, the US economy is broken and requires endless money printing and debt financing to pay for endless wars and now millions of illegal immigrants getting on “the dole.” Then we have Biden’s forgiving student loan debt (inappropriately) and now Big Tech wants $7 trillion to develop AI (in a normal economy, tech companies would develop AI themselves, but under Obama/Biden, we are not in a normal economy).
Here is Daddy (Ukraine) Warbucks Biden with his biting dog and daughter Ashey.


You must be logged in to post a comment.