
I know, the Soviet Union’s Josef Stalin was known as Country Joe. Here is Country Joe singing “I feel like the US economy is fixin’ to die.”
On the commodity side, Spot Silver is up 1.46%. Iron Ore is up 1.60%, but I don’t think my neighbors would appreciate me taking delivery on 10 tons of iron ore on my driveway! Heating oil is up 2.90%.
On the crypto side, bitcoin is up 20.84 (0.08%) with Ethereum up slightly more.

Bitcoin and silver doing well as the US Dollar loses ground since September 2022.

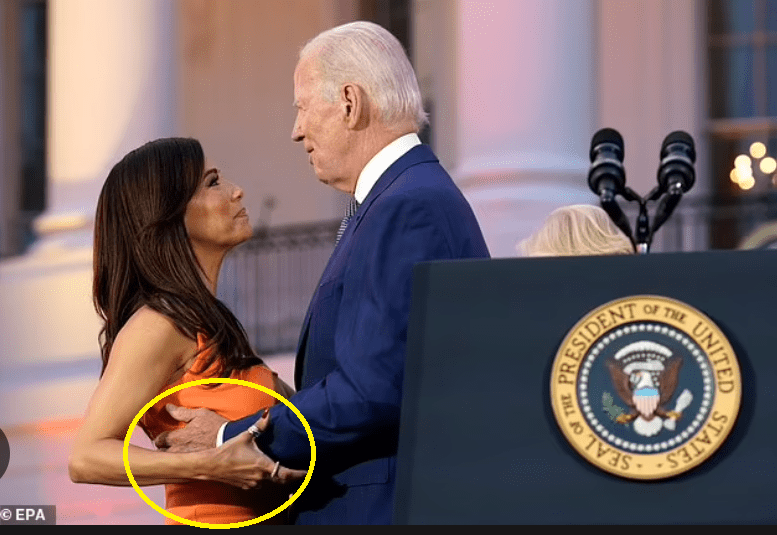
Biden is out of touch with everyday Americans. Except for trying to grope Eva Longoria’s breasts in full view of the world.
Biden would have been better off groping Ricky Martin as he sings “Living La Vida Loca Economy.” (the crazy life of Biden’s economic policies).


You must be logged in to post a comment.