Household Essentials Cost Far More Under Bidenomics! Gasoline Prices Up 72%, Rent Of Primary Residence Up 16%, Food At Home Up 20% Under Biden! (30Y Mortgage Rate UP 163% Under “Middle Class Joe”)

Middle class Joe my ^%&!

Joe Biden will always be remembered for lying about never raising taxes on households making under $400,000. Inflation is a permanent tax, mostly on those making under $400,000 per year. And household essentials are up substantially under Biden: gasoline prices are up 72%, rent CPI of Primary Residence is up 16%, and food at home CPI is up 20%! That is a HUGE tax on the middle class.

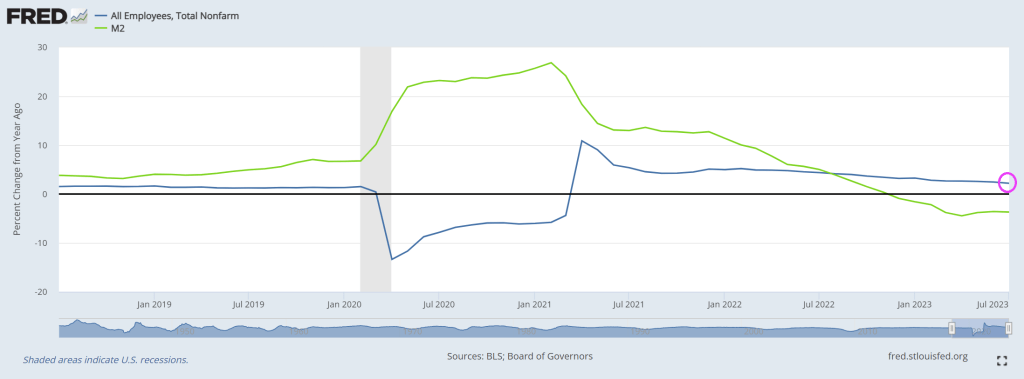
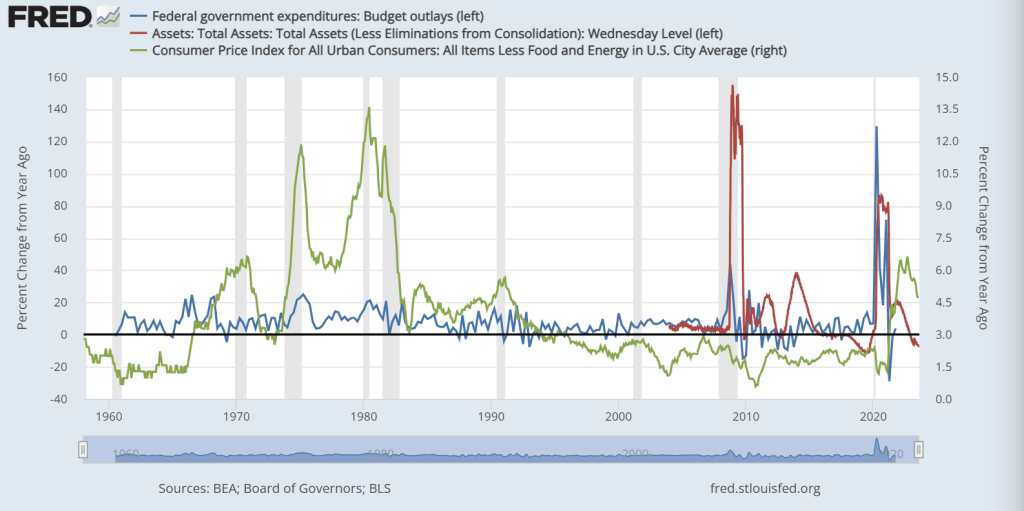
When mainstream economists and politicians cite “improvements” to the inflation problem in the US in recent months, what they are commonly referencing are changes to the Consumer Price Index (CPI).  However, the CPI is not a measure of total inflation, rather, it is a median snapshot of prices at a particular point and time.  True inflation is cumulative – A 10% increase one year and a 5% increase the next year is not a win, it means that you are now paying 15% more on average for everything you buy in the span of only two years.   

When CPI falls this does not mean that prices on goods and services are going down, it only indicates that prices are rising slower than they were the month or the year before.

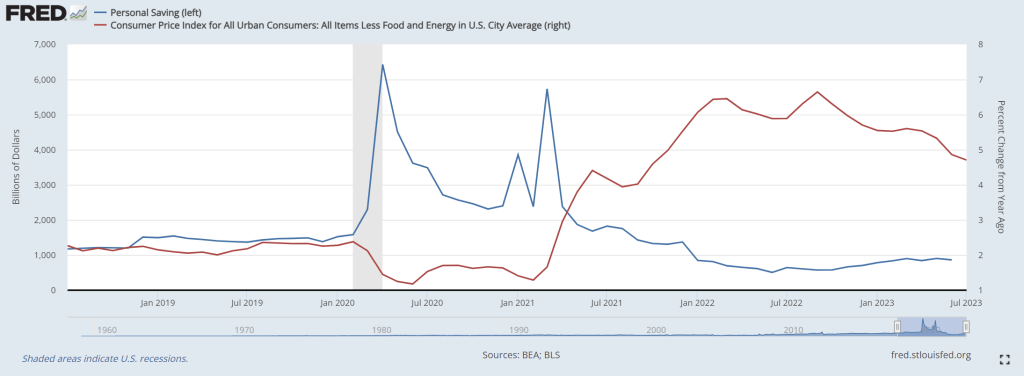
Another misconception about CPI is that it measures the inflation rate accurately for regular consumers on common purchases.  In reality, the CPI represents mean average price rate increase for a vast basket of goods; over 94,000 items and services with over 200 separate categories.  Most of these items and services you will never use or rarely purchase in the span of a year.  In other words, inflation declines in uncommon goods can dilute the numbers, making it seem like inflation is dropping while prices on daily necessities continue to spike.  

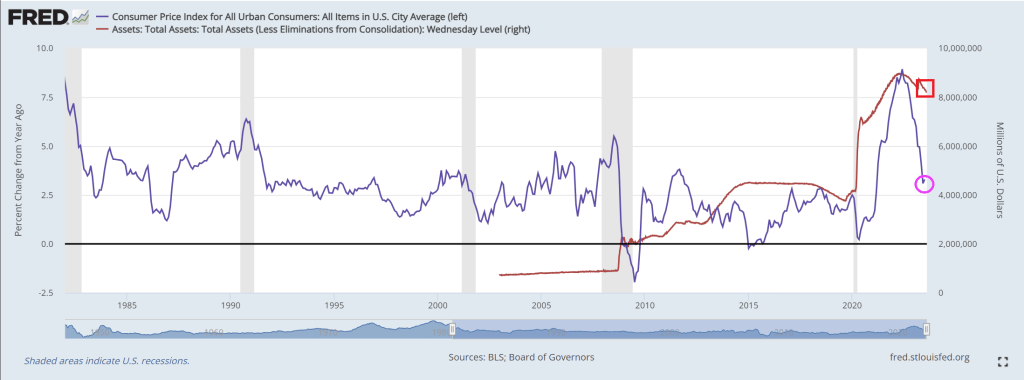
The CPI is weighted according to consumer spending patterns, which is where the calculations can be “adjusted” to a certain extent in an arbitrary manner.  Then there is outright government manipulation through various means.  As we witnessed recently with the Biden Administration’s claims that “Bidenomics” has defeated the inflation threat, what these reports don’t mention is that Biden has been dumping US strategic oil reserves on the market for the past year.  And since energy prices effect the inflation of so many other categories, Biden has artificially manipulated the CPI down using one key resource.  

Now that his ability to dump oil reserves has ended, CPI will rise once again along with energy prices.

The point is, it’s impossible to get a sense of the real damage from inflation without looking at the cumulative inflation in necessities (the goods and services that people are required to purchase on a regular basis to live day to day).  If we throw out the CPI distraction and look at common necessities since 2020, the economic picture is far more bleak.  

Overall food prices have soared by 25%-30% in only three years (again, this means that you are now paying 30% more this year for food than you were paying at the beginning of 2020). Chicken is up from $3 per pound to $4 per pound.  Beef is up from $3.50 to $6 per pound.  Corn is up from $3.50 per pound to $4.70 per pound.  Wheat is up from $5 per pound to $7 per pound.  In 2019 the average American household was spending $8100 on food annually; with a 30% increase, in 2023 Americans will be spending at least $10,500 per household.          

By the end of 2019, the average rental price of a single family home was around $1450 per month.  This year the price is around $2000 per month.  At the beginning of 2020, the median cost of a home was $320,000; by 2023 the price skyrocketed to an average of $416,000.  

For gasoline, the price in early 2020 was around $2.50 per gallon.  The price has fluctuated dramatically due to Biden’s manipulation of the market using strategic reserves, but still remains high today at $3.80 per gallon.  

The cost of electricity has risen swiftly, holding steady around .13 cents per kilowatt hour for a decade, then spiking to at least .17 cents per kilowatt hour by 2023.

Remember, most of these costs are static and are difficult to reduce through household spending cuts.  These are not items that are easily removed from a monthly budget and the expenditures add up to considerable pressure on consumer accounts.  This is probably why around 74% of the public in polls say that the economy is getting worse, not better.  It’s because government statistics are not highlighting the true inflationary crisis.

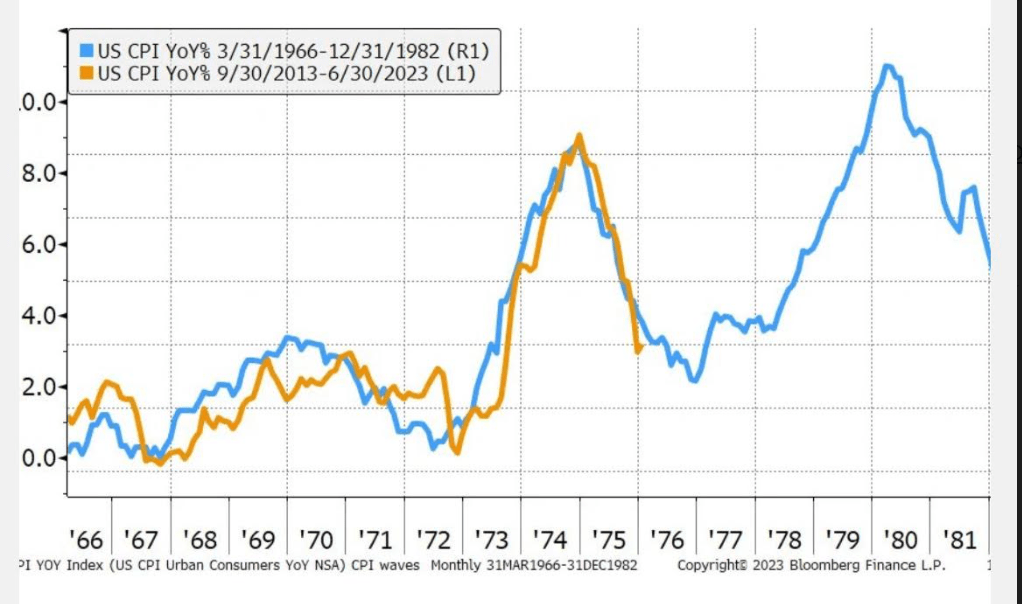
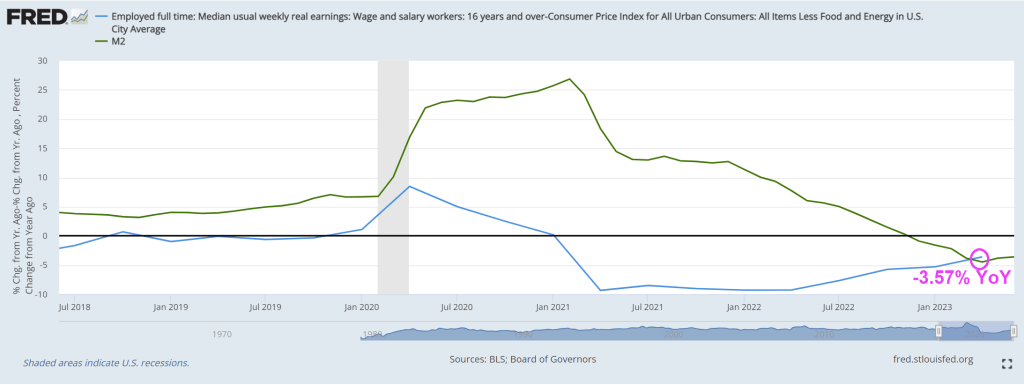
When we look at the cumulative climb of prices in necessities since before the inflation crisis officially began, the truth is that Americans now have to increase their wages by at least 25%-30% on average to maintain the same standard of living they had three years ago.  This is a disaster not seen since the stagflationary event of the 1970s and early 1980s.  If you have a strange feeling like your bank account is being rapidly drained in recent months, that’s because it is.    

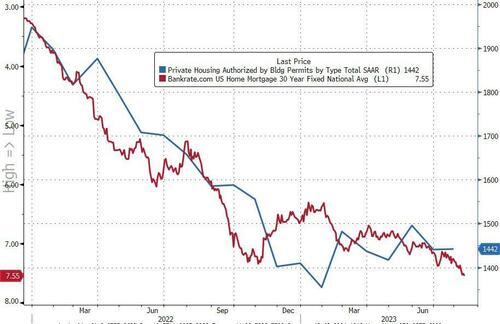
And the 30-year mortgage rate is up 163% under Middle Class Joe.

Bidenomics! US Payrolls Were Likely 306,000 Lower Than Previously Estimated (July Jobs Growth Slowed To 2.2% YoY As M2 Money Growth Slowed To -3.7% YoY)

  • Preliminary benchmark revision smaller than some had projected
  • Biggest payrolls adjustment in transportation and warehousing

Are you surprised that the Biden Administration has been lying about job creation?? Not really since Biden compulsively lies about everything. Including his corruption.

US job growth was probably less robust in the year through March than previously reported, according to government data released Wednesday.

The number of workers on payrolls will likely be revised down by 306,000 for March of this year, according to the Bureau of Labor Statistics’ preliminary benchmark revision.

Even without the revision, job growth has slowed to 2.2% YoY in July as M2 Money growth slowed to -3.7% YoY.

Let see what our Overlords say at the Jackson Hole Fed symposium.

Bidenomics Mortgage Market! Mortgage Rates Now 7.2%, UP 159% Under Maui Joe! (10Y-2Y Yield Curve Collapsed From +100 BPS To -63 BPS)

Maui Joe Biden received a lot of help from his friends at The Federal Reserve!

Thanks to the crippling effects of Bidenomics (Fed easing then tightening to combat inflation caused by insane green spending and a war in Ukraine), US mortgage rates (conforming 30-year) has increased 159%.

On the yield curve side, the US Treasury curve 10Y-2Y CMT fell from 99 basis points the day after Maui Joe was sworn-in as El Presidente to the inverted curve we see today (-63 basis points).

Dynamic Maui Joe looking less than happy trying to visit Maui while he could be partying with mega-donor Tom Steyer (a big green energy con artist).

At least Biden didn’t wear his aviator sunglasses or down an ice cream in a show of “empathy.” But, of course, he did find time to assault a child! Watch the hands Maui Joe!!!!

Lowriding! US Personal Savings Lower Than Pre-Covid As Core Inflation Still Hurts At 4.70% YoY (Large Bank Loan Volumes Shrank Last Week As Deposit Outflows Re-Accelerated)

US personal savings are being exhausted as The Fed raises rates to fight inflation. I call this phenomenon “low riding” where consumers are being punished by The Federal Reserve and Biden Administration.

Meanwhile, large bank loan volumes are shrinking. With money-market fund assets hitting new highs, and banks’ usage of The Fed’s emergency funds facility at record highs, we wonder how much longer The Fed can keep the dream of rising deposits alive (after last week’s massive NSA inflows).

On a seasonally-adjusted basis, The Fed says that total deposits dropped $11BN last week (the first decline in 4 weeks). We also note that the prior week’s inflow was revised higher…

Source: Bloomberg

After last week’s enormous $121BN NSA deposits inflow, last week saw an $11BN outflow (on a non-seasonally-adjusted basis)…

Source: Bloomberg

The gap between SA deposits and NSA deposits remains more manageable (until the next time The Fed decides to fiddle)…

The divergence between money-market fund assets and bank deposits remains extreme…

Source: Bloomberg

On a seasonally-adjusted basis, Small Banks saw $5.6BN deposit inflows last week while Large Banks suffered $28.7BN outflows (with foreign bank inflows of $12BN making up the difference)…

Source: Bloomberg

And so, for a nice change, everything is tidy with domestic US banks seeing deposit outflows on an SA and NSA basis…

Source: Bloomberg

On the other side of the ledger, small banks continued to pump out loans (+$3.56BN, sixth straight week of increases), while large banks saw a $7.4BN contraction in loan volumes

Source: Bloomberg

So, if The Fed’s data is to be believed, Small banks are ‘winning’ – deposit inflows and making loans; while large banks are leaking – deposit outflows and shrinking loans. All while Treasury prices tumble, stressing small bank balance sheets.

Just remember, the sitting US President Joe Biden goes under several psuedonyms like Robert Peters, Robin Ware, and JRB Ware in his email conversations about Ukraine with his son Hunter. But don’t forget another pseudonym: The Reverend Kane from Poltergeist 2!

Hellzapoppin Under Bidenomics! Conforming 30-year Mortgage Rate UP 163.5% (Federal Debt UP 19% Or >$5 Trillion Under Biden While Unfunded Liabilities Are Now At $193 TRILLION)

Hellzapoppin under Bidenomics! And it isn’t a musical, but a tragedy.

Between The Federal Reserve’s outrageous overreaction to Covid (printing like there was no tomorrow), and Biden’s massive spending spree (lots of moldy (green) spending, we have see horrid inflation.

And The Fed trying (sort of) to combat inflation, we see that 30-year CONFORMING mortgage rate for 80% LTV or lower credit borrowers is up 163.5% under Bidenomics.

Under Bidenomics, public debt (owed by the US Treasury) is up 19% or greater than $5 triillion. Now wonder Biden throws are billions like it is water.

I seriously want the Biden Administration (and almost every member of Congress) why we are sending billions of dollars to Ukraine while barely giving Maui fire victims barely anything. The US is already $33 trillion in debt with >$193 trillion in unfunded liabilites. I want to ask Biden and Congress HOW the US is going to afford $193 trillion in unfunded liabilites?

Of course, NO ONE wants to face the reality of the disastrous fiscal poliicies of Washington DC politicians. Not McConnell, not McCarthy, not Schumer and especially not Billions Biden. Remember 10% for The Big Guy where Democrats argue that is meaningless. Or mini-me, Robert Reich (Clinton’s labor secretary) who claimed that the US economy is the best he has ever seen! Yes, Reich, for the top 1%. Of couse, no one will ask fools like Reich how we will pay for $33 trillion in debt and the $193 trillion in unfunded liabilies … and fund a war in Ukreiane in seeming perpetuity.

My good friend Jesse has an excellent write-up on the upcoming KC Federal Reserve annual retreat at Jackson Hole, WYO. This retreat is just the US banking version of The World Economic Forum and Klaus Schwab. Know-it-all unelected elitists controlling our lives.

Argentina Tries Bidenomics! Inflation Rate At 118%, Mortgage Rates Hit 82.2% (350 Argentine Pesos for each US Dollar)

On Monday, Argentina’s central bank raised #interestrates to 118% as Argentina 30-year mortgage is now at a record 82.2%.

There is a record 350 Argentine Pesos for each US Dollar. All courtesy of Argentina’ version of Bidenomics … top down direction of spending and regulation and an out of control Central Bank.

Don’t cry for Argentina. .They voted for endless Peronist polices (Justicialist Party).

Say, are Joe and Jill Biden the new Juan and Eva Peron?

Global Treasury Yield Hits 15-Year High, Back To 2008 Despite No Change In Industrial Production (REAL 10Y Yield Now Highest Since 2009, Approaching 2%)

This is very strange. Global Treasury Yields just rose to a 15-year high (2008). This is primarily due to Central Bank moneta

And REAL 10-year Treasury yields also the highest since 2009.

At the same time, US industrial production is at the same level as pre-financial crisis (2007). Despite Federal Reserve monetary stimulypto (remember, The Fed’s balance sheet remains abouve $8 trillion.

This is Obama/Biden/Yellenomics. Trillions of dollars of fiscal (green) stimulus and monetary stimulus only to have industrial production be at the same level BEFORE The Great Recession and financial crisis.

July’s US Industrial Production … Returns To 2007 Levels Despite Staggering Fed Monetary Stimulus And Federal Government Spending Spree

Well, its now August 2023 and US Industrial Production for July increased … to 2007 levels. This comes after the massive spending out of Washington DC and massive Federal Rerserve stimulus.

Is that all there is??

US Industrial Production is DOWN -0.23% YoY while up slightly in MoM terms.

As I said a couple of days ago, the Obama/Biden economic model is a Soviet/Chinese Communist Party (CCP) style of COMMAND economics, not free market DEMAND economics.

As if dimwitted Mean Joe Biden has a clue.

Bidenomics? US Housing Starts UP 6% YoY, But Building Permits Stagnate In July As Mortgage Rates Topped 7% (MBA Purchase Demand Down -26% YoY, Down -2% WoW)

“Ice Cream Joe” Biden is at Lake Tahoe for a week, probably to avoid being asked questions about his tin-ear respoonse to the tragic Maui fires that have killed 106 people so far. Instead, Joe is inappropriately chuckling (showing he doesn’t care!) and taking photo ops of him eating ice cream. The Biden administration angered a lot of people when it was announced that households that have been affected by the fires would only be getting a one time emergency aid payment of $700 while he gives billions for Ukraine.

After last month’s surprisingly large declines, Housing Starts and Building Permits were expected to rebound modestly in July data released today (still losing altitude from May’s major surge).

At least housing starts were up 6% year-over-year (YoY).

However, the picture was more mixed with starts rising 3.9% MoM (vs +1.1% exp), but that was impacted by a notable downward revision in June (from -8.0% to -11.7%). Building Permits rose just 0.1% MoM (well below the 1.5% MoM expected).

On a SAAR basis, Permits disappointed (1.442mm vs 1.463mm exp) while Starts were in line at 1.452mm (up from a significantly downwardly-revised 1.398mm in June).

Source: Bloomberg

On the Permits side, single-family rose as multi-family fell:

  • Single-family up to 930K from 924K, highest since June 2022
  • Multi-family down to 464K from 465K, lowest since Oct 2020

July Housing Starts data followed the same trajectory with rental units growth underperforming single-family:

  • single-family housing up 6.7% to 983K, up from 921K, highest since May
  • multi-family housing unch at 460K, tied for lowest since July 2022

Additionally, we note that while Housing Starts and Completions remain well off their 2022 highs, Construction Jobs remain very close to those highs…

Source: Bloomberg

Finally, we note that Mortgage Bankers Association data released earlier this morning showed applications for home purchases dropped again last week (back near 1996 lows) as the contract rate on a 30-year fixed mortgage surged above 7% (highest since Dec 2001).

Source: Bloomberg

This won’t end well.

Speaking of not ending well, mortgage applications decreased 0.8 percent from one week earlier, according to data from the Mortgage Bankers Association’s (MBA) Weekly Mortgage Applications Survey for the week ending August 11, 2023.

The Market Composite Index, a measure of mortgage loan application volume, decreased 0.8 percent on a seasonally adjusted basis from one week earlier. On an unadjusted basis, the Index decreased 2 percent compared with the previous week. The Refinance Index decreased 2 percent from the previous week and was 35 percent lower than the same week one year ago. The seasonally adjusted Purchase Index decreased 0 percent from one week earlier. The unadjusted Purchase Index decreased 2 percent compared with the previous week and was 26 percent lower than the same week one year ago.

How To Stop Inflation Without A Recession? Slow Federal Spending And Shrink The Fed Balance Sheet (Return To Demand Economy From Obama/Biden’s Command Economy)

Inflation is a killer to the middle class and low-wage worker. Yet there are always apologists for terrible Federal spending and Federal Reserve monetary policies. Like Alex Bereson with his “How we stopped inflation without a recession (hint: by not stopping inflation).”

Before I look at Berenson’s plea for more inflation, let’s see where Federal spending and Fed Monetary policies have left us. As of this morning, the REAL US Treasury 10-year yield (nominal yield less inflation), is now the highest since two crises ago, meaning The Great Recesssion and the first major overreaction of The Federal Reserve in late 2008.

Here is Berenson’s chart showing changes in inflation (CPI YoY) from 1966-1982 compared with recent inflation (orange) from 9/30/2013 – 06/30/2023. A charist might get confused and assume that inflation is will start rising again. But it is far more complicated than a simple projection.

One of the complications to the narrative is the change in the US economy after the Carter recession of 1980 and the inherited recession inherited by Reagan from Carter from 1981-2.

Since 1982 and the Carter recessions, we have seen incredible growth in Federal spending and when the proved insufficient, a massive increase in Fed monetary stimulus in late 2008 and then again in 2020 due to Covid. Remember Winston Churchill’s quote regarding water, “Never let a good crisis go to waste.” That has morphed into a battle cry for more government spending and regulation, not to mention Federal Reserve monetary policies.

Notice that core inflation under Carter (green line) was gut wrenching (yet Berenson just shrugs it off). Core inflation is still at a horrible 4.7% YoY. But you can see the spikes in Federal spending (blue line) and Fed Monetary stimulus (red line) associated with the financial crisis of 2008-2009 and Covid 2020-2021.

Then we have the Federal budget deficit, still over $1 trillion (despite perpetually confused President Biden claiming he got rid of the deficit). Meanwhile, The Federal Reserve still has over $8 TRILLION in monetary stimulus sloshing around the financial system.

Inflation is a horrifying by-product of Federal spending and Fed monetary policy (especially under Fed Chair Janet Yellen). Unfortunately, Yellen is now the US Treasury Secretary. For example, REAL average hourly earnings are declining thanks to inflation.

Berenson closes his piece with this sobering statement: “Ultimately, this pattern is why inflation is so problematic. It is addictive, and breaking the addiction means damaging the economy.”

Its Federal spending that addictive, and eventually Congress has to cut its insane spending levels. Even if it lowers GDP and increases unemployment. Take a look at China, a command economy, that is really suffering despite massive government spending.

Berenson is saying “all the Biden defenders are saying we’ve won the battle with inflation. But how can that be so with how much we’ve spent?” I agree, but will Washington DC ever learn? I doubt it.

Under Obama/Biden, the US economy is transitioning from a demand economy to a Soviet/Chinese-style command economy where central government directs economic traffic. We need to bite the bullet and return to a deamnd economy.