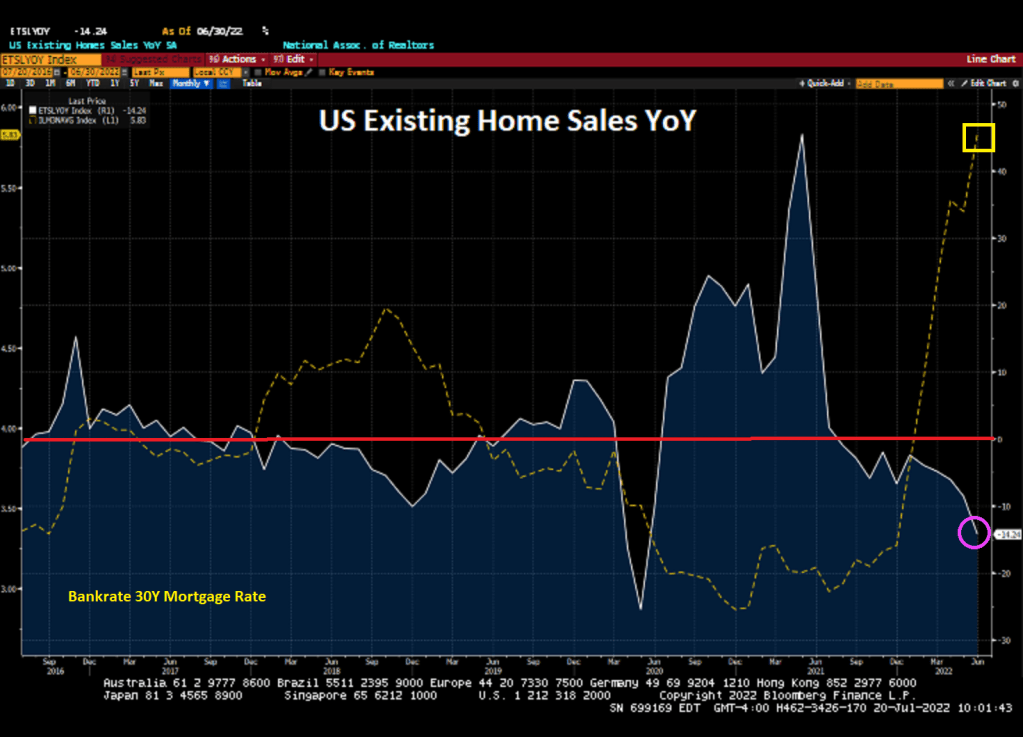
After breaking the 6% barrier back in June 2022, Bankrate’s 30-year mortgage rate has backed-off to 5.28% despite Federal Reserve rate hikes.
The reason for the decline in the US Treasury 10-year is, amongst other things, a global economic slowdown (partly due to the US and Europe “going green” and cutting the supply of fossil fuel-based energy). Instead of “The Great Reset,” I call it “The Great Economic Suicide.” The 10-year US Treasury yield and Bankrate’s 30-year mortgage rate are declining with declining global GDP.
Instead of The Boston Strangler, we now have the DC Strangler. Better known as The Federal Reserve and their war on inflation.
US existing home sales crashed -14.24% YoY and -5.40% MoM in June as The Fed tightens its icy grip on the housing market. Existing home sales were lower than expected at 5.12 million home sold SAAR.
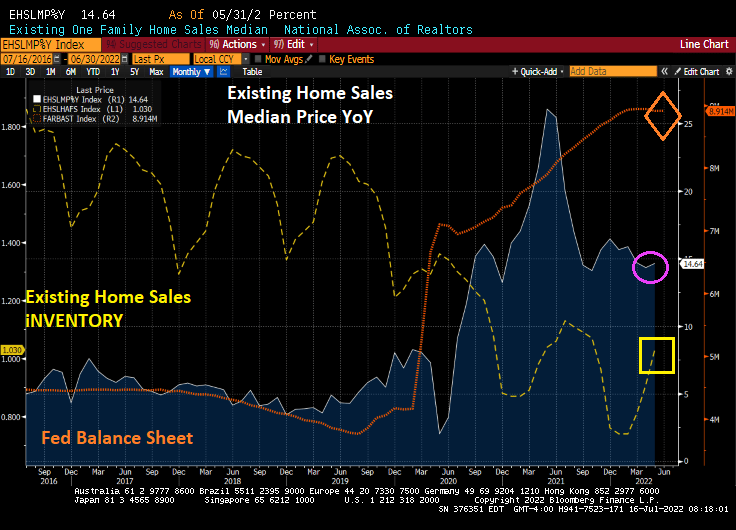
Median price for existing home sales declined to 13.27% YoY as inventory available for sale remains MIA. And The Fed’s balance sheet is still out in force.
The US housing market in terms of sales has entered a bear market, but with The Fed’s balance sheet stimulus still hunting asset prices, it is a grizzly bear market in terms of affordability.
Mortgage rates are rising in part thanks to The Federal Reserve trying to control inflation (caused by Biden’s energy policies and spending). But mortgage rates are down slightly today.
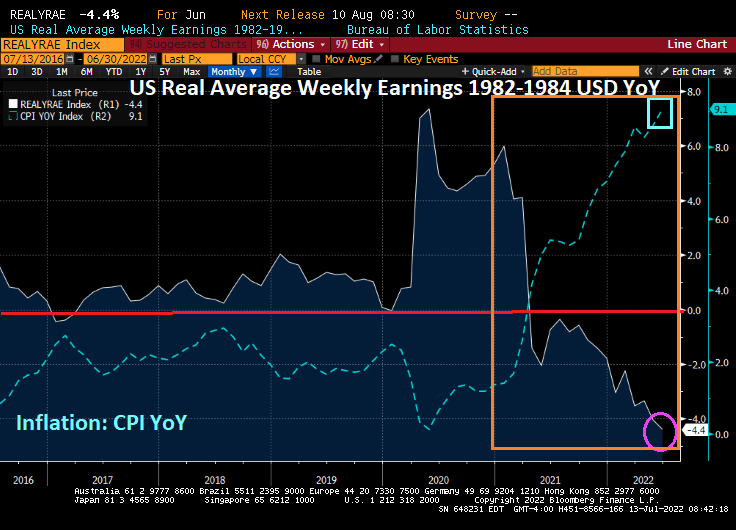
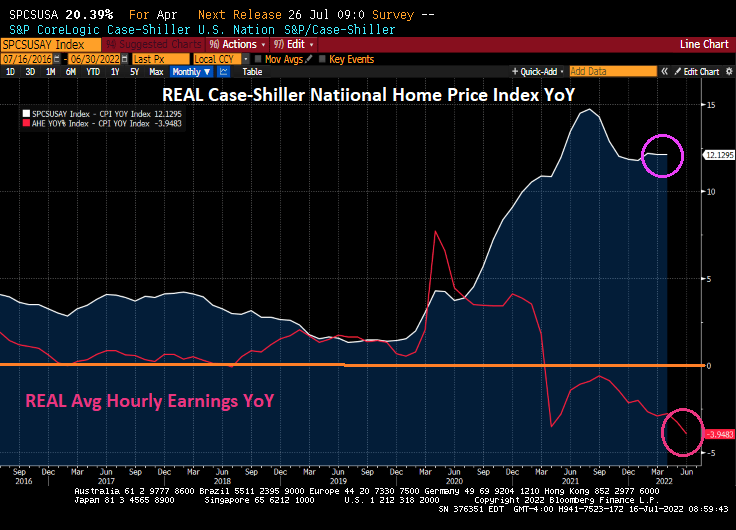
Bear in mind that REAL wage growth is negative, thanks to Bidenflation.
The US is short on supply of housing for a myriad of reasons (high costs, Not-in-my-backyard (NIMBY) local zoning laws, etc), but The Fed’s cranking up interest rates isn’t helping.
US housing starts, a measure of supply, declined -6.3% YoY in June as The Fed cranked up rates.
1-unit (aka, single family detached) starts dropped -8.05% MoM in June while 5+ unit (aka, multifamily) starts rose 15% MoM.
1-unit permits dropped -8% MoM in June while 5+ unit starts were up 13% MoM.
The reason? REAL weekly earnings growth declined -4.4% YoY in June thanks to Bidenflation.
The Federal Reserve has behaved like buckaroos! Why? Since the financial crisis, The Fed has left its enormous monetary stimulus outstanding for too long.
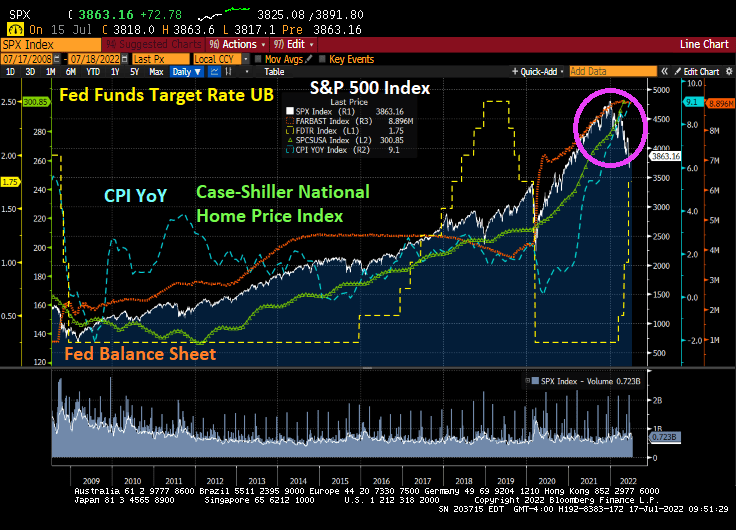
The Fed initiated asset purchases in a series of moves (aka, QE) culminating in Covid QE that has been barley removed. With The Fed’s stimulypto (and Federal spending), we have seen the S&P 500 index soar along with home prices.
Of course, this begs the question as to whether the stock market and housing market can withstand The Fed’s tightening plans.
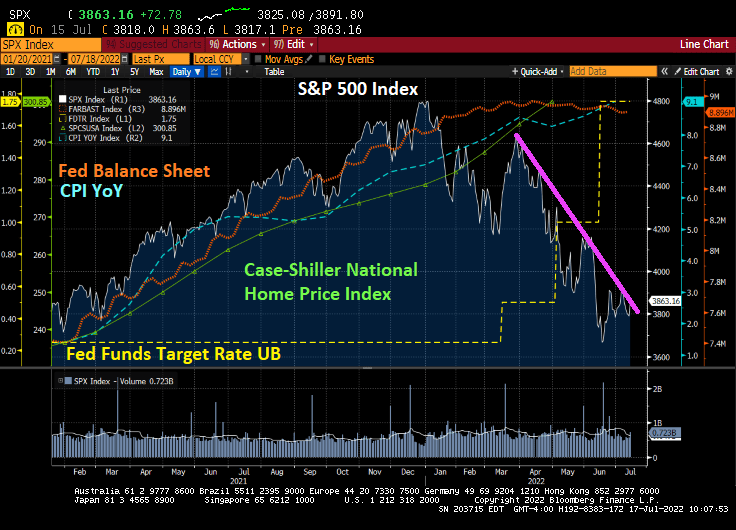
A closer look at the S&P 500 index and the Case-Shiller National home price index under Biden. The S&P 500 has been declining since The Fed started their monetary tightening. But the Case-Shiller National home price index as of April ’22 was still soaring.
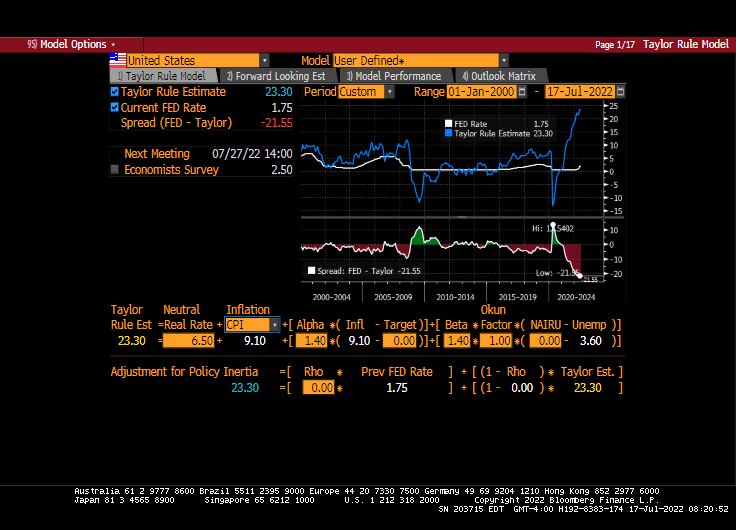
With inflation at a 40-year high, the Taylor Rule suggests a Fed target rate of … 23.30%. It is currently at 1.75%. That is an unrealistic target rate that The Fed will never do. It is, in fact, a Bridge Too Far.
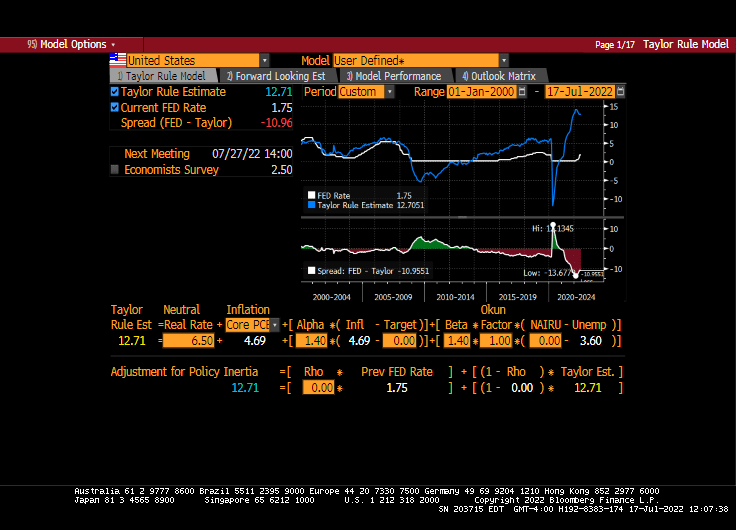
How about the Taylor Rule using Core PCE? It is still 12.71%. Still a bridge too far!
Markets are conditioned to massive Fed stimulypto, so how will markets react to stimulus reduction?
While The Fed is intent on withdrawing SOME of the enormous monetary stimulus, they are still buckaroos. And Biden/Congress still want to distort markets by Federal spending such as the Build Back (Inflation) Better bill that Manchin has blocked … so far.
Housing in the US is simply unaffordable for the middle class and low-wage workers. Combine rising food costs and gasoline/heating costs, and we have an economic disaster on our hands.
US existing home sales for June will be released on Wednesday. But can The Fed kill-off home price inflation?
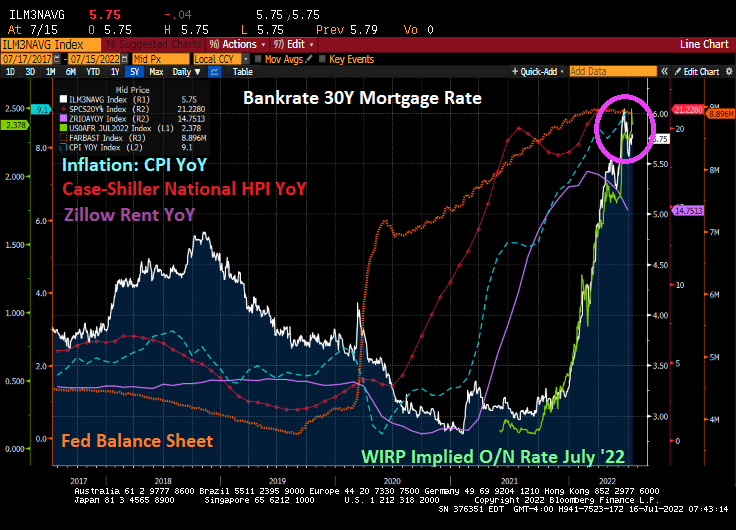
A preliminary analysis of existing home sales for June is for a seasonally adjusted annual rate of 5.1 million, down 5.4% from May and down 14.2% from last June. As The Fed cranks up its target rate (green line) and eventually shrinking its balance sheet, we will see further shrinking of existing home sales this summer.
But home price inflation remains high (Case-Shiller National home price index at 21.23% YoY, Zillow’s rent index at 14.75% YoY) while the Consumer Price Index YoY is at 40-year high of 9.1% YoY. In other words, home price inflation is 233% of the stated inflation rate from Uncle Sam.
May’s existing home sales report was … sobering. There is still historically low levels of available inventory and median sales price of existing home sales was 14.64% YoY. Of course, the alternative to ownership is renting which is growing at 14.75% YoY. Simply unaffordable.
The gap between REAL home price growth (12.13% YoY) and REAL average hourly earnings (-3.95% YoY).
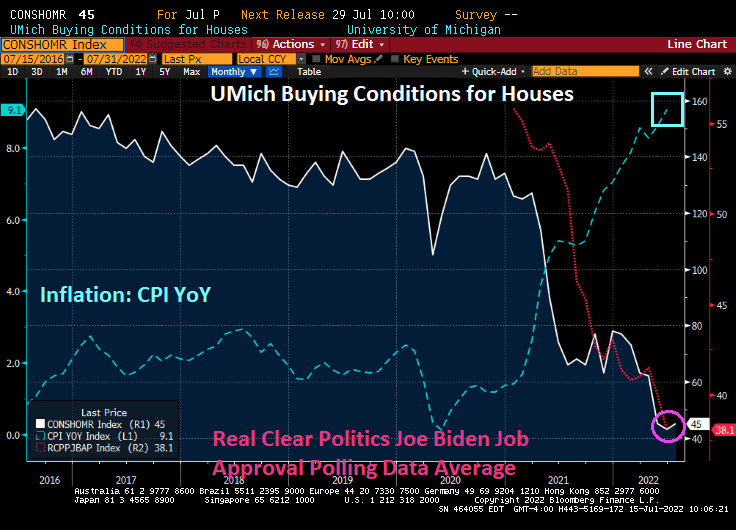
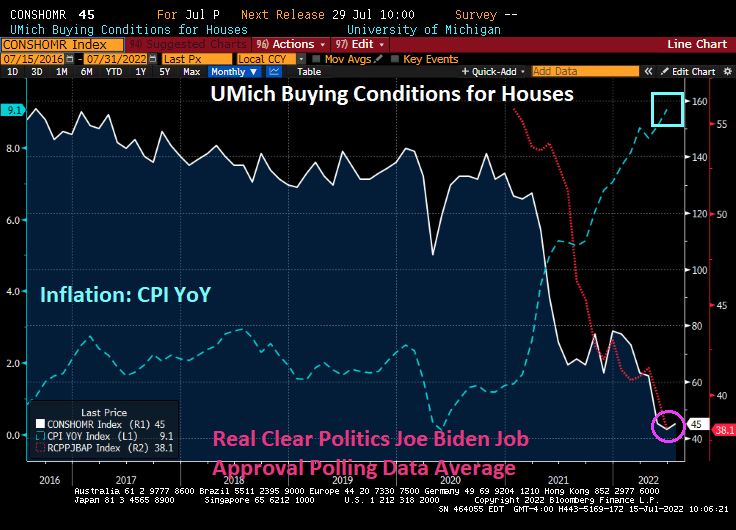
Consumer sentiment for housing is near the lowest level since 1982.
The Fed seems determined to remove the punch bowl in its efforts to crush inflation. But will The Fed’s efforts also crush the housing and mortgage market?
One measure of how bad things are in the US for the middle-class and low-wager workers ix consumer sentiment from University of Michigan. The latest University of Michigan survey of consumers remains depressed at 51.1.
The consumer sentiment index was at 80.7 at the beginning of 2021, but has plunged dramatically with rising gasoline, food and inflation in general. Biden’s popularity has sunk from 55.8 in January 2021 to 38.1 today.
How about housing sentiment? Housing sentiment was 134.0 in January 2021 but has plunged to a depressing 45 with inflation and rising home prices (and rent). And with declining sentiment about housing, Biden’s popularity has plunged.
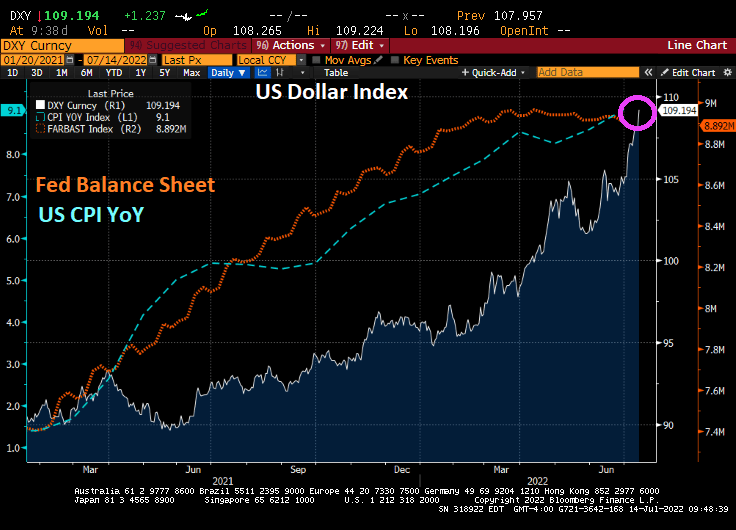
Bear in mind that a strong dollar is a two-edged sword. The US Dollar Index has risen 16% year-over-year, presenting a big hurdle for US firms with business overseas.
That strength of the greenback will rise until the Fed makes a dovish policy pivot.
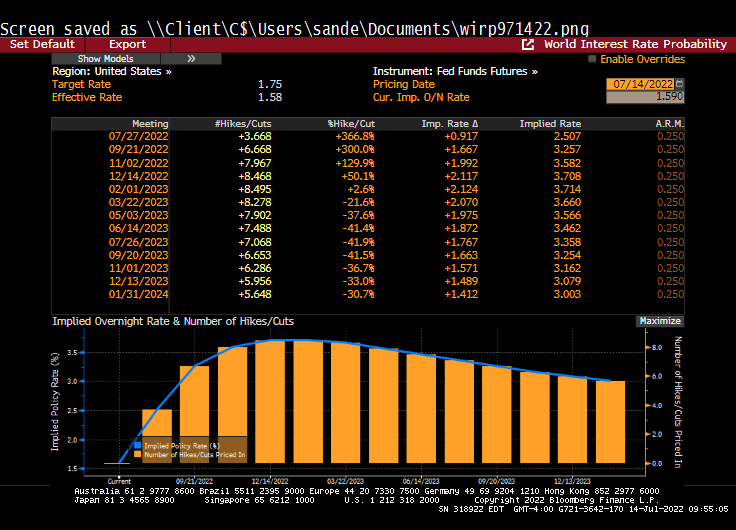
And that pivot is forecast to occur at the Feb ’23 FOMC meeting.

















You must be logged in to post a comment.