The US is Living La Vida Biden (living the Biden life!) Which means you are making millions if you are a political elite, but suffering if you live on Main Street.
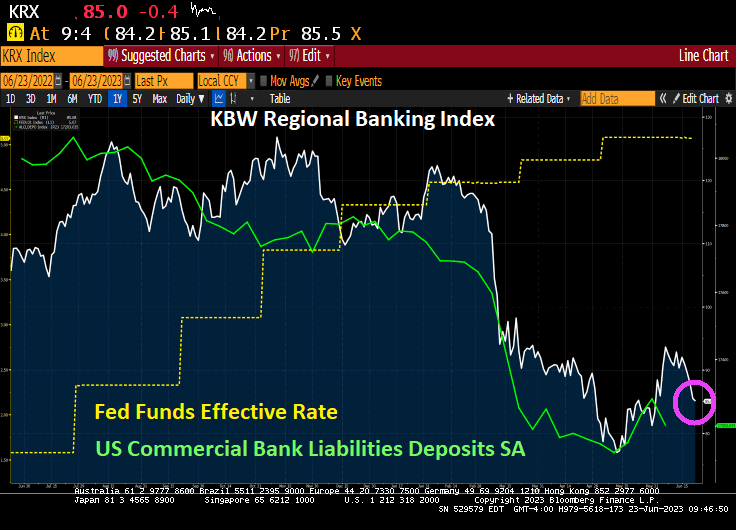
And regional banks (not the TBTF national banks) continue to suffer. The Bank Term Funding Program (1 of 2) is skyrocketing as The Fed cranks up rates to fight BidenFedflation (a combination of excessive monetary stimulus by The Fed and Biden’s lousy economic policies) and M2 Money growth crashes.
The regional banking index continues to fall as bank deposits shrink (like me when I used to jump in the Pacific Ocean in Santa Cruz).
Cryptos down this morning. But Bitcoin is above $30,000 … again.
Oil is down this morning but gold and silver are up slightly.
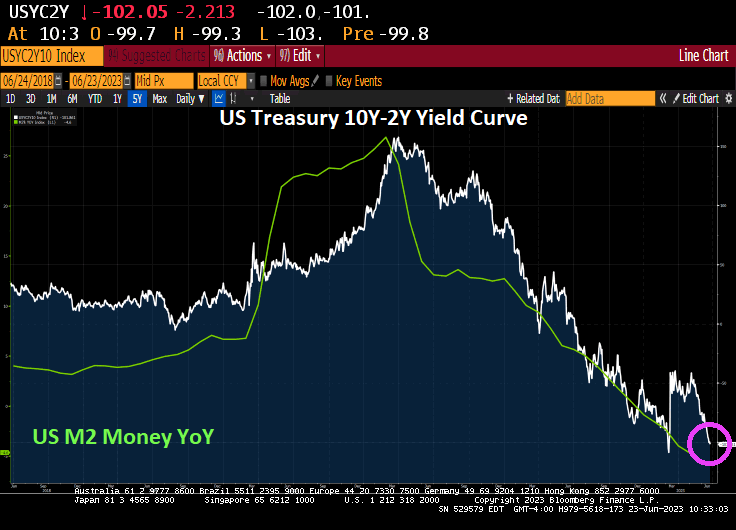
The 10Y-2Y US Treasury yield curve just dipped below -100 basis points (steep inversion) as M2 Money growth crashed and burned.
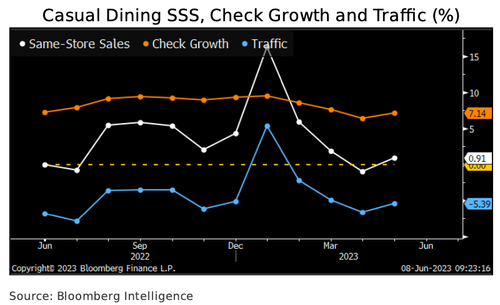
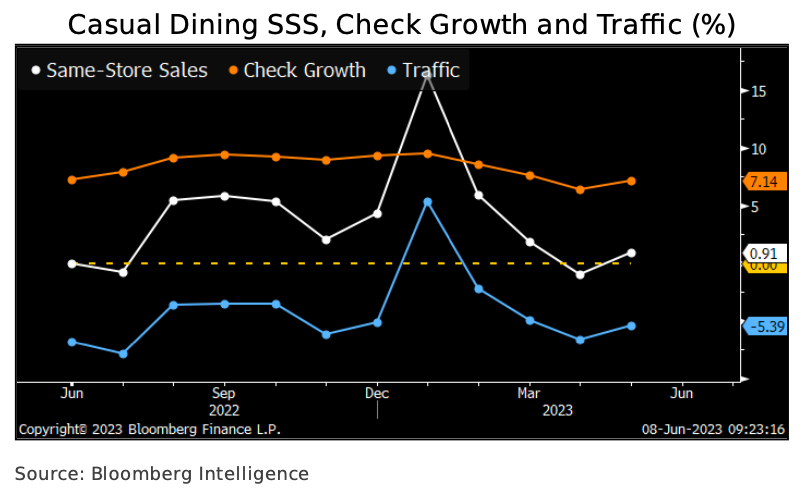
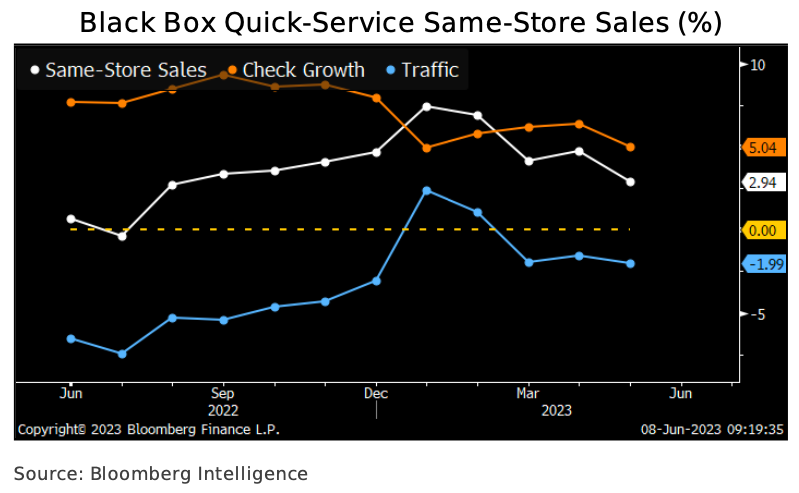
Bloomberg Intelligence’s Michael Halen penned a new note titled “2H Restaurant Sales: Inflation Killing Appetites.” It outlines, “Consumer spending finally buckles under more than two years of inflation and price hikes,” and the likely result is a trade-down of casual-dining chains like Brinker and Cheesecake Factory for quick-service chains like McDonald’s and Wendy’s.
The trade-down, which could start as early as this summer, is expected to dent consumer spending in restaurants such as Cheesecake Factory, Texas Roadhouse, and at brands operated by Brinker and Darden, Halen said.
Casual-dining industry same-store sales rose just 0.9% in May, according to Black Box Intelligence, as traffic dropped 5.4%. We expect cash-strapped low- and middle-income diners to cut restaurant visits and checks through year-end due to more than two years of real income declines and ballooning credit-card balances.
Halen provides more details about quick-service restaurants to fare better than causal-dining ones as “consumer spending finally buckles.”
Quick-service restaurants’ same-store sales could moderate with consumer spending in 2H but should fare better than their full-service competitors. Results rose 2.9% in May, according to Black Box data, as a 5% average-check increase was partly offset by a 2% guest-count decline. Check- driven comp-store sales gains are unsustainable, and we think inflation and menu price hikes will motivate low- and middle-income diners to reduce restaurant visits and manage their spending in 2H. On Domino’s 1Q earnings call, management said lower-income consumers shifted delivery occasions to cooking at home. Still, a trade-down from full-service dining due to cheaper price points may cushion the blow.
McDonald’s, Burger King, Wendy’s, and Jack in the Box are among the quick-service chains in Black Box’s index.
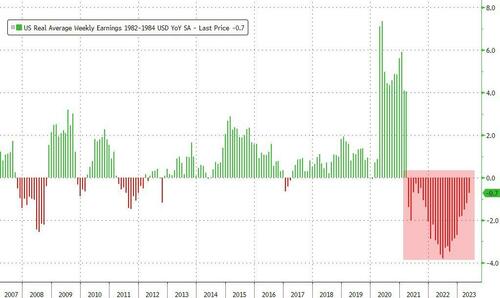
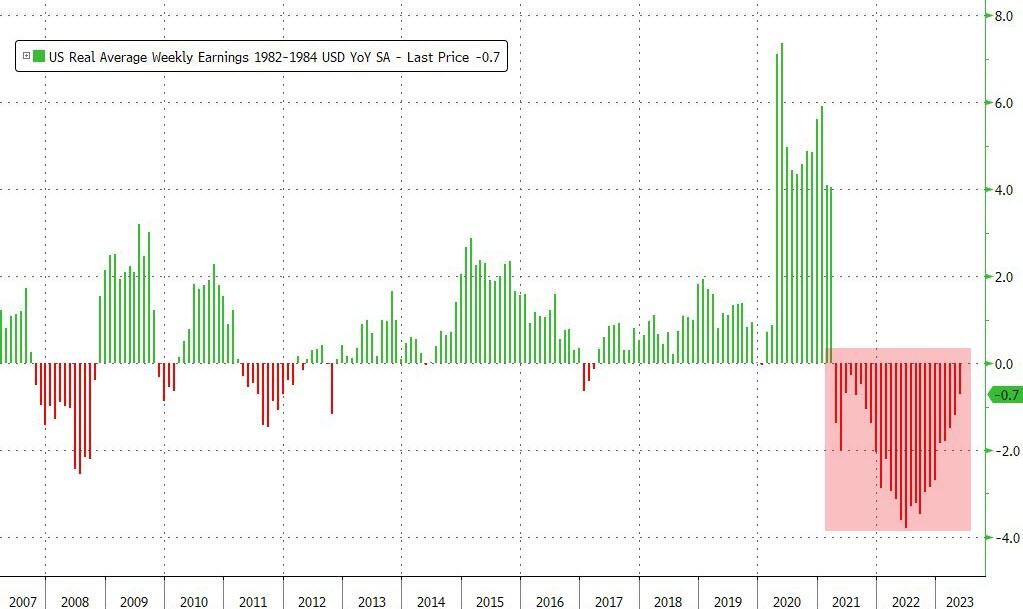
The latest inflation data shows consumers have endured the 26th straight month of negative real wage growth. What this means is that inflation is outpacing wage gains. And bad news for household finances, hence why many have resorted to record credit card usage.
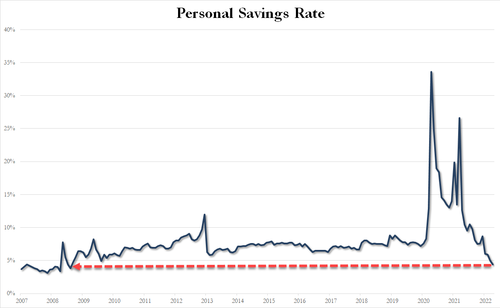
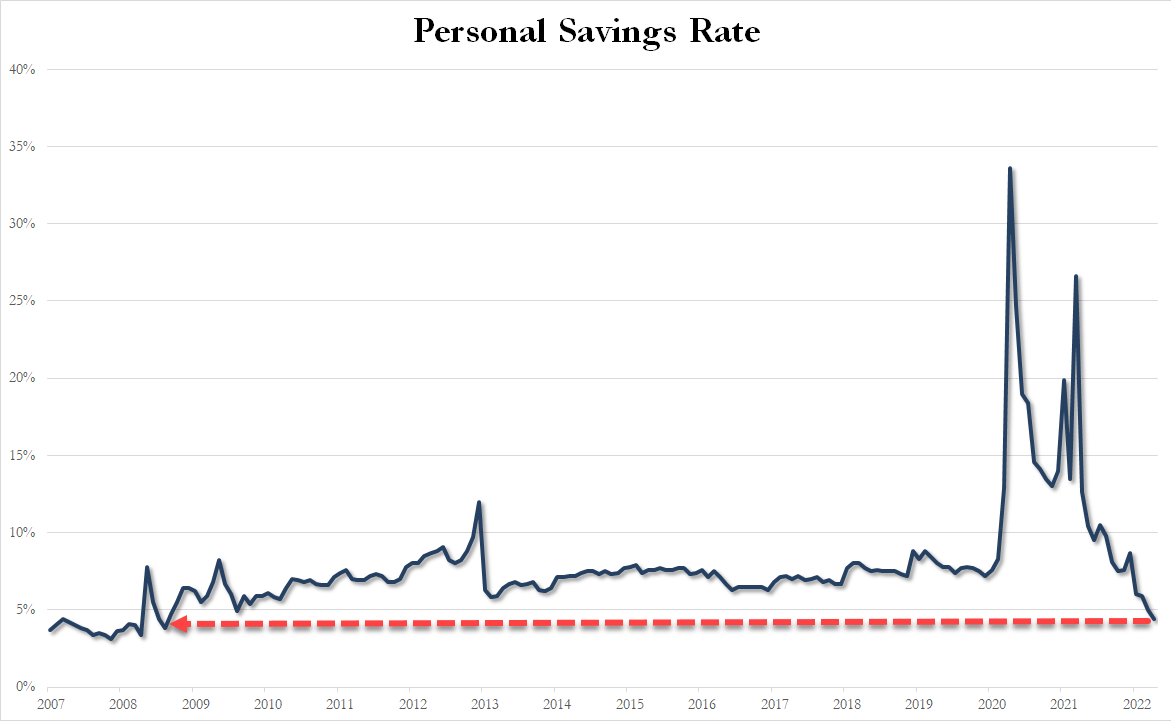
And the personal savings rate has collapsed to just 4.4%, its lowest level since Sept. 2008 (the dark days of Lehman). And why is this? To afford shelter, gas, and food, consumers are drawing from emergency funds due to the worst inflation storm in a generation.
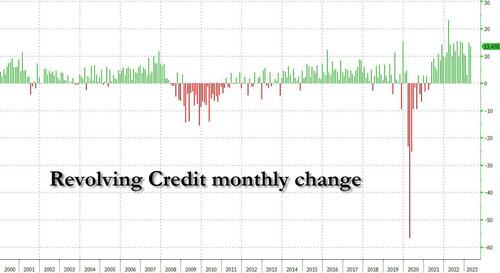
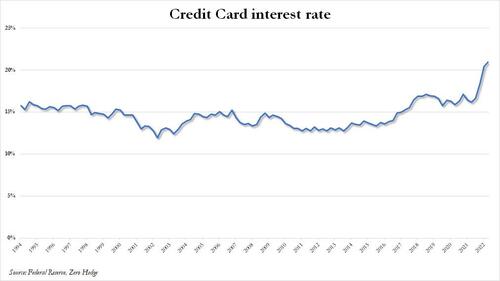
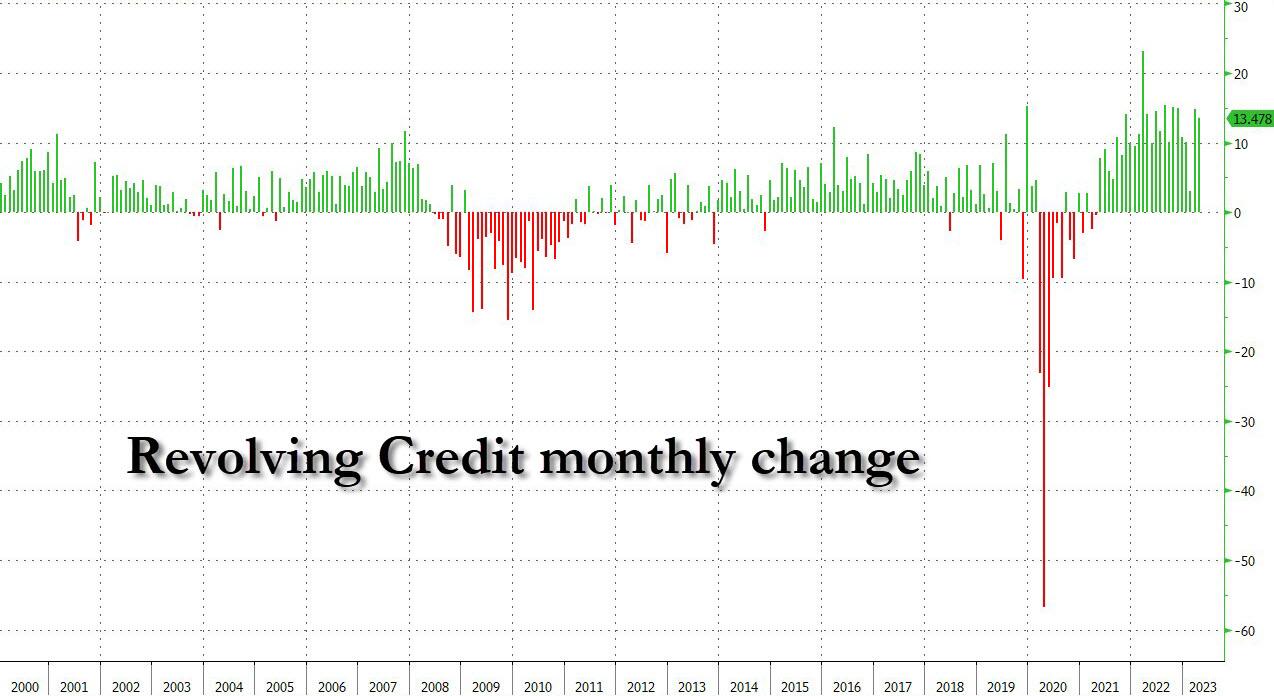
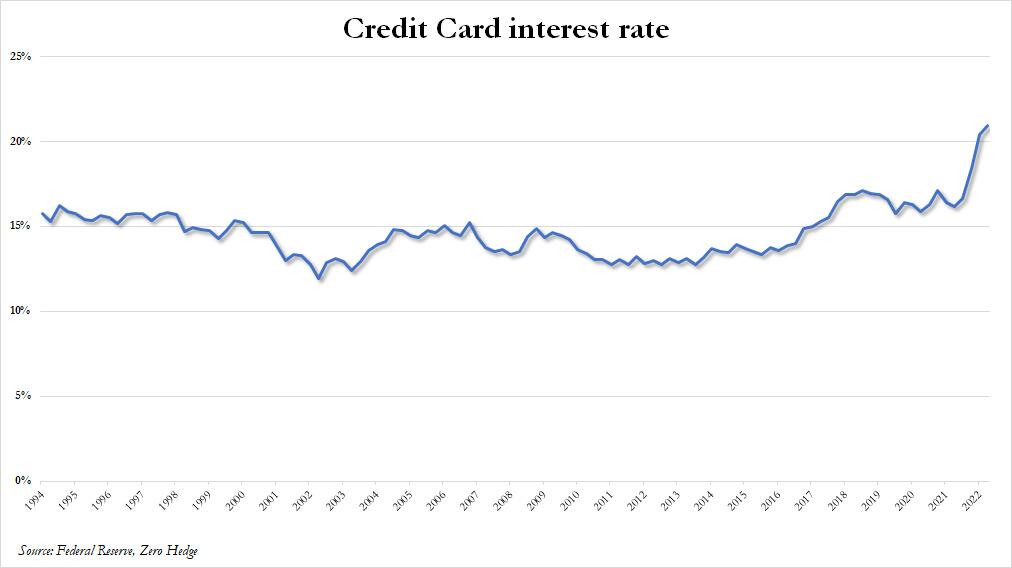
As revolving consumer credit has exploded higher and the last two months have seen a near-record increase…
… even as the interest rate on credit cards has jumped to the highest on record.
With record credit card debt load and highest interest payments in years, plus depleted savings, oh yeah, and we forgot, the restart of student loan payments later this year, this all may signal a consumer spending slowdown at causal diners while many trade down for McDonald’s value menu. Even then, we’ve reported consumers have shown that menu items at the fast-food chain have become too expensive.
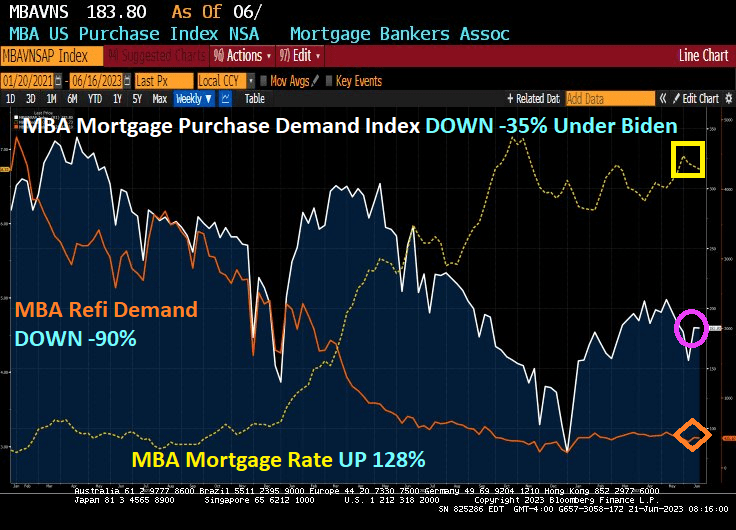
The good news? Mortgage purchase demand fell only -0.05% from last week. The bad news? Mortgage purchase demand is down -35% since Resident Biden was sworn in. And mortgage refinancing demand is down a whopping -90%. Reason? Mortgage rates are up 128% under Clueless Joe.
Mortgage applications increased 0.5 percent from one week earlier, according to data from the Mortgage Bankers Association’s (MBA) Weekly Mortgage Applications Survey for the week ending June 16, 2023.
The Market Composite Index, a measure of mortgage loan application volume, increased 0.5 percent on a seasonally adjusted basis from one week earlier. On an unadjusted basis, the Index decreased 1 percent compared with the previous week. The Refinance Index decreased 2 percent from the previous week and was 40 percent lower than the same week one year ago. The seasonally adjusted Purchase Index increased 2 percent from one week earlier. The unadjusted Purchase Index decreased 0.1 percent compared with the previous week and was 32 percent lower than the same week one year ago.
And as Paul Harvey used to say, here is the rest of the story.
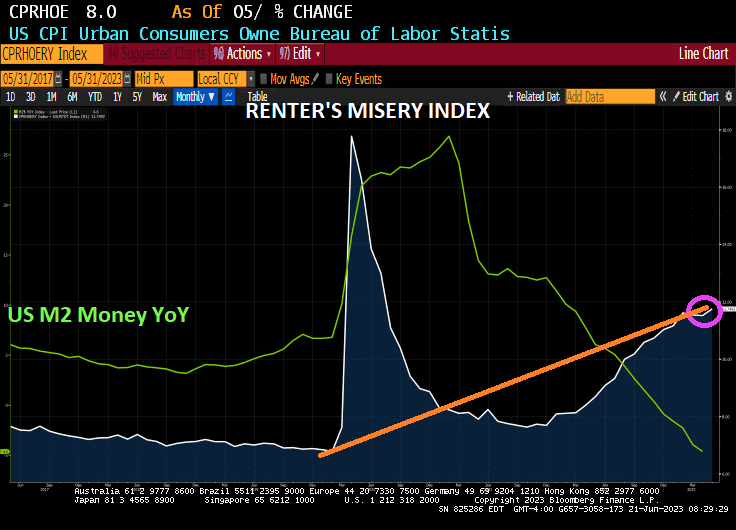
And the renter’s misery index, CPI for owner’s equivalent rent YoY + U-3 unemployment rate, is now a staggering 11.75% verus 6.78% in February 2020, the last month before the Chinese Wuhan virus led to economic and school shutdowns. And we have Donald Trump as President instead of this corrupt clown.
What is the difference between baseball legend Shoeless Joe Jackson and Clueless Joe Biden? While both sold out their teams for personal wealth, at least Shoeless Joe was good at baseball. Clueless Joe is a corrupt bully. Shoeless Joe was allegedly stupid, but so is Clueless Joe.
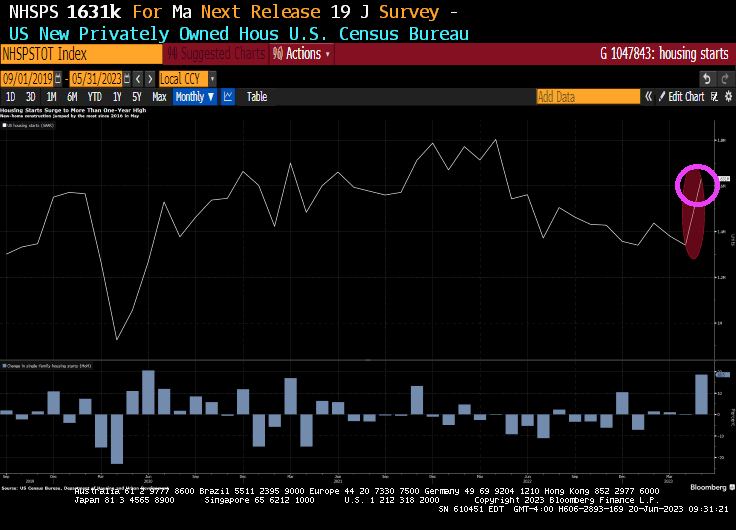
Well, not really unexpected since the housing sentiment index for home builders was above 50 yesterday. But with The Fed pausing rate hikes, housing starts are soaring!
US housing starts unexpectedly surged in May by the most since 2016 and applications to build increased, suggesting residential construction is on track to help fuel economic growth.
Beginning home construction jumped 21.7% to a 1.63 million annualized rate, the fastest pace in more than a year, according to government data released Tuesday. The pace exceeded all projections in a Bloomberg survey of economists. Single-family homebuilding rose 18.5% to an 11-month high.
Applications to build, a proxy for future construction, climbed 5.2% to an annualized rate of 1.49 million units. Permits for one-family dwellings increased.
Metric
Actual
Est.
Housing starts (SAAR)
1.63 mln
1.4 mln
One-family home starts (SAAR)
997,000
na
Building permits (SAAR)
1.49 mln
1.425 mln
One-family home permits (SAAR)
897,000
na
The figures corroborate Federal Reserve Chair Jerome Powell’s comments last week that the housing market has shown signs of stabilizing. Homebuilders, which are responding to limited inventory in the resale market, have grown more upbeat as demand firms, materials costs retreat and supply-chain pressures ease.
The housing starts data will feed into economists’ estimates of home construction’s impact on second-quarter gross domestic product. Prior to the report, the Atlanta Fed’s GDPNow forecast had residential investment subtracting about 0.1 percentage point from gross domestic product. Homebuilding last contributed to growth in the first quarter of 2021.
At the same time, elevated mortgage rates are crimping affordability, suggesting limited momentum in housing demand.
The increase in starts from a month earlier was the biggest since October 2016 and reflected gains in three of four US regions. Starts of apartment buildings and other multifamily projects jumped more than 27%.
The number of homes completed increased to a 1.52 million annualized rate. The level of one-family properties under construction were little changed at 695,000.
Existing-home sales data for May will be released on Thursday, while a report on new-home purchases is due next week.
Now only has The Fed paused, but the most recent Fed Dots Plot reveals that Fed open market committee (FOMC) members see The Fed slashing rates over the coming years. Just in time for creepy, demented Grandpa Joe to be reelected as President. In other words, the return of ZORP (zero outrageous rate policy).
Maybe The Fed should adopt the Coca Cola slogan “The Pause That Refreshes!”
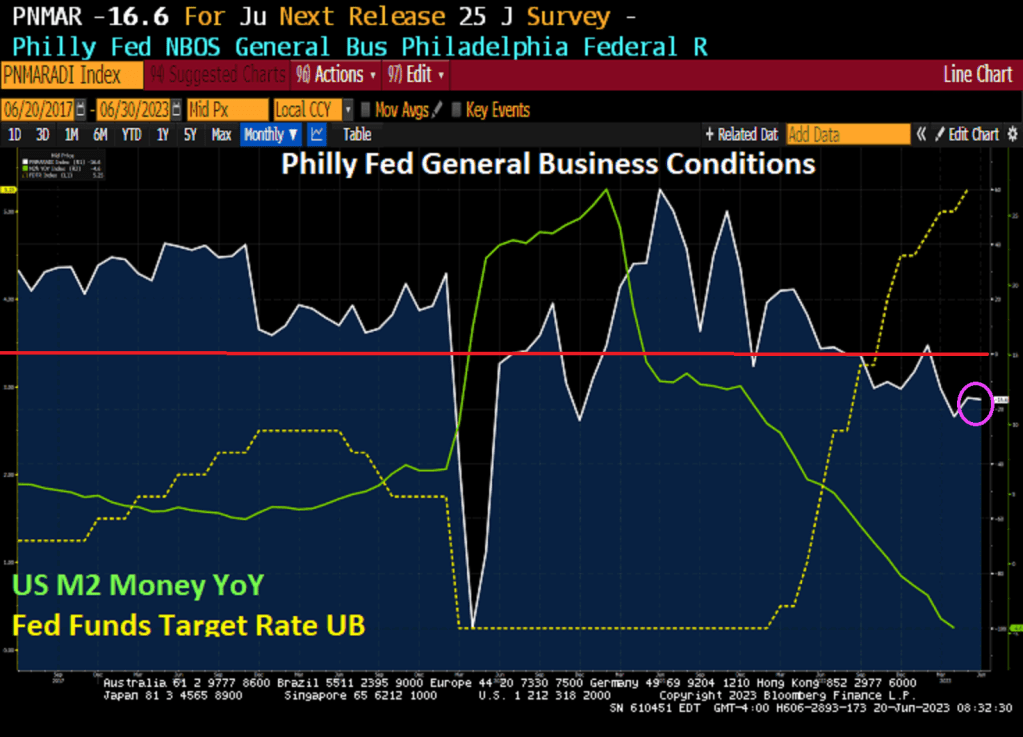
Now we have more evidence of an impending recession with the Philly Fed General Business Conditions index falling to -16.6 in June as Green Man (M2 Money growth) stalls.
Federal Reserve Chair Jerome Powell (aka, Green Man) will have an opportunity this week to clarify what many found a confusing message on the path of interest rates, with the added task of assuring Democrats and Republicans the economy is on track.
The Fed chief will face questions from lawmakers on Wednesday and Thursday, his first testimony on Capitol Hill since early March, before banking-sector turmoil prompted sharp criticism of the Fed and forced officials to rethink their policy strategy. Since then, the most acute financial strains have eased, but questions remain about the extent to which tighter credit will weigh on the economy, and what that means for the Fed.
Powell will need to reassure Republicans the Fed is not backing down from its campaign to contain price pressures, while pointing Democrats to the resilience of the economy as officials prepare to raise rates further this year.
“The Democrats are nervous because they would rather declare victory and move on,” said Stephen Myrow, a managing partner at Beacon Policy Advisors and a former George W. Bush Treasury official. “I think they’re going to try to caution this time against further increases. But Republicans are just going to hammer away and act like inflation hasn’t come down.”
Powell will be fresh off the Fed’s June 13-14 meeting, where he and his colleagues left rates unchanged for the first time in 15 months but signaled they may deliver two more hikes this year. Fed watchers and investors struggled to digest the message from Powell’s post-meeting press conference, and lawmakers last week said they planned to press him for an explanation.
“Right now there’s a lot of confusion about the next step,” Thom Tillis, a Republican senator from North Carolina, said Thursday.
Well, Senator Mel Tillis, there is no confusion. The DC Elites and Big Banks don’t want to disrupt the flow of money to the political donor class (including China and Ukraine payments to Biden’s family, now up to $30 million). The Fed may raise rates one more time and claim victory again their “War on Inflation!” then start cutting again as the Presidential election approaches.
On the commodity side, Spot Silver is up 1.46%. Iron Ore is up 1.60%, but I don’t think my neighbors would appreciate me taking delivery on 10 tons of iron ore on my driveway! Heating oil is up 2.90%.
On the crypto side, bitcoin is up 20.84 (0.08%) with Ethereum up slightly more.
Bitcoin and silver doing well as the US Dollar loses ground since September 2022.
I wonder if Biden’s proposed railroad from the Pacific to the Indian Ocean will generate massive industrial production growth? Is this more Bidenomics??
Industrial production edged down 0.2 percent in May following two consecutive months of increases. The Bloomberg Econoday consensus was a small increase.
In May, the index for manufacturing ticked up 0.1 percent, while the indexes for mining and utilities fell 0.4 and 1.8 percent, respectively.
The index for motor vehicles and parts moved up 0.2 percent in May after jumping nearly 10 percent in April.
At 103.0 percent of its 2017 average, total industrial production in May was 0.2 percent above its year-earlier level.
Capacity utilization moved down to 79.6 percent in May, a rate that is 0.1 percentage point below its long-run (1972–2022) average.
Peak Months For 5 Indexes
Industrial Production: September 2022, 103.5
Manufacturing: October 2022, 101.2
Motor Vehicles and Parts, new high this month, 112.1
Consumer Durable Goods: April 2022, 109.4
Manufacturing Durable Goods: January and April 2023: 129.8
Despite the strength in autos, no debt led by Biden’s EV push and subsidies, manufacturing production is still below where it was seven month’s ago.
A long term chart better shows the trends.
Industrial Production Index Since 1972
Industrial production data from the Fed, Chart by Mish
Recession Lead Time After Industrial Production Peak
Industrial production data from the Fed, peak calculation and Chart by Mish
Peaks in industrial production tend to mark recessions.
Industrial production and manufacturing industrial production peaked eight and seven months ago respectively.
Politically speaking, if you are going to have a recession on your watch, it’s much better to have it early in your term than heading into an election campaign. But here we are.
Inflation is still not under control, and this economy is certainly not firing on all cylinders.
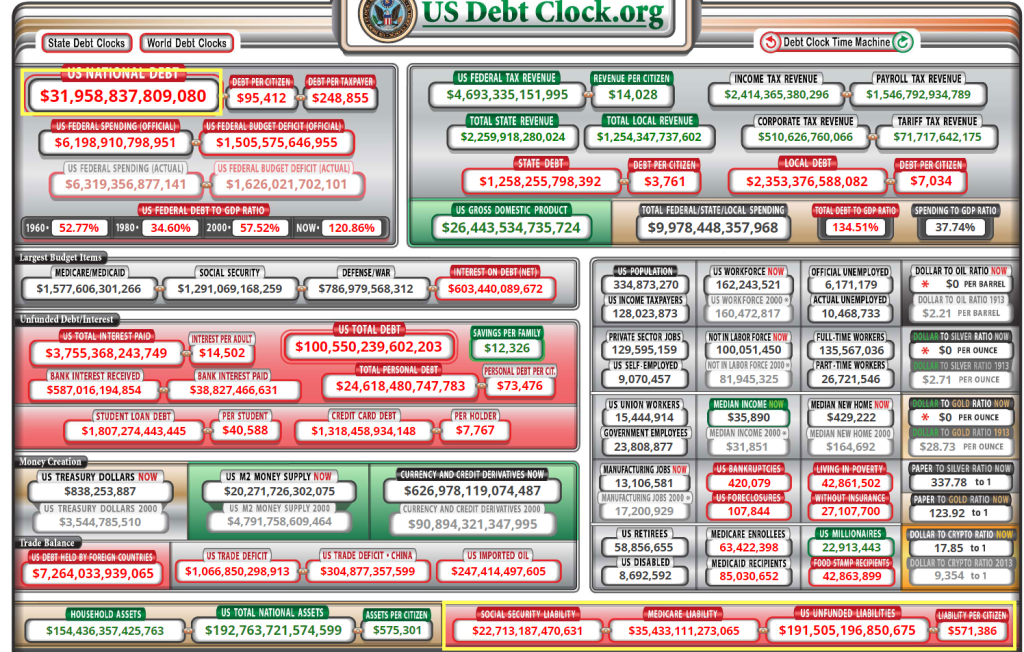
So, since the coronation of King Barack in 2009, US public debt has grown by 200% and just breached $32 trillion. US M2 Money is up 152% since Obama/Biden and The Fed’s Balance sheet is up 275% and M2 Money Velocity is down -30% since Obama/Biden.
Fed Governor Christopher Waller said Friday headline inflation has been “cut in half” since peaking last year, but prices excluding food and energy (aka, CORE inflation) has barely budged over the last eight or nine months.
“That’s the disturbing thing to me,” Waller said during a question-and-answer session following a speech in Oslo, Norway. “We’re seeing policy rates having some effects on parts of the economy. The labor market is still strong, but core inflation is just not moving, and that’s going to require probably some more tightening to try to get that going down.”
At a separate event Friday, Richmond Fed President Thomas Barkin said inflation remained “too high” and was “stubbornly persistent.”
“I want to reiterate that 2% inflation is our target, and that I am still looking to be convinced of the plausible story that slowing demand returns inflation relatively quickly to that target,” Barkin said in a speech in Ocean City, Maryland. “If coming data doesn’t support that story, I’m comfortable doing more.”
The Federal Open Market Committee paused its series of interest-rate hikes Wednesday, but policymakers projected rates would move higher than previously expected in response to surprisingly persistent price pressures and labor-market strength.
The consumer price index this week showed headline inflation slowed, but core prices excluding food and energy continued to rise at a pace that’s concerning for Fed officials. Employers continued adding jobs at a rapid clip in May, and job openings climbed in April, recent data showed.
Barkin warned that prematurely loosening policy would be a costly mistake.
“I recognize that creates the risk of a more significant slowdown, but the experience of the ’70s provides a clear lesson: If you back off inflation too soon, inflation comes back stronger, requiring the Fed to do even more, with even more damage,” he said. “That’s not a risk I want to take.”
Policy Report
Separately, the Fed released a new report Friday that said tighter US credit conditions following bank failures in March may weigh on growth, and that the extent of additional policy tightening will depend on incoming data.
“The FOMC will determine meeting by meeting the extent of additional policy firming that may be appropriate to return inflation to 2% over time, based on the totality of incoming data and their implications for the outlook for economic activity and inflation,” the Fed said in in its semi-annual report to Congress.
Read More: Fed Says Tighter Credit Conditions to Weigh on US Growth
The Fed report, which provides lawmakers with an update on economic and financial developments and monetary policy, was published on the central bank’s website ahead of Chair Jerome Powell’s testimony before the House Financial Services Committee on June 21. He will appear before the Senate banking panel the following day.
“Evidence suggests that the recent banking-sector stress and related concerns about deposit outflows and funding costs contributed to tightening and expected tightening in lending standards and terms at some banks beyond what these banks would have reported absent the banking-sector stress,” the report said.
Between work at home, Bidenflation and The Feral Reserve, commercial real estate and regional banks are suffering … and it could get a lot worse. And Joe Biden (aka, Negan) in general. Living in Negan Country!
The work-from-home trend has been taking its toll on office landlords and is now making its way through to banks’ commercial loan portfolios, leading some analysts to predict that more trauma could be on the way for regional banks this year.
And in the current climate of bank failures, short sellers, and nervous depositors, banks with large exposures to commercial real estate (CRE) loans are racing to clean up and sell down their loan portfolios in hopes that they will not fall victim to another round of bank runs.
“There is an estimated $1.5 trillion of commercial property debt that will be due for repayment in about 18 months,” Peter Earle, an economist at the American Institute for Economic Research, told The Epoch Times. “It’s not improbable that even if interest rates have fallen by that time, some of that real estate debt will nevertheless be impaired and have an adverse impact on regional banks.”
In step with a recent trend in the CRE market, tech giant Google announced in May that it was attempting to sublease 1.4 million square feet of vacant office space in its Silicon Valley home base in order to “match the needs of our hybrid workforce.” Despite more employees returning to their offices this year, average office occupancy rates across the United States are still below 50 percent.
According to a report by Bank of America, 68 percent of CRE loans are held by regional banks. Approximately $450 billion in CRE loans will mature in 2023. JPMorgan Chase estimated that CRE loans comprise, on average 28.7 percent of the assets of small and regional banks, and projected that 21 percent of CRE loans will ultimately default, costing banks about $38 billion in losses.
Double Hit (of Biden’s Policies) Commercial mortgages are getting hit on two fronts: first, by the lack of demand for office space, leading to credit concerns regarding landlords, and second, by interest rate hikes that make it significantly more expensive for borrowers to refinance.
According to a June 12 report by Trepp, a CRE analytics firm, CRE loans that were originated a decade ago, when average mortgage rates were 4.58 percent, are now coming due, and in today’s market, fixed-rate CRE loan rates are averaging around 6.5 percent.
Banks that make CRE loans consider factors like debt service coverage ratios (DSCRs), which measure a property’s income relative to cash payments due on loans. Simulating mortgage interest rates from 5.5 percent to 7.5 percent, Trepp projected that between 28 percent and 44 percent, respectively, of currently outstanding CRE loans would fail to meet the 1.25 DSCR ratio today, and thus be ineligible for refinancing.
These calculations were done assuming current cash flows from properties stay the same and that loans are interest-only, but with vacancies rising, many landlords may have substantially less cash flow available. In addition, whereas interest-only CRE loans were 88 percent of the market in 2021, lenders are now switching to amortizing mortgages to reduce risk, which significantly increases debt service payments.
Refinancing Issues Fitch, a rating agency, projected that approximately one-third of commercial mortgages coming due between April and December of this year will be unable to refinance, given current interest rates and rental income.
“It’s a very different world now from the one in which the majority of these loans were made,” Earle said. “In a zero-interest-rate environment, before the COVID lockdowns saw many businesses shift to a remote work basis, many of these loan portfolios full of office properties looked great. Now, a substantial portion of them look quite vulnerable.”
The Trepp report highlighted several regional markets, such as San Francisco, where office sublease offers jumped 140 percent since 2020, and Los Angeles, where office vacancies hit a historic high of 22 percent. Available office space in Washington D.C. increased to 21.7 percent in the first quarter of 2023.
New York has been hit hard, as well. Office occupancy rates in New York City plummeted from 90 percent to 10 percent in 2020 during the COVID pandemic, but only recovered to 48 percent this year. Revenue from office leases fell by 18.5 percent between December 2019 and December 2022.
Vacancy Rates at 30-Year High Overall, according to a report by analysts at New York University and Columbia Business School, office vacancy rates are at a 30-year high in many American cities.
The report found that “remote work led to large drops in lease revenues, occupancy, lease renewal rates, and market rents in the commercial office sector.”
The authors predict that, even if office occupancy returns to pre-pandemic levels, “we revalue New York City office buildings, taking into account both the cash flow and discount rate implications of these shocks, and find a 44% decline in long run value. For the U.S., we find a $506.3 billion value destruction.”
As predicted, delinquencies in commercial mortgage loans are now creeping up. Missed payments in commercial mortgage-backed securities (CMBS) increased half a percent in May over the prior month to 3.62 percent, Trepp reports. The worst component of the CMBS market, which includes multi-unit rental buildings, medical facilities, malls, warehouses, and hotels, was offices, where delinquencies increased 125 basis points to more than 4 percent.
To put this in perspective, however, CMBS delinquencies exceeded 10 percent in 2012 and 2020. And analysts say that lending criteria for CRE have been more conservative than they were before the mortgage crisis of 2008, leaving more cushion on ratios relative to a decade ago.
All the same, the credit crunch at regional banks has created a vicious circle, where banks race to pare down their CRE portfolios, and the dearth of financing leaves more landlords facing default as outstanding loans mature. To make matters worse, commercial property values, which provide collateral for the loans, appear to be taking a hit as well.
In an effort to rapidly clean up their CRE loan portfolios and avoid the fate of failed banks like Silicon Valley Bank, Signature Bank, and First Republic Bank, banks are now attempting to sell off the loans, often taking a loss in the process.
In May, PacWest, a regional bank, sold $2.6 billion of construction loans at a loss. Citizens Bank reportedly has put $1.8 billion of its CRE loans up for sale during the first quarter of this year. Customers Bancorp reduced its CRE lending by $25 million and put $16 million of its existing portfolio up for sale.
Wells Fargo, one of the top four largest U.S. banks, is also downsizing its CRE portfolio, and in announcing the move CEO Charlie Scharf stated, “we will see losses, no question about it.”
“Between the Fed’s 500+ basis point hikes over the past 16 months and the failure of Silicon Valley Bank, and others, earlier this year, a credit tightening is already underway,” Earle said. “That has put a lot of pressure on regional lenders.”
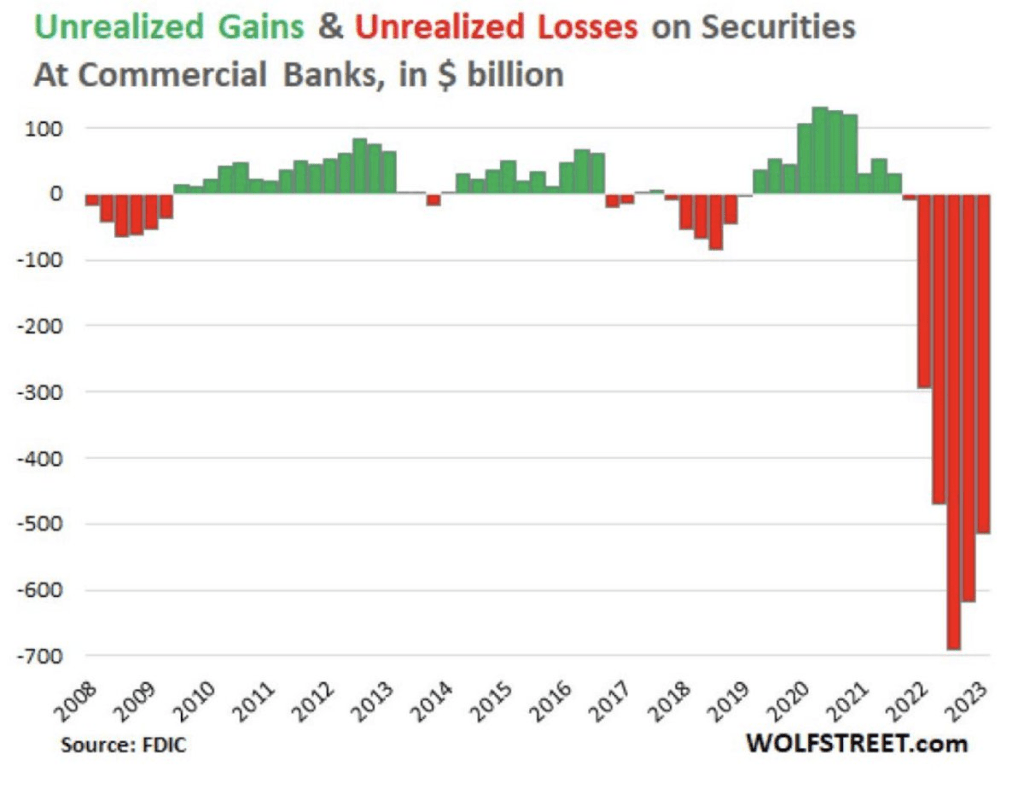
A March academic study titled “Monetary Tightening and U.S. Bank Fragility in 2023” stated that the market value of assets held by U.S. banks is $2.2 trillion lower than what is reported in terms of their book value. This represents an average 10 percent decline in the market value of assets across the U.S. banking industry, and much of this decline came from commercial real estate loans.
Consequently, the authors wrote, “even if only half of uninsured depositors decide to withdraw, almost 190 banks with assets of $300 billion are at a potential risk of impairment, meaning that the mark-to-market value of their remaining assets after these withdrawals will be insufficient to repay all insured deposits.”


You must be logged in to post a comment.