Fed Tightening Pushed Fed Funds Target Rate Above MBS Yields For First Time In History (Biden Administration Ready To Unleash A $27 Billion Green Slush Fund)

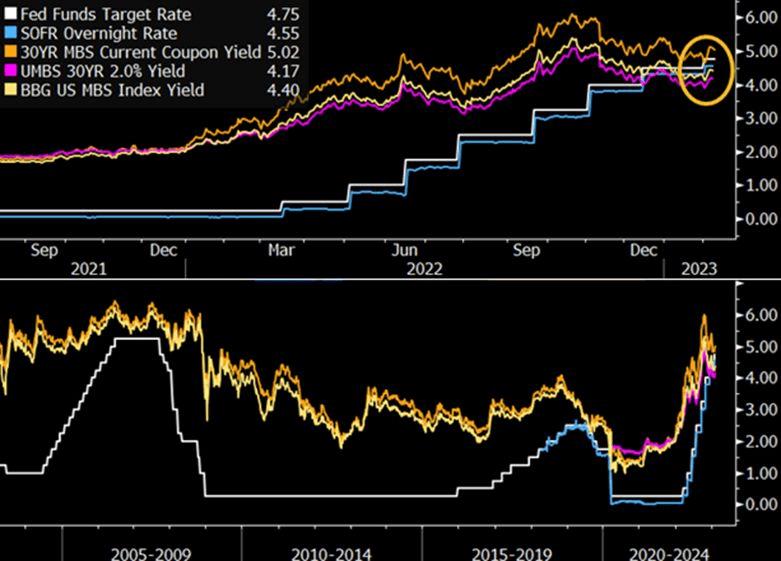
The most recent tightening by the Federal Reserve has pushed the federal funds target rate above mortgage-backed securities yields for the first time in history. Though this poses clear challenges of carry for MBS holders, selective investments in specified pool and collateralized mortgage obligations (CMOs) could provide incremental returns.

While Biden brags (redundant) about lowering inflation (that his energy policies and massive Federal spending caused), apparently he never learns. Now we learn from Mish that the Biden Administration is ready to unleash a $27 billion green slush fund on the US middle class.

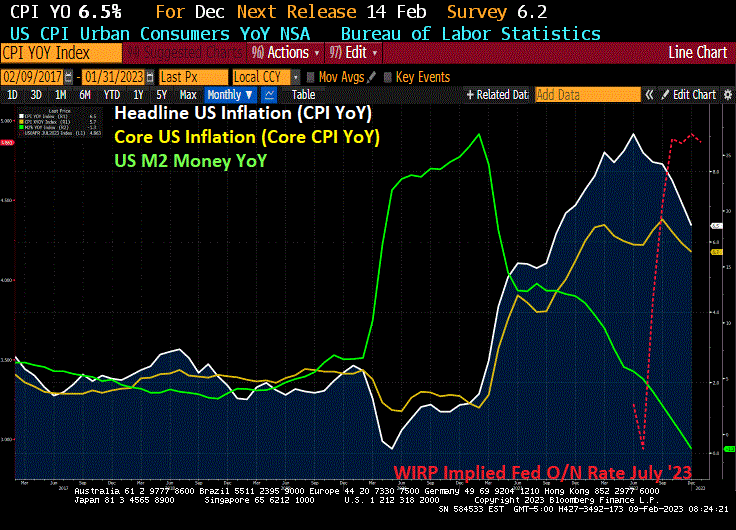
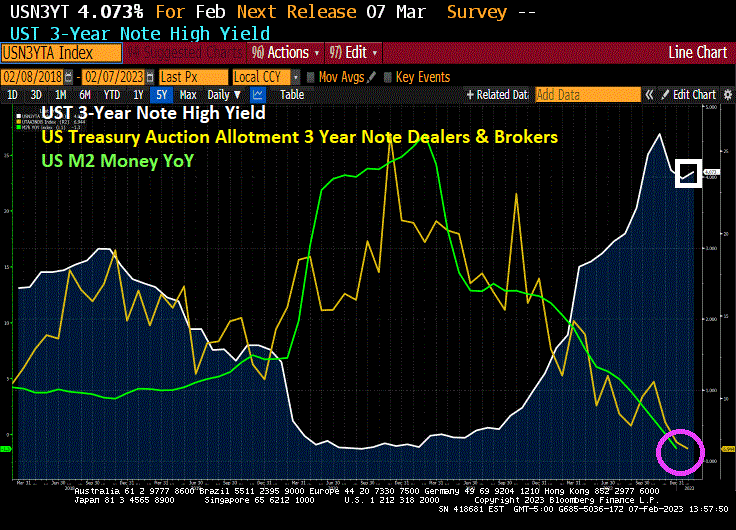
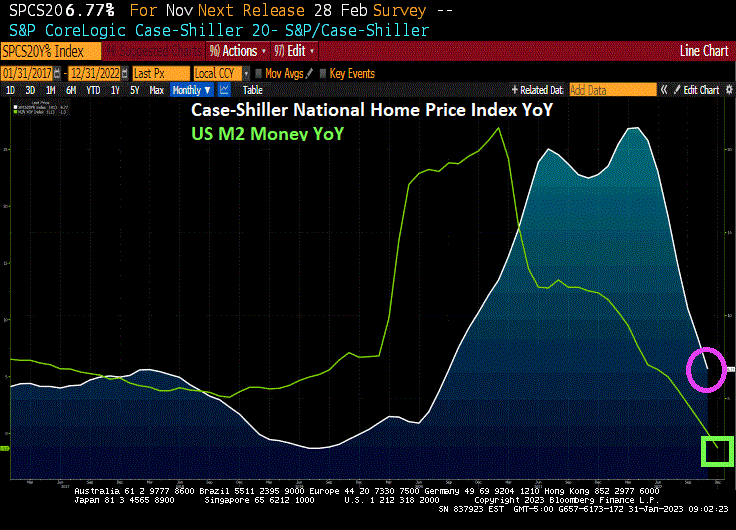
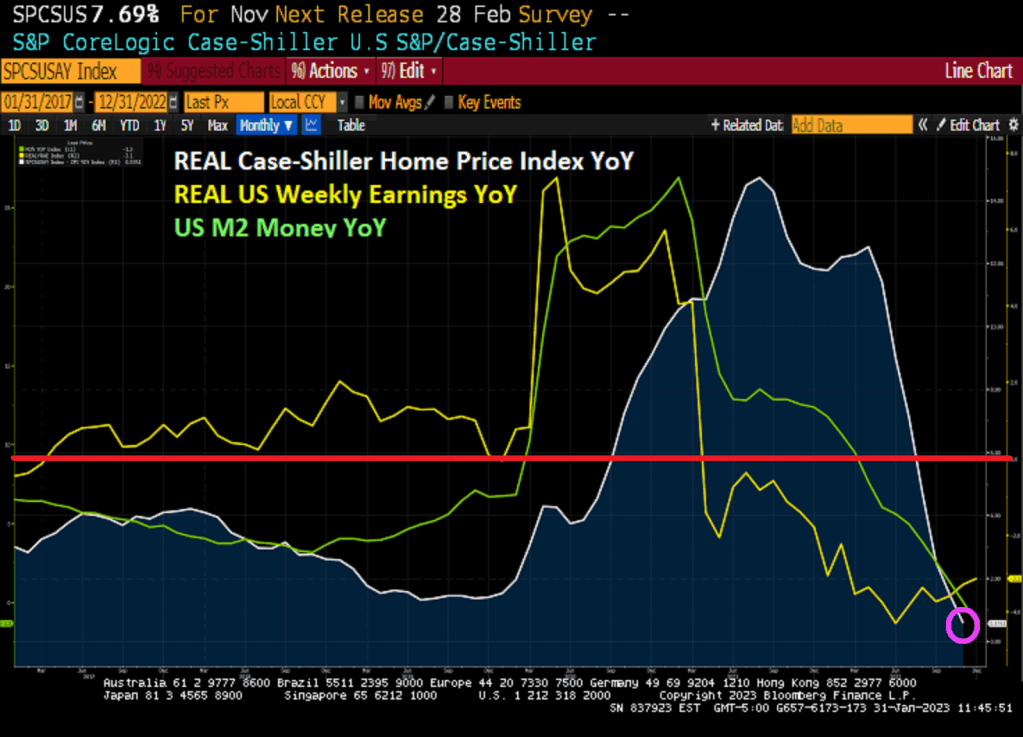
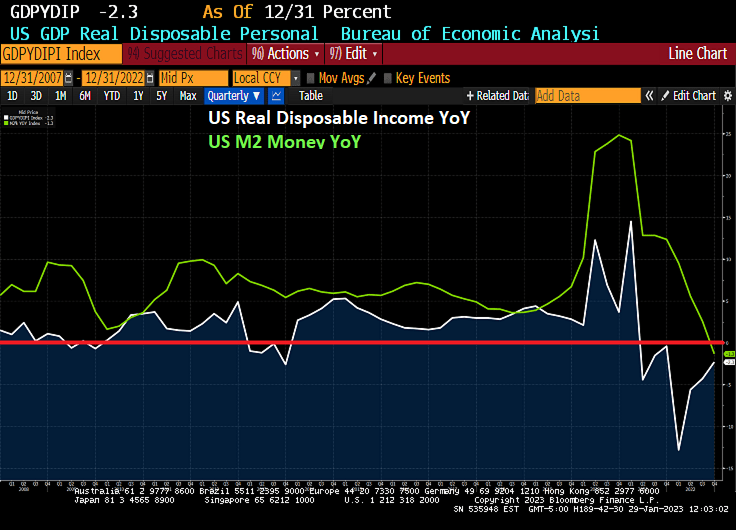
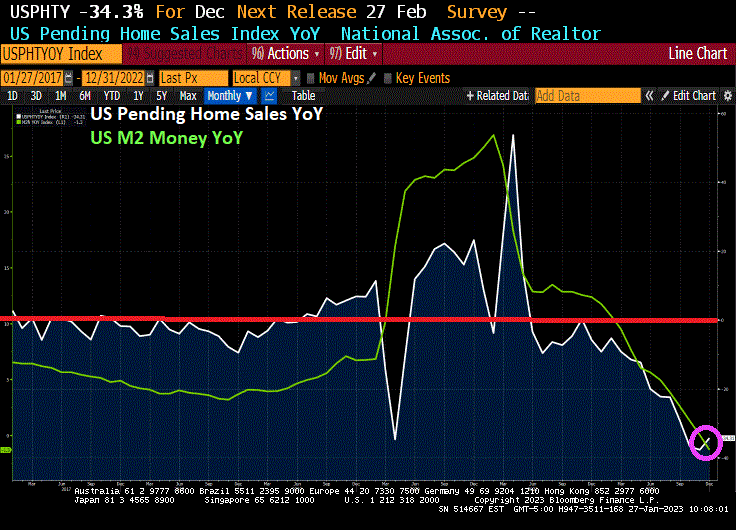
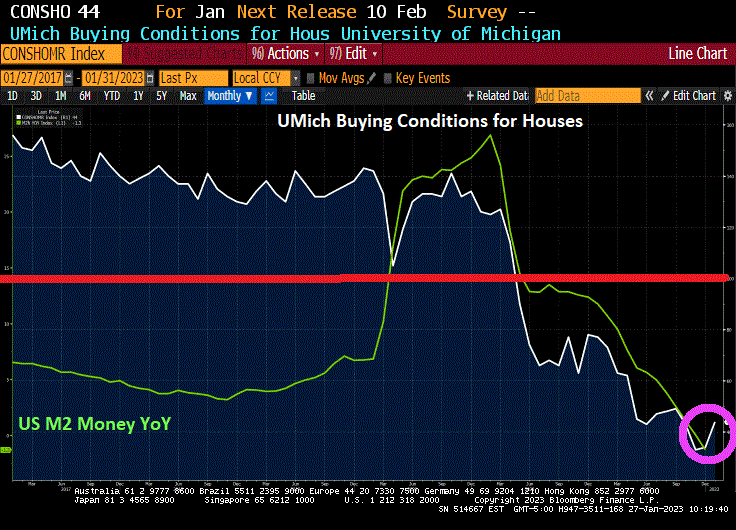
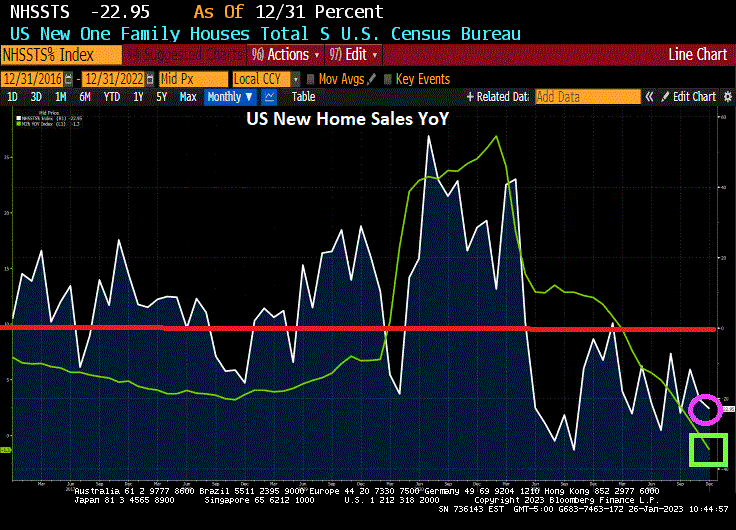
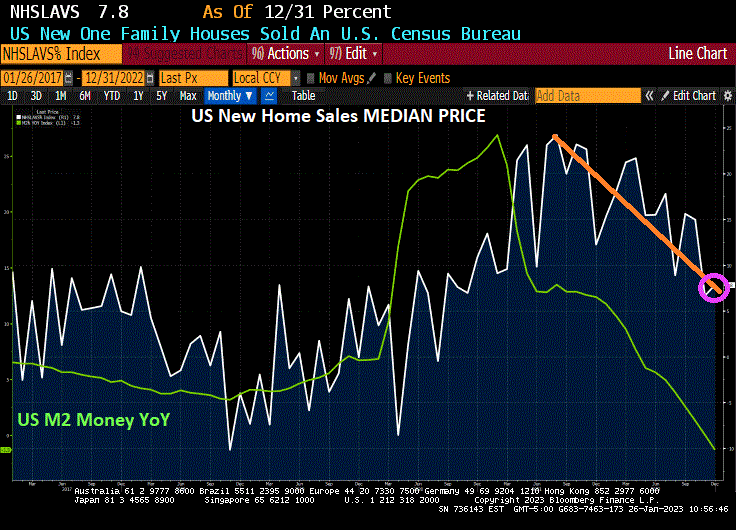
Inflation started under Biden, but the massive expansion in money supply (M2) begin with Covid in 2020.

Once this latest spending splurge kicks in, we will see rising inflation again. After all, Biden and Congress have gotten the taste for massive spending bills (like vampires) and spending likely won’t slow down.

Just Like The Fed! Despite Cooling Inflation, Forecasts Of Fed Rate Hikes Increase To Peaking In July 2023

It’s just like The Fed to ignore what is going on and do something else.

The one statement that Biden made in his State of the Union Address that was factually accurate was that inflation is coming down. Of course, he then blew it by saying he inherited inflation from Trump which was not true. Headline inflation (CPI YoY) was only 1.4% when Biden was sworn-in as President and rose to 9.1% YoY by June 2021 before finally starting to decline.

But despite the cooling of inflation (and M2 Money growth), The Fed seems hell bent on increasing their target rate, now forecast by Fed Funds Futures to peak in July 2023 at 5.123% before pivoting.

The Fed’s themesong. Drinking with my low-companions, dancing with a woman that’s not my wife, laughing at a joke I’ve heard before, welcome to a night in their life.

Fragility! The Federal Reserve Is Slow-Walking Its Shrinking Of Mortgage-backed Securities As M2 Money Growth Goes Negative (Mortgage Purchase Demand Down -37% Since Last Year And Down -45% Since February 5, 2021)

Starting in 2009 with the housing bubble burst and ensuing financial crisis, The Federal Reserve bought agency mortgage-backed securities (MBS) in an effort to provide stability to the then suffering housing and mortgage markets. Flash forward to today and The Federal Reserve still has $2.62 TRILLION in Agency MBS in its System Open Market holdings. And declining very slowly.

All this is happening as M2 Money growth YoY has gone negative and both mortgage rates and home price growth are slowing.

Is the US mortgage market that fragile that requires The Fed to support it?

The answer is yes if we look at the Mortgage Bankers Association weekly applications index. The Refinance Index increased 18 percent from the previous week and was 75 percent lower than the same week one year ago. The unadjusted Purchase Index increased 4 percent compared with the previous week and was 37 percent lower than the same week one year ago.

I noticed that Biden didn’t mention how mortgage purchase applications since he was installed as President have fallen -45%. Mortgage refi applications have dropped -88% since February 5, 2021.

At least the US house payment to income ratio has declined since the peak. But still higher than at the peak of the US housing bubble in 2006.

US Treasury’s Disastrous 3-Year Auction! High Rate Rises To 4.073% As Allotment To Dealers And Brokers Collapses (Stop Through Yield Crashes To Lowest Level In Years)

After Jerome Powell raved about the strong US labor market and oddly ignored the staggering crowding-out of US interest payments on its massive debt, the US Treasury’s 3-year debt auction was … a Hinderburg moment.

First, the high yield at today’s auction of 3-year Treasury notes was 4.073%. This occured as the allotment to brokers and dealers collapsed along with M2 Money growth YoY.

Then we have this horrible chart of the 3Y auction stop through, crashing into uncharted waters. A stop-through indicates when the highest yield the Treasury sold in the auction is below the highest yield expected when the auction began – the “when issued” level.

Here is the rest of the auction story.

The Tighten Up! Banks Tightening Credit Boxes As Median Age Of US Homebuyers Rises From 31 To 47

The Federal Reserve is doing Archie Bell and The Drells “Do The Tighten Up!”

Over the fourth quarter, significant net shares of banks reported having tightened standards on C&I loans to firms of all sizes.

Banks also reported having tightened all queried terms on C&I loans to firms of all sizes.

Actually, banks are tightening standards across the various credit boxes.

And as banks tighten up their credit box, we are seeing the median age of US homebuyers rising from 31 to 47 years.

As banks tighten, we are seeing a slow down in the growth rate for C&I lending and 1-4 unit mortgage lending.

This is reminding me of Germany where you save for your entire life to buy a home.

Somehow, I don’t think Biden will mention any of this is his State of the Union address tonight.

US Mortgage Applications Drop 9% From One Week Earlier, Purchase Apps Up 7% From Previous Week But Down 41% From Same Week Last Year

The January mortgage applications book is closed. And we are off to another year of rising applications until May. Then the downhill slide.

Mortgage applications decreased 9.0 percent from one week earlier, according to data from the Mortgage Bankers Association’s (MBA) Weekly Mortgage Applications Survey for the week ending January 27, 2023.

The Refinance Index decreased 7 percent from the previous week and was 80 percent lower than the same week one year ago. The seasonally adjusted Purchase Index decreased 10 percent from one week earlier. The unadjusted Purchase Index increased 7 percent compared with the previous week and was 41 percent lower than the same week one year ago.

US mortgage rates have been steadily declining since November 2022.

Happenings Two Months Time Ago! US Case-Shiller National Home Price Growth Slows To 6.77% YoY In November As Fed Retreats (Down -0.54% Since October, 5th Straight Month Of MoM Price Declines)

The Case-Shiller index is out for November 2022. Too bad it is January 31, 2023. Call it “Happenings 2 Months Time Ago.”

On a year-over-year (YoY) basis, the Case-Shiller National home price index slowed to 6.77%. On a month-over-month (MoM) basis, the CS National index fell -0.54%. That is the 5th straight month of home price declines.

In REAL terms, the Case-Shiller National home price index is up only 0.58% YoY as REAL Weekly Earnings growth is negative at -3.1% YoY.

Only San Francisco fell on a YoY basis (down -1.6%). Five metro areas were above 10% and they are all in the South. Atlanta, Charlotte. Dallas, Miami and Tampa.

On MoM basis, every metro area in the Case-Shiller 20 index saw price declines from October to November.

Another sign of a crumbling market.

7 Months Of Night! US GDP Real Disposable Income Fell For 7 Straight Months As Fed Removes Punchbowl (Biden’s Economy Lost $4 TRILLION In Real Disposable Income Since March 2021, A -21% Loss)

Welcome to the wonderful world of Bidenomics, giving the US 40 year highs in inflation leading The Federal Reserve to remove its enormous monetary stimulus (known as “The Punch Bowl.”

I previously pointed out that US Real GDP was actually less than 1% year-over-year (YoY) in 2022, hardly a fantastic number given the trillions in Biden/Pelosi/Schumer spending (Omnibus, Infrastructure, etc) and Powell/Fed’s whopping monetary stimulus in 2020. But real disposable income, the amount households have left to spend after adjusting for inflation, had been falling for 7 straight months.

In fact, REAL disposable personal income peaked in March 2021, shortly after Biden was sworn-in as President in Janaury 2021 at $19,213.9 billion (or $19.214 TRILLION). As of December 2022, real personal disposable income had fallen to $15,213.0 or $15.213 TRILLION. That is a loss of $4 TRILLION since March 2021. Or a -21% Loss in Real Disposable Income.

Here is the campaign video for Joe Biden from 2020.

Biden’s campaign photo.

US Pending Home Sales Decline For 13th Straight Month, Down -34.3% YoY As Fed Tightens (UMich Housing Sentiment At 44, Well Below 100)

The US housing market continues to struggle as The Federal Reserve continues to fight inflation. Today’s pending home sales are another nail in housing casket.

Pending home sales declined -34.4% year-over-year (YoY) as M2 Money growth went negative (-1.3% YoY).

At least UMich buying conditions for housing increased … to 44, well below 100.

Good News, Bad News! US New Home Sales Rise 2.3% In December, But DOWN -23% YoY (Median Price UP 7.8% YoY While M2 Money Growth Goes Negative)

The December new home sales report is good news and bad news.

The good news? US new home sales rose by 2.3% in December from November to 616k units sold SAAR. That is the good news.

The bad news? Since December of 2021, new home sales fell -23% year-over-year (YoY).

The median price of new home sales rose 7.8% YoY, but the trend as The Fed withdraws monetary stimulus (orange line) is not good.

Perhaps there is a communications breakdown between the Biden Administration and The Federal Reserve.