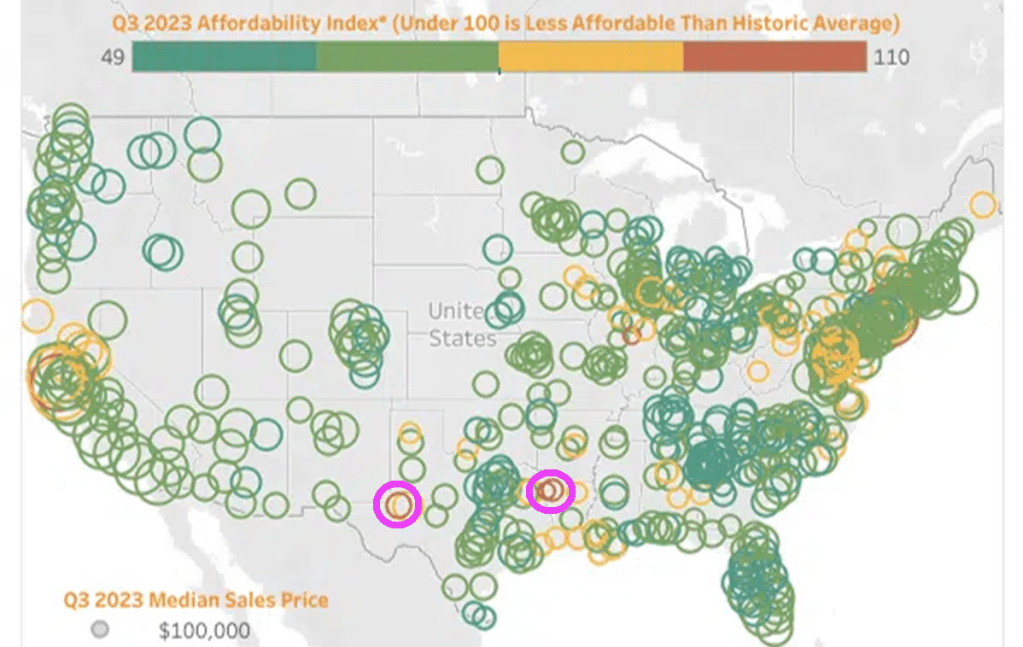
Although the Attom data is from Q3 2023, not much has changed. Under Biden (and his HUD Secretary Marcia Fudge, Fed Chair Jay Powell, and Treasury Secretary Janet Yellen), I did manage to find TWO AFFORDABLE areas to live: Shreveport Louisiana and Midland/Odessa Texas. The housing market remains unaffordable for millions of Americans.
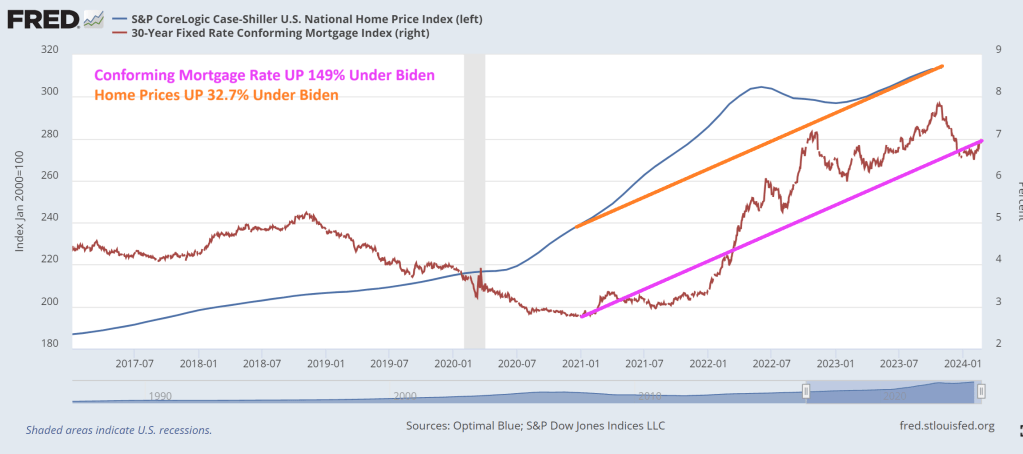
I am not surprised given that the Case-Shiller National home price index has risen by 32.7% under Biden while mortgage rates are up … 149%.
Robin Hood is a legendary heroic outlaw originally depicted in English folklore and subsequently featured in literature, theatre, and cinema. Traditionally depicted dressed in Lincoln green, he is said to have stolen from the rich to give to the poor. Politicians have created the new “Forgotten Man” by Amity Shlaes.
However, politicians like Joe Biden, Chuck Schumer, Mitch McConnell are “reverse Robin Hoods” dressed in business suits (although Jamie Raskin D-MD is often seen wearing a bandana and John Fetterman D-PA is often seen in a hoodie and shorts). They instead enact policies that steal from the middle class and give to themselves and the donor class. How do you think that politicians like the Bidens, Obama, Clintons and AOC go in broke and emerge as multi-millionaires?
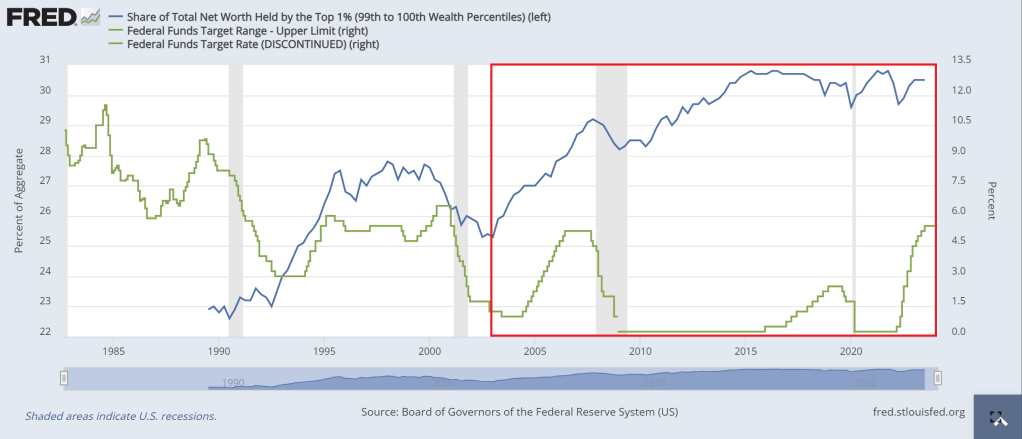
Part of the problem with the reverse Robin Hood model is the Federal Reserve itself. They helped punish the 99% with inflation due to excessive money printing. The share of total net worth held by the top 1% has exploded since The Fed’s rate cuts following the 2001 recession. The Fed has never lowered rates since to levels we saw prior to the 2001 recession, although The Fed is getting close.
Then we have the green energy hysteria (which like pornography excites the brain and distorts logical thinking). Wealthy donors have received a massive windfall (along with China) from Biden/Congress’s green energy spending (scam). The middle class and low-wage workers are now playing higher utility bills (sacrificial lambs on the altar of global warming … or cooling) along with seeing gasoline and diesel prices far higher than before Biden was elected. Gasoline prices are up 46.25% under Biden and diesel prices are up 55.6%.
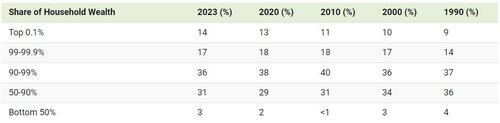
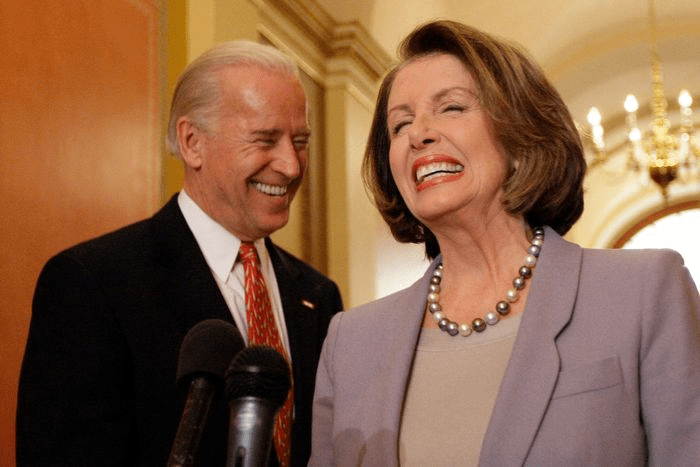
I like this chart of the distribution of household wealth by income group. The top 1% (the elite Pelosi class, are getting wealthier and wealthier. The 90-99% group are doing well, but not as well as the top 1%. The bottom 50% (who the Washington DC elite class seems to have forgotten about)
Here is a table of the same data.
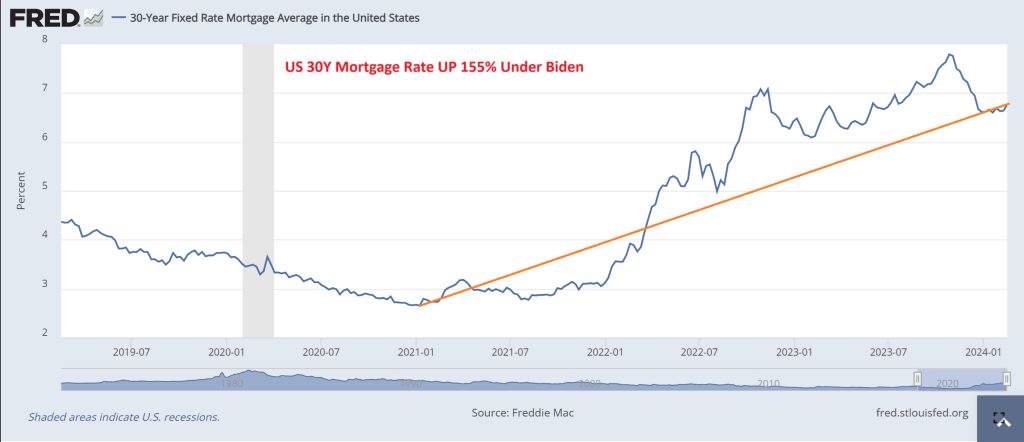
Then we have the exploding mortgage rates under Biden. Rates are up over 155% under Old Grandad Joe Biden. Another shot through the heart of the middle class. And Washington DC is to blame.
Speaking of Washington DC millionaire elites, I want to share this picture with you. Hillary Clinton is NOT Robin Hood but an example of a REVERSE Robin Hood.
Director John Carpenter had two films, “Escape From New York” and the less popular “Escape From LA.” Carpenter’s vision of a dystopian future with Manhattan as a prison island, filled with criminals and Los Angeles as a just a weird, dystopian area filled with gangs and sleazebags. Apparently, Carpenter read George Orwell with a splash of Franz Kafka in writing these films which are sadly becoming a reality. With Biden’s immigration “policy” (let everyone in without checking who they are) is a blueprint for a new film “Escape From The USA!” I wonder if Kurt Russell is available to reprise his role as Snake Plisken?
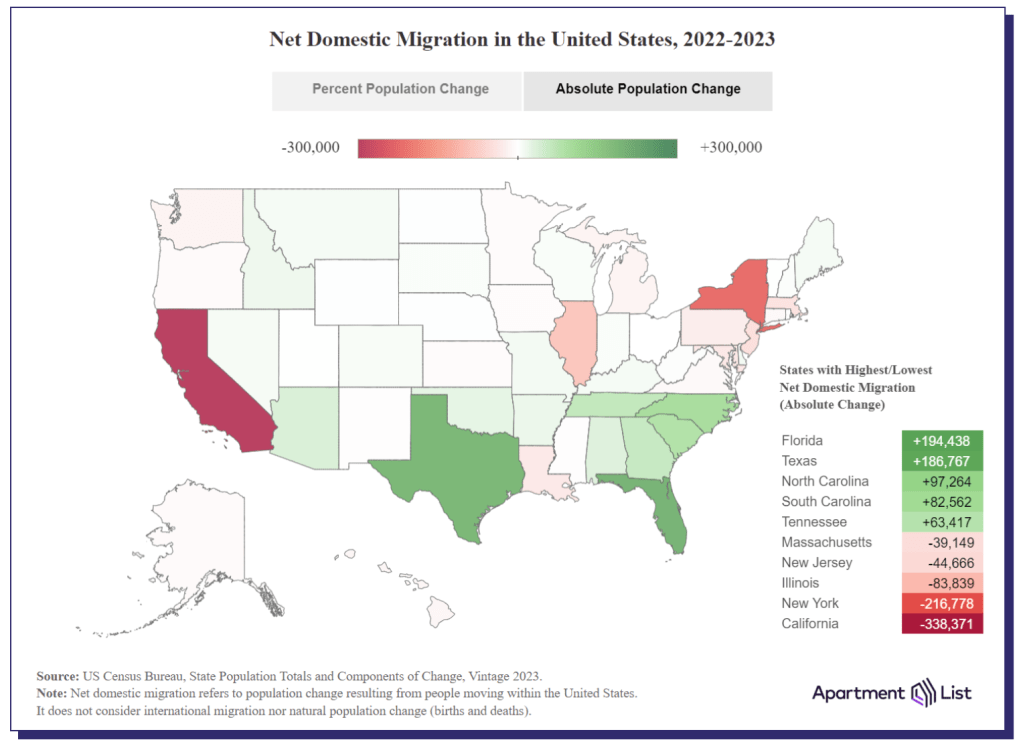
Like John Carpenter foretold, both California and New York are leading the nation in outmigration. BAD crime, high taxes, insane politicians and droves of illegal immigrants are making living in those state very difficult. Throw in the NY AG Letisha James and Judge Engmoron’s Marxist show trials of Donald Trump for doing absolutely nothing wrong and many people are are plain fed up. Illinois under the “leadership” of Chicago Fats (Governor J.B. Pritzker) and horrendous Chicago mayor Brandon Johnson (who makes former Chicago Mayor Lori Lightfoot almost look reasonable) is third in the nation for outmigration. Once again, high taxes, high crime, lots of illegal immigrants, and inane policies are causing people and businesses to flee. John Carpenter should do a film “Escape From Chicago.”
Where are people fleeing to? Florida leads followed by Texas, then the Carolinas, and Tennessee. Generally, these states have lower taxes, lower crime, and less intrusive politicians. E.g., no Gavin Newsom (CA), no Kathy Hochul (NY) and no J.B. Pritzker (IL).
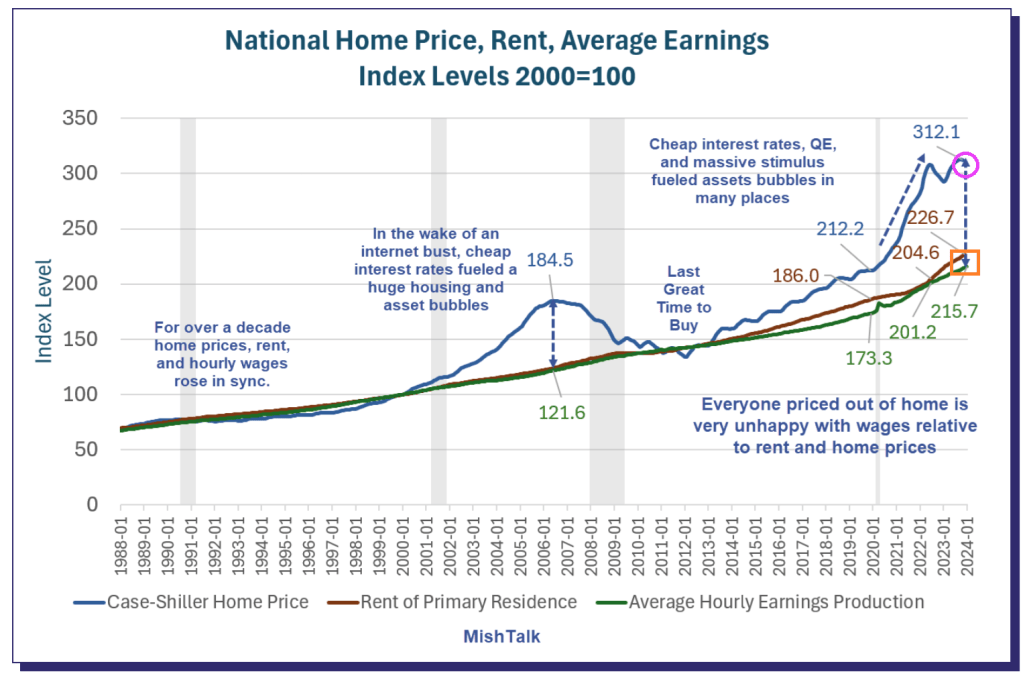
Another reason that people are fleeing New York and California is cost of living. To be sure, Bidenomics (an insidious malinvestment plan, aka, donor-nomics) has made matters worse. Home prices (blue line) and rents (red line) has soared and are far higher than the grow in average earnings (green line). Los Angeles is wonderful if you are a celebrity like Steve Spielberg, Tom Hanks and The Office’s Jenna Fischer where you live in a mansion and are protected by the police force. But other parts of Los Angeles are filled with the homeless, illegal immigrants, rampant crime, and is simply unlivable.
Escape From New York is appropriate for today’s situation. An idiot Mayor and Governor, illegals crowding the streets and hotels, crime through the roof, illegals attacking police. And Joe Biden acting like The Duke of New York, A number One! I guess the closest person we have to Snake Plisken is Donald Trump.
On a related note, Georgia is still seeing positive net in-migration. But as the Fani Willis corruption scandals unfolds and their weak-kneed Governor Kemp does nothing, we have yet another film John Carpenter could make “Escape From Atlanta.” Or a computer game like “Call of Booty.”
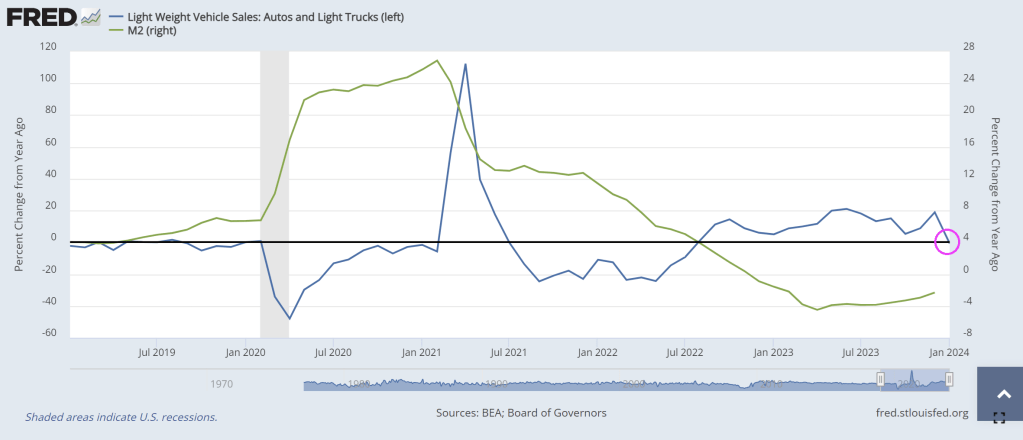
Cars and light trucks are seeing declining YoY sales in January (-0.7%) as M2 Money growth remains negative.
Automotive News was the first to report Ford Motor Co. halted shipments of all 2024 F-150 Lightning electric pickup trucks for an undisclosed quality control issue just weeks after slashing production volumes for the EV model due to sliding demand.
“We expect to ramp up shipments in the coming weeks as we complete thorough launch quality checks to ensure these new F-150s meet our high standards and delight customers,” company spokeswoman Emma Bergg wrote in a statement.
Last month, Ford announced plans to slash the Lightning production in April “to achieve the optimal balance of production, sales growth and profitability.”
The automaker (and many others, like Mercedes Benz) is recalibrating its electric vehicle strategy as the Biden administration plans to downshift the EV transition as demand plummets.
Thousands of auto dealers nationwide recently warned the ‘climate change warriors’ in the White House: the 2030 EV push is backfiring.
“Currently, there are many excellent battery electric vehicles available for consumers to purchase. These vehicles are ideal for many people, and we believe their appeal will grow over time. The reality, however, is that electric vehicle demand today is not keeping up with the large influx of BEVs arriving at our dealerships prompted by the current regulations. BEVs are stacking up on our lots,” the dealers said.
They warned: “Already, electric vehicles are stacking up on our lots which is our best indicator of customer demand in the marketplace.”
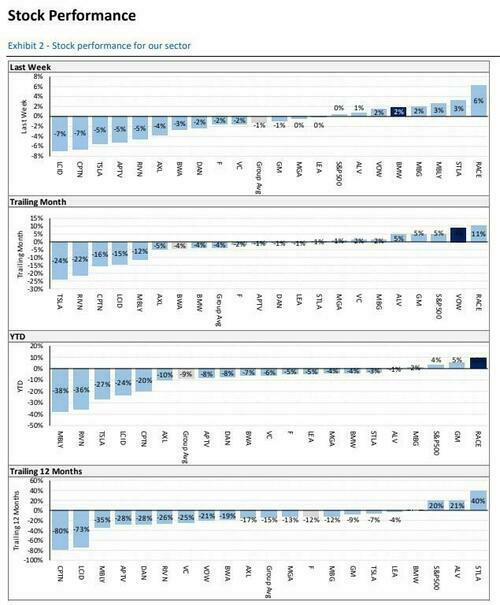
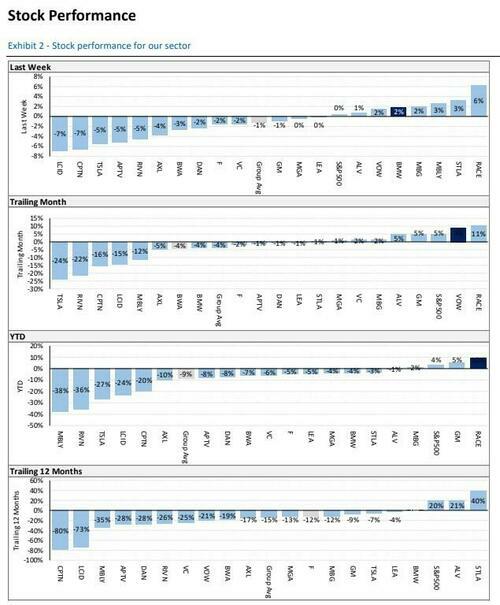
“Key takeaways thus far from earnings season are that the EV slowdown is not showing any evidence of an inflection, Level 4 autonomy headwinds continue to persist, and fears over supplier inventory overbuild are likely overblown.
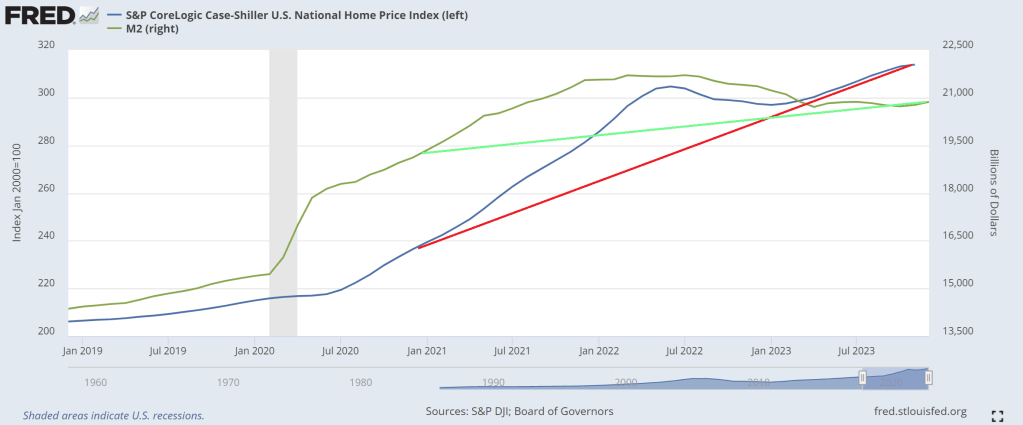
The Hollies said it best: Stop, stop, stop. FIAT Money Printing that is.
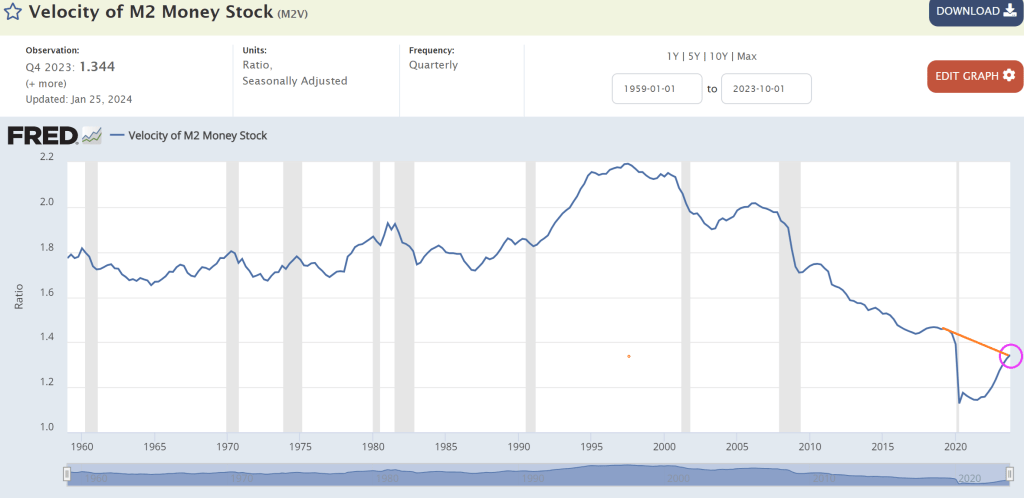
Typically, we look at M2 Money Velocity (GDP/M2) as a measure of how much the economy grows by expanding the money supply.
M2 Money Velocity is currently at 1.344, and still below where we were under Trump prior to Covid. After Powell printing palooza after Covid, M2 Money Velocity collapsed and is slowly rising, but remains low by historic standards.
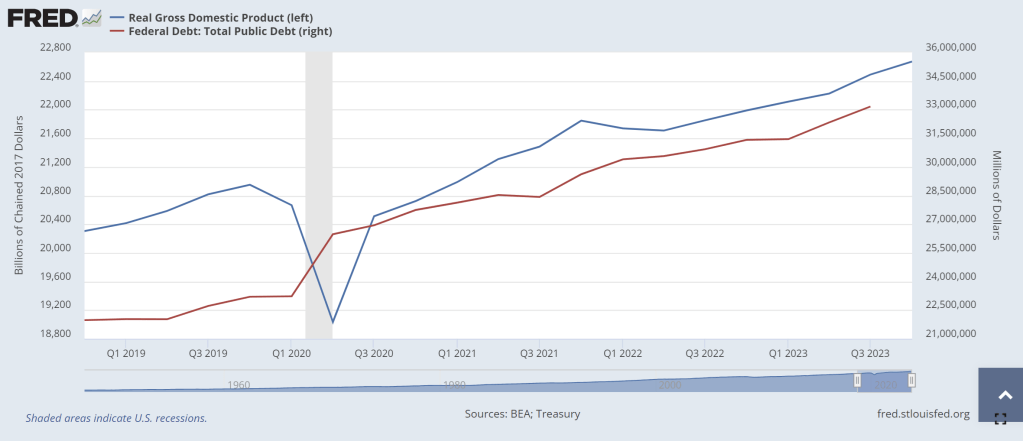
Perhaps a more interest velocity is DEBT velocity (GDP/DEBT). Under Biden’s Reign of Error, Federal debt has increased by $6,539,359 million while real GDP has increased by only $1,948.731 billion (or roughly $2 trillion in GDP growth after $6.54 trillion in debt). Or a DEBT velocity of 0.3. Yikes! No wonder China is bailing on US debt!
This chart makes debt issuance look better than it really is. Again, the DEBT VELOCITY of 0.3 is terrible meaning that for every $1 of Federal debt, we get 30 cents in Real GDP under Biden. One of my macroeconomics textbooks stated that debt growth is fine as long as real GDP growth rises faster than debt growth. Apparently, Treasury Secretary Janet Yellen didn’t read that textbook! Real GDP has grown by 9.43% under Biden while Federal debt has grown by … gulp .. 24%.
Yes, the US is borrowing like the proverbial drunken sailor while they “invest” in green energy, wars in Ukraine and the Middle East, and massive social welfare programs (like the old breads and circuses from the dying Roman Empire). When watching the media’s obsession with Taylor Swift and Chief’s Tight End Travis Kelce at The Super Bowl, it reminded me of “Breads and Circuses” as our nation is collapsing like a dying star. (That is why I Iike Gold, Silver and Bitcoin!)
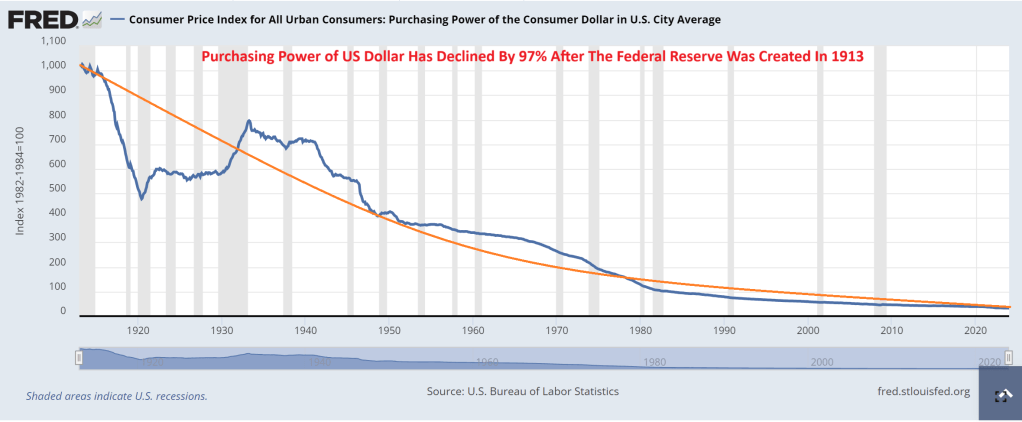
What about The Federal Reserve? It was created in 1913 after signed into existence by President Woodrow Wilson. Since The Fed’s inception, consumer purchasing power has declined by 97%.
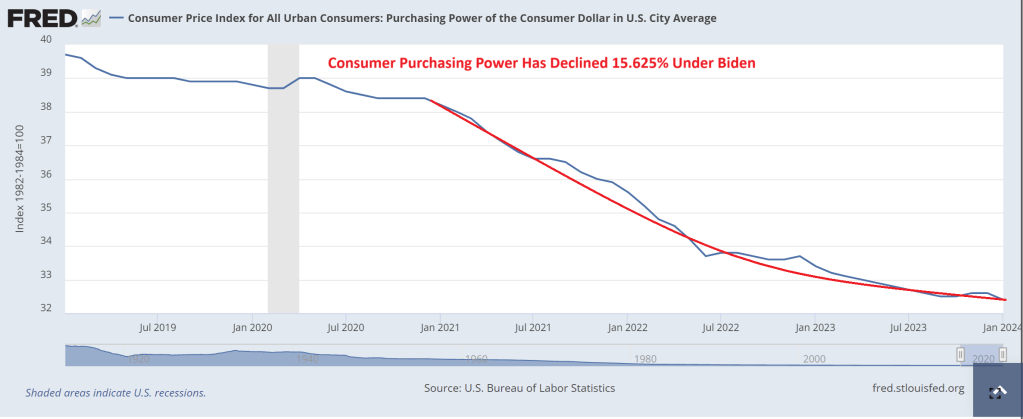
And under Biden, inflation has been so bad that consumer purchasing power is down 16%.
In summary, The Federal Reserve has been printing like crazy (I would say Batshit Crazy, but I actually think bats are adorable). And Treasury (under former Fed Chair Janet Yellen) has been borrowing like crazy too. While politicians claim the economy is in great shape, it is really because The Fed is printing wildly, Yellen is borrowing wildly, and much of US GDP is not due to the private sector, but Federal government spending … to the donor class. This is NOT a sustainable and will eventually crash into a ravine.
So, despite recent declines in energy prices, gasoline prices are still up 46.25% under “Green Joe” and the all important for shipping, diesel prices, are still up 55.6% under Brainless Joe.
One would think that massive rises in gasoline and diesel prices would make everyone buy an electric vehicle (EV). But alas, the high cost and unreliability of EVs is turning off consumers. (I own a hybrid and wish I didn’t).
This time it deals with supply chain logistics, with Bloomberg reporting this week that in the year and a half since passing the Inflation Reduction Act, automakers are finding out the hard way that the rigorous criteria for manufacturing batteries using materials from the United States and its free-trade allies could render them cost-inefficient compared to global competitors.
Companies like Tesla are instead taking advantage of a temporary shift in the rules to stock up with cheaper batteries from countries like China.
The Biden administration’s new rules will all but cut out China from the supply chain, however, which will make it tougher to find affordable metal suppliers.
This, in turn, will threaten President Biden’s goal to boost the domestic electric vehicle market. Bloomberg writes that mining companies and labor unions insist that without curtailing the influx of cheaper, Chinese-subsidized materials, the U.S. can’t develop a competitive EV market.
Meanwhile, the higher costs are driving automakers away from EVs. And as battery material requirements are set to double by 2027, fulfilling these mandates will be increasingly difficult, putting Biden’s ambitious EV strategy at risk.
The demand side of the equation also looks less than favorable. We wrote just hours ago about how Ford was slashing prices on its Mach E and Lightning 150. Tesla has been slashing prices to stoke demand for nearly a year now.
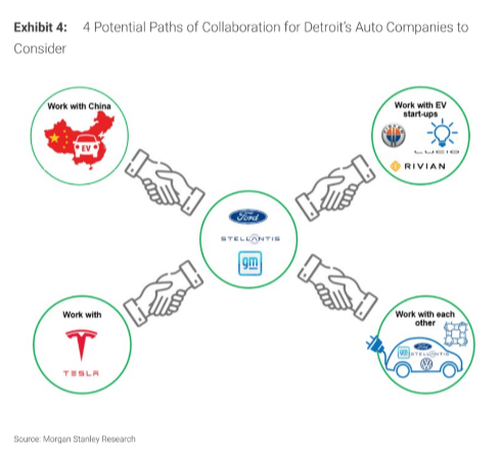
Both Ford and GM have said they’re going to curtail their investment in EVs. General Motors, who posted better than expected earnings earlier this month, said that it plans on changing its product lineup to include more hybrid vehicles, drifting away from pure electric vehicles.
CEO Mary Barra said on the earnings call: “Let me be clear, GM remains committed to eliminating tailpipe emissions from our light-duty vehicles by 2035, but, in the interim, deploying plug-in technology in strategic segments will deliver some of the environment or environmental benefits of EVs as the nation continues to build this charging infrastructure.”
Recall, a report from Consumer Reports last year found that electric vehicles have almost 80% more problems and are “generally less reliable” than conventional internal combustion engine cars.
But hey, what good is a “free” market if the government doesn’t have complete and total control of consumer choice, right Joe? After all, Biden drives a gas guzzling Chevy Corvette. When Biden sells his Corvette and buys a Chevy Bolt, I might believe him. Nah!
So, the free market is standing up to Biden’s hard left tyranny.
My new nickname for Biden is Dopey. And Kamala Harris is Happy (because she laughs constantly). Mayorkas is Bashful (he doesn’t do anything). NY Senator Chuck Schumer is Grumpy. Jill Biden is Doc (for her pathetic PhD in Education). The intellectual seven dwarves are running our country into the ground.
I remember the joke made by Jay Leno about Obama. Go to a McDonalds and order whatever you want and give the bill to the person behind you. Unfortunately, that is the Democrat playbook under Obama/Biden (hereafter termed “O’Biden”). For example, Biden is bragging about forgiving student loan debt relief in the amount of $1.2 Billion in student debt for roughly 153,000 borrowers. And bragging that he is ignoring the US Supreme Court like a banana republic dictator. Like the Jay Leno “joke,” SOMEONE has to pay for this election year vote pandering. But that is the beauty/tragedy of BIG government. It is so big and the numbers so monstrous that many kind of shrug and go “eh.” But someone pays and its the middle class in the form of taxes and inflation.
Who is going to pay for the 10 million illegal immigrants that have crossed the southern border under Biden? While Paul Krugman points to a higher GDP from immigration (illegals still buy goods and services), but mostly are a deadweight drag on social services such as welfare, Medicare, schools, healthcare system, etc.). And of course migrant crime is going off the charts. Who pays for Biden’s border fiasco? The middle class and low wage workers, of course. Elites benefit from uncontrolled immigration, generally live in compounds with private security that the rest of us can’t afford. Remember President Carter and the Cuban Mariel boat lift where Fidel Castro emptied his prisons and sent them to Florida creating absolute mayhem and a huge spike in crime? Biden and Cuba Pete Mayorkas turning up the heat on immigration and its accompanied crime wave.
O’Biden loves to spend other people’s money. Aka, OUR money. Case in point. According to the CBO, net interest on the exploding Federal debt under O’Biden now exceeds our defense spending and that gap is expected to explode. To be sure, the US is funding billions in the middle east, handing over billions to Zelensky and Ukrainian oligarchs, and we have China. What a mess!
So, when will “Billions Biden” stop spending other people’s money? Well, only a barely-held Republican House can stop Biden. Meanwhile I will focus on soaring food prices and eat cheap cabbage rolls and drink coffee. Until Biden kills off those pleasures.
But don’t worry! We might get Gavin Newsom, the ultimate used car salesman, to replace Biden against Trump. But Biden’s ego is so massive (why I have no idea) that he won’t go down without a fight. And what about Cacklin’ Kamala?
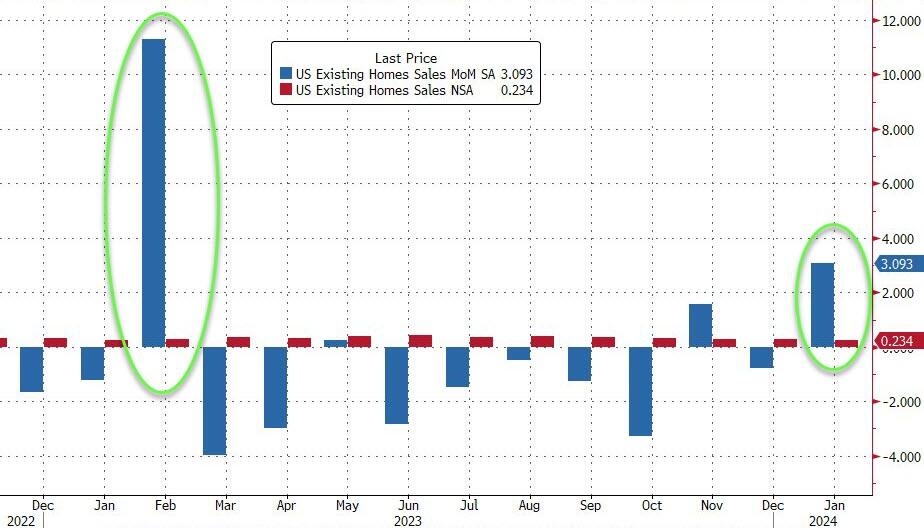
US existing home sales disappointed in January jumping 3.1% MoM (vs +4.9% MoM exp). Quite a different picture from the non-seasonally-adjusted rise of just 0.3%…
Source: Bloomberg
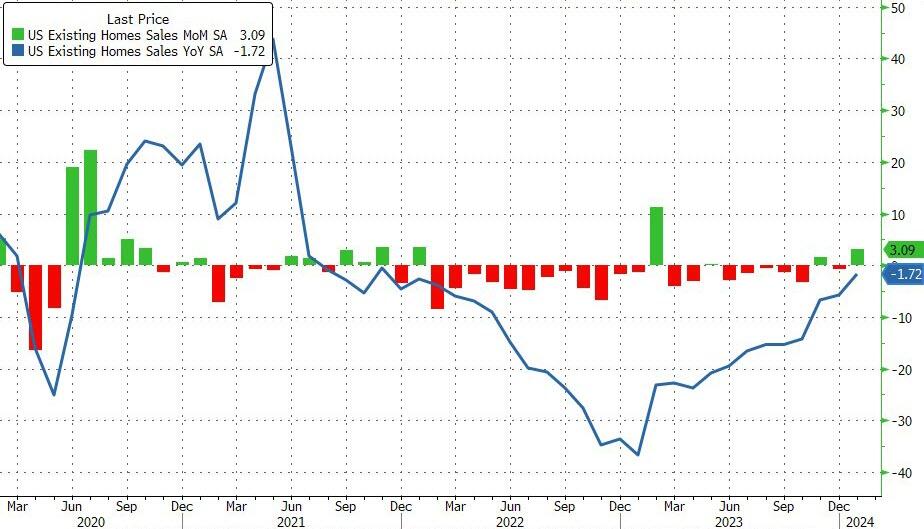
This January rise dragged the YoY decline up to just -1.7%…
Source: Bloomberg
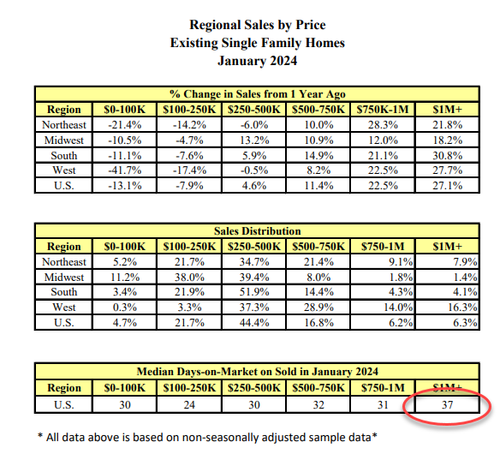
“While home sales remain sizably lower than a couple of years ago, January’s monthly gain is the start of more supply and demand,” said NAR Chief Economist Lawrence Yun.
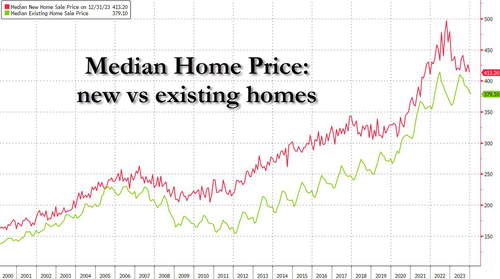
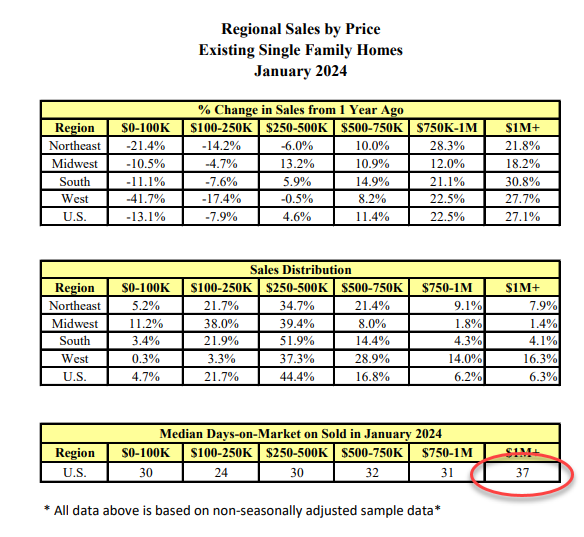
The median home price reached an all-time high for the month of January…
“Multiple offers are common on mid-priced homes, and many homes were still sold within a month. The elevated share of cash deals – 32% – indicated a market full of multiple offers and propelled by record-high housing wealth,” said NAR Chief Economist Lawrence Yun.
Additionally, properties typically remained on the market for 37 days in January, up from 29 days in December and 33 days in January 2023.
So who’s buying homes?
Well, you know the answer to that – even more institutional buyers as first-time homebuyers priced out
First-time buyers were responsible for 28% of sales in January, down from 29% in December and 31% in January 2023.
All-cash sales accounted for 32% of transactions in January, up from 29% in both December and one year ago.
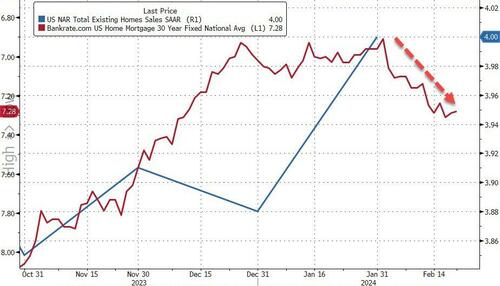
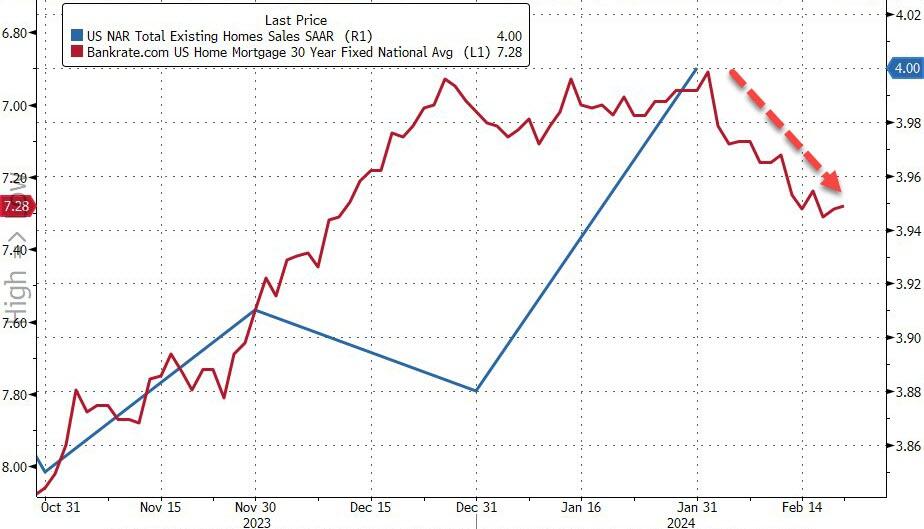
As a reminder, mortgage rates started off the year below 7% and have risen since…
Source: Bloomberg
So don’t expect this renaissance to continue.
And with mortgage rates hitting 7% … again. And rates are up over 155% under Biden.
Silence is not golden. Particularly when it comes to a silent DEPRESSION. Talking is cheap, people follow like sheep. Particularly when are told by Biden, Press Secretary Karine Jean-Pierre and NY Times economic spinster Paul Krugman say its the best economy in decades. It isn’t. In fact, the US is in a silent depression.
Typically, a recession is defined as two consecutive quarters of negative GDP growth. If we use 2 consecutive quarter of negative GDP growth, we are not in a recession. But ….
Why these results? Bidenomics is based on costly Keynesian boom-and-bust policies. With so much whiplash, it’s no wonder people are conflicted about the economy.
In the latest jobs report for January, a net increase of 353,000 nonfarm jobs from the establishment survey appears robust, as it was well above the consensus estimate of 185,000 new jobs. But let’s dig deeper.
Last month, household employment declined by 31,000, contradicting the headlines. The divergence of jobs added between the household survey and the establishment survey has widened since March 2022. This period coincides with declining real gross domestic product in the first and second quarters of 2022 (usually that’s deemed a recession, but it hasn’t been yet). Indexing these two employment levels to 100 in January 2021, they were essentially the same until March 2022, but nonfarm employment was 2.5 percent higher in January 2024.
While this divergence mystifies some, a primary reason is how the surveys are conducted.
The establishment survey reports the answers from businesses and the household survey from individual citizens. The establishment survey often counts the same person working in multiple jobs, while the household survey counts each person employed. This likely explains much of the divergence, as many people work multiple jobs to make ends meet. The surge in part-time employment and more discouraged workers underscores
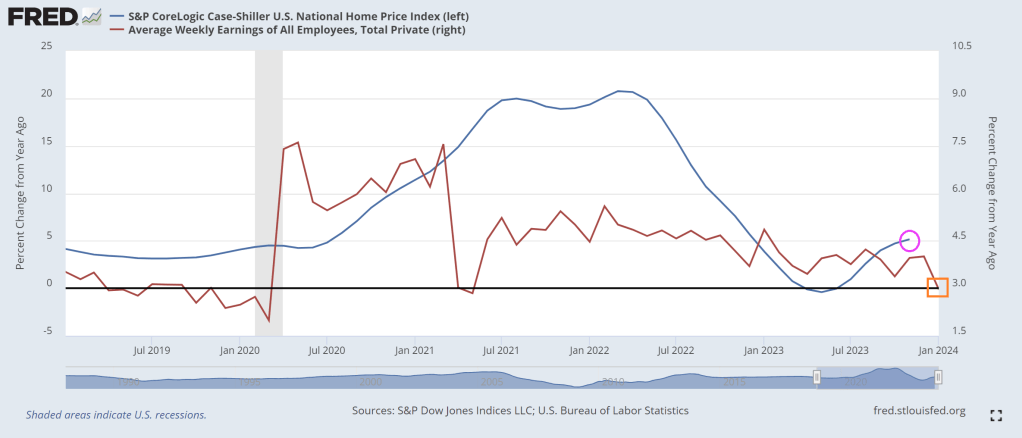
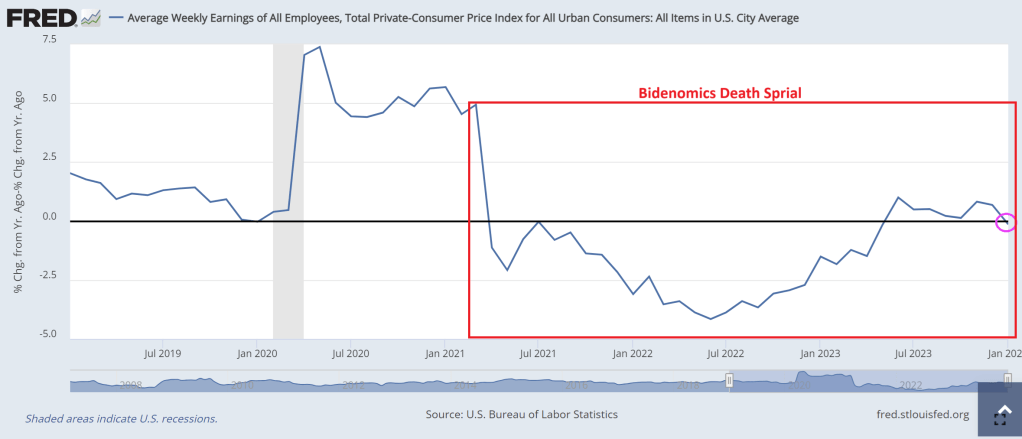
Though average weekly earnings increased by 3 percent in January over a year prior, this is below inflation of 3.1 percent. Real average weekly earnings had increased for seven months before falling last month. And there had been declines in year-over-year average weekly earnings for 24 of the prior 25 months before June 2023. These real wages are down 4.4 percent since Biden took office in January 2021.
As purchasing power declines, mounting debts become more urgent.
Total US household debt has reached unprecedented levels, with credit card debt soaring by 14.5 percent over the last year to a staggering $1.13 trillion in the fourth quarter of 2023. Such substantial growth in debt raises concerns about the current (unsustainable?) consumption trends, business investment, and a looming financial crisis.
The surge in mortgage rates to over seven percent for the first time since December and rising home prices exacerbate housing affordability challenges, particularly for aspiring homeowners. An integral component of what some consider the “American Dream,” housing affordability is a major factor discouraging Americans. Remember, Bidenomics has seen a 155% increase in mortgage rates.
The euphoria surrounding the January 2024 jobs report is misplaced. Policymakers should heed these warning signs and enact meaningful reforms to address root causes.
Biden’s policy approach undergirds most of these difficulties. Bidenomics focuses on his Build Back Better agenda that picks winners and losers by redistributing taxpayer money for supposed economic gains through large deficit spending (and most of the gains went to political donors).
We haven’t seen an agenda of this magnitude since LBJ’s Great Society in the 1960s or possibly since FDR’s New Deal in the 1930s. Both were damaging, as the Great Society dramatically expanded the size and scope of government, contributing to the Great Inflation in the 1970s, and the New Deal contributed to a longer and harsher Great Depression.
These four bills will add nearly $4.3 trillion to the national debt. But at least another $2.5 trillion will be added to the national debt for student loan forgiveness schemes, SNAP expansions, net interest increases, Ukraine funding, PACT Act, and more. In total over the past three years, excessive spending will lead to more than $7 trillion added to the national debt, which now totals $34 trillion — a 21 percent increase since 2021. There seems to be no end to soaring debt with the recent discussions of more taxpayer money to Ukraine, Israel, the border, and the “bipartisan tax deal,” collectively adding at least another $700 billion to the debt over a decade.
Record debts accrued by households and by the federal government (paid by households) are not signs of a robust economy. This will likely worsen before it improves, as household savings dry up. And with interest rates likely to stay higher for longer because of persistent inflation, debts will crowd out household finances and the federal budget.
The Federal Reserve has monetized much of this increased national debt over the last few years by ballooning its balance sheet from $4 trillion to $9 trillion and back down to a still-bloated $7.6 trillion. This helps explain persistent inflation, massive misallocation of resources, and costly malinvestments across the economy, keeping the economy afloat yet fragile.
Excessive deficit spending weighs heavily on future generations, saddling them with unsustainable debt levels they have no voice in. Today, everyone owes about $100,000, and taxpayers owe $165,000, toward the national debt. Of course, these amounts don’t include the hundreds of trillions of dollars in unfunded liabilities for the quickly-going-bankruptwelfare programs of Social Security and Medicare.
Future generations will be on the hook for even more national debt if Bidenomics continues and Congress doesn’t reduce government spending now. This is why the national debt is the biggest national crisis for America. We’re robbing current and future generations of their hopes and dreams.
Fortunately, there’s a better path forward if politicians have the willpower. This path should be chosen before we reap the major costs of a bigger crisis. Look at Argentina’s president Javier Milei who managed to balance the budget in 60 days and generate a whopping SURPLUS of $589,000,000. How? By cutting massive government waste and closing agencies and programs.
In short, we need a fiscal rule of a spending limit covering the entire budget based on a maximum rate of population growth plus inflation. There should also be a monetary rule that ideally reduces and caps the Fed’s current balance sheet to at least where it was before the lockdowns. My work with Americans for Tax Reform shows that had the federal government used this spending limit over the last 20 years, the debt would have increased by just $700 billion instead of the actual $20.2 trillion. That’s much more manageable and would point us in a more sustainable fiscal and monetary direction.
Together, fiscal and monetary rules that rein in government will help reduce the roles that politicians and bureaucrats have in our lives so we can achieve our unique American dreams. If not, we will have wasted many dreams on Bidenomics that can make things look good on the surface, but cause rot underneath.
Clarification: When Biden and various members of Congress tout Biden as having created more jobs that previous Presidents, that is the ultimate gaslighting of the American people. Trump actually saw more job creation than Biden until Covid struck and politicians shut down the economy (and schools closed). Then like magic, after Biden was elected, many jobs returned. Biden and his lackies take credit for the incredible job market, but NEW jobs (rather than simply old jobs returning) had nothing to do with Biden’s Keynesian policies. Rather, Biden’s policies have helped destroy the jobs market.
And yes, the US is under invasion by the United Nations who are helping millions of migrants ILLEGALLY cross the US border, creating horrible stress on the economy and helping keep inflation high. Not to mention soaring crime. Its as if Biden (and his master Obama) are using the Cloward-Piven strategy of overwhelming the economy so it breaks.
All we hear about from Biden and Schumer (and their ilk) is about spending billions MORE on Ukraine and their oligarchs to “protect their borders” while Biden and Mayorkas (Cuba Pete) leave American borders over to invasion.
Yes, Democrats like The Clintons, Obamas and Bidens LOVE the Cloward-Piven strategy. Hey, they are all multi-millionaires and are insulated from all the damage they inflict on the middle class and low wage workers.
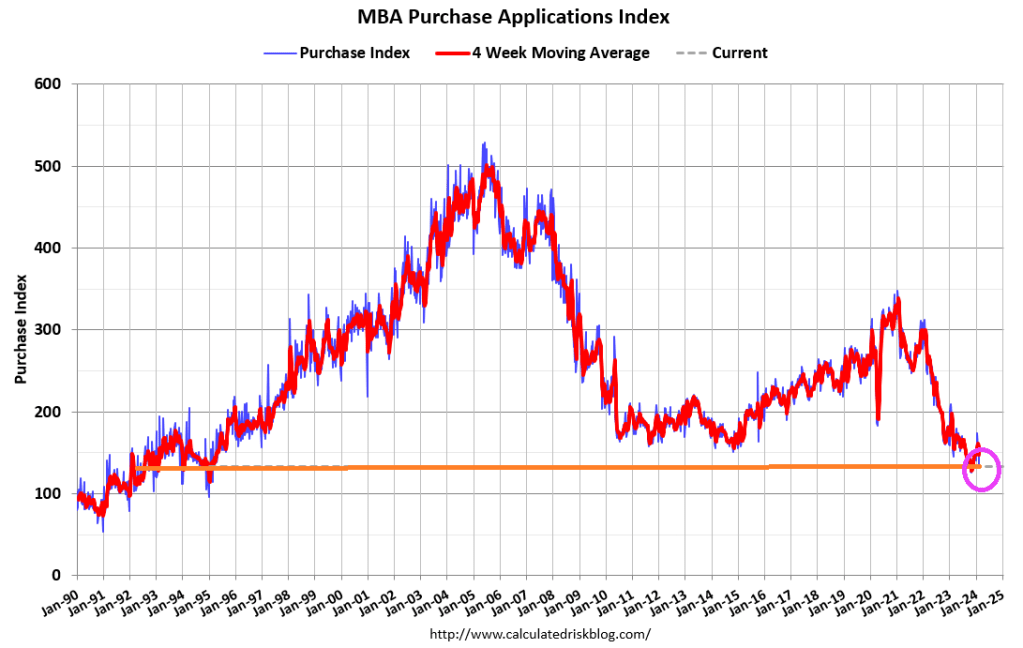
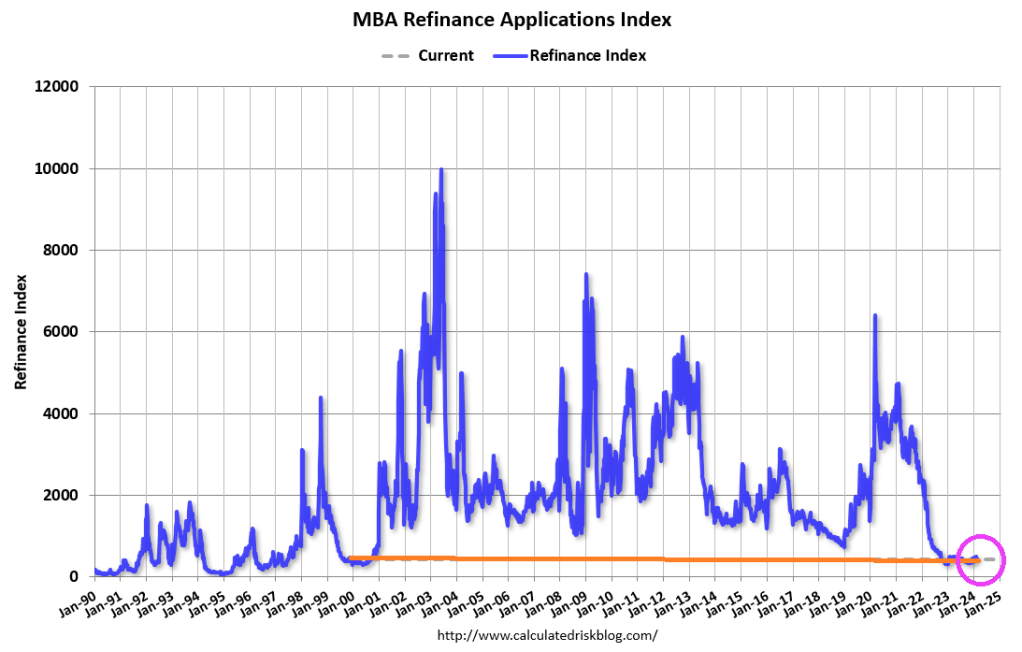
Mortgage applications decreased 10.6 percent from one week earlier, according to data from the Mortgage Bankers Association’s (MBA) Weekly Mortgage Applications Survey for the week ending February 16, 2024.
The Market Composite Index, a measure of mortgage loan application volume, decreased 10.6 percent on a seasonally adjusted basis from one week earlier. On an unadjusted basis, the Index decreased 8 percent compared with the previous week. The seasonally adjusted Purchase Index decreased 10 percent from one week earlier. The unadjusted Purchase Index decreased 6 percent compared with the previous week and was13 percent lower than the same week one year ago.
The Refinance Index decreased 11 percent from the previous week and was 0.1 percent higher than the same week one year ago.
One reason why mortgage demand is so low is that mortgage rates are up 155% under Biden.
Is it sundown for the US mortgage market? And when will it improve?? Probably won’t improve in New York City after Judge Engmoron’s idiotic fine of Donald Trump and family for non-crimes.


You must be logged in to post a comment.