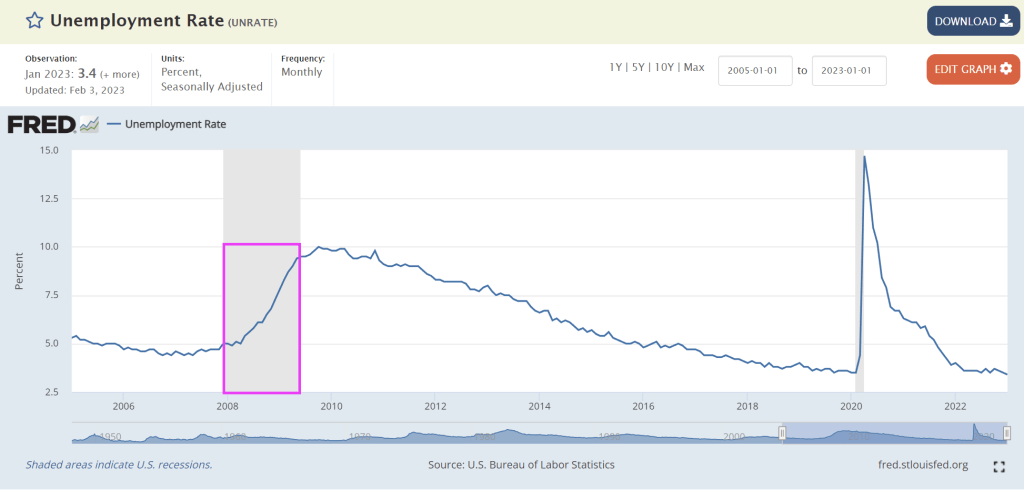
“The U.S. economy added 517,000 jobs in January, more than doubling Wall Street expectations and turning up its nose at prognosticators of an imminent recession. The unemployment rate dropped to 3.4 percent, the lowest level since 1969. Analysts were expecting it to move in the opposite direction, ticking up to 3.6 percent.”
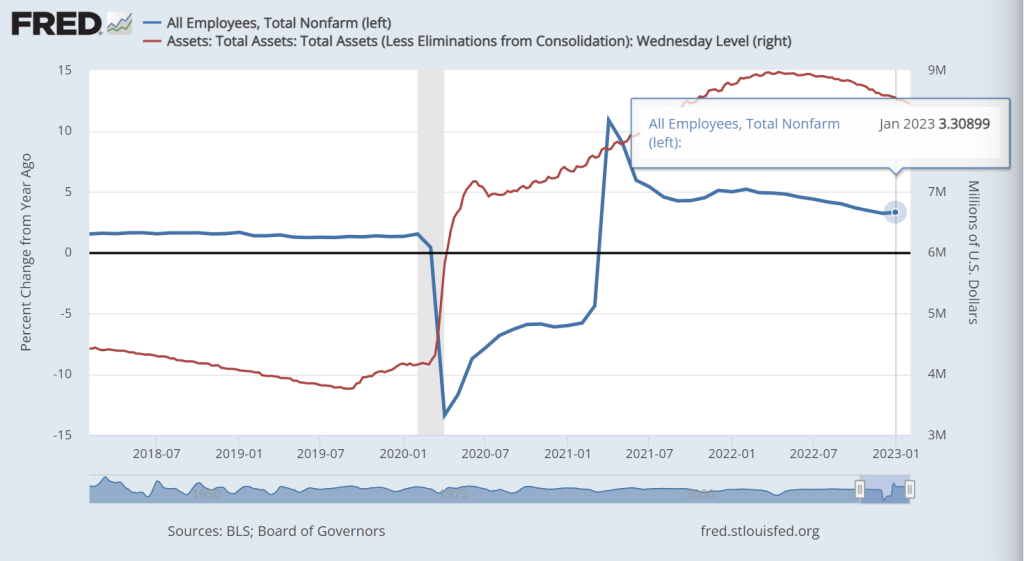
Yes, I was expecting U-3 unemployment to increase to 3.6% as well. What happened? Seasonal adjustments (BLS doens’t provide non-seasonally adjusted data). But the shocking headline (mostly due to seasonal adjustements) was not as surprising if we consider that jobs added in January grew at 3.309% year-over-year. Well, THAT isn’t all that surprising. Particularly since The Fed is slow walking its shrinking of The Fed balance sheet.
And with over 100 MILLION not in the labor force (apparently, the US labor force never really recovered from the Wuhan China virus), the U-3 unemployment rate touted by the media is misleading.
Bear in mind that employment is a LAGGING indicator. For example, the unemployment rate was 4.7% in November 2007 just prior to the beginning of the 2008-2009 Great Recession. So Biden’s bragging about the lowest unemployment rate since 1969 is meaningless in predicting recessions.
So, the January jobs report isn’t as surprising and strong as talking heads screamed about. I wish BLS would release non-seasonally adjusted (raw) data. But since we have a dysfunctional Federal government, I am not holding my breath.
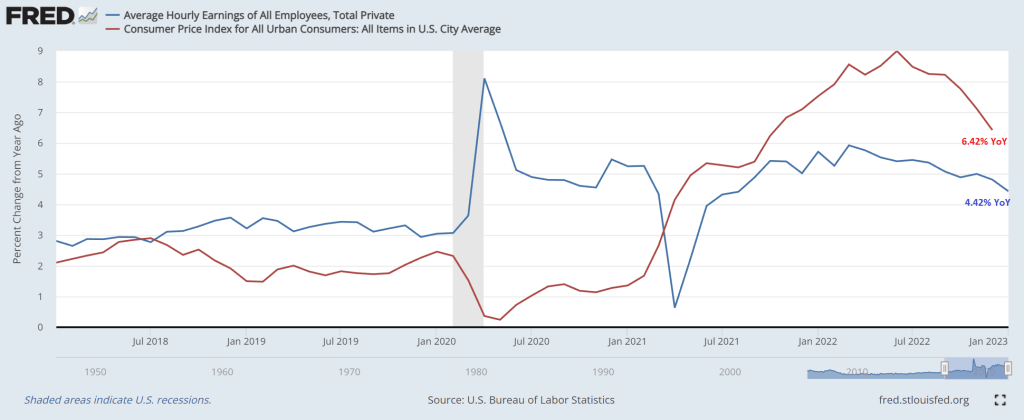
And I wouldn’t consider averrage hourly earnings growth YoY of 4.42% when headline US inflation is 6.42% particularly brag worthy.
Of course, Biden lied about inheriting inflation from Trump. Inflation was 1.28% YoY in December 2020 just before Biden was sworn-in as President. Then again, Biden lies about everything. At least he just refused to comment on the Chinese Spy Balloons.
Today’s jobs report from the Bureau of Labor Statists (BLS) was stunning. 517k jobs added! Very strange since the ADP jobs added report on Febuary 1st was only 106k. THAT is a huge discrepancy (probably a seasonal adjustment in the BLS reporting).
Average hourly earnings rose to 4.4% YoY. Too bad headline inflation is still roaring at 6.5%. So, the inflation tax is still overwhelming wage growth.
The spread between the January jobs report (BLS) and the ADP jobs added report (ADP) is similar to the infamous jobs report that the Philly Fed “corrected” (orange circle).
Here is the summary of the BLS numbers.
And on the strange jobs report, US Treasury 10-year yields are up 10+ basis points.
Where were the jobs added? How about “Hey Bartender!” since leisure and hospitality added 128k jobs in January.
Leisure and hospitality added 128,000 jobs in January compared with an average of 89,000 jobs per month in 2022. Over the month, food services and drinking places added 99,000 jobs, while employment continued to trend up in accommodation (+15,000).
In January, employment in professional and business services rose by 82,000, led by gains in professional, scientific, and technical services (+41,000). Job growth in professional and business services averaged 63,000 per month in 2022.
Government employment increased by 74,000 in January. Employment in state government education increased by 35,000, reflecting the return of university workers after a strike.
Health care added 58,000 jobs in January. Job growth occurred in ambulatory health care services (+30,000), nursing and residential care facilities (+17,000), and hospitals (+11,000).
Employment in retail trade rose by 30,000 in January, following little net growth in 2022 (an average of +7,000 per month). In January, job gains in general merchandise retailers (+16,000) and in furniture, home furnishings, electronics, and appliance retailers (+7,000) were partially offset by a decline in health and personal care retailers (-6,000).
Construction added 25,000 jobs in January, reflecting an employment gain in specialty trade contractors (+22,000). Employment in the construction industry grew by an average of 22,000 per month in 2022.
In January, transportation and warehousing added 23,000 jobs, the same as the industry’s average monthly gain in 2022. Over the month, employment in support activities for transportation increased by 7,000.
Employment in social assistance increased by 21,000 in January, little different from the 2022 average gain of 19,000 per month.
Manufacturing employment continued to trend up in January (+19,000). In 2022, manufacturing added an average of 33,000 jobs per month.
Employment showed little change over the month in other major industries, including mining, quarrying, and oil and gas extraction; wholesale trade; information; financial activities; and other services.
The source of the jobs miracle? Changes in how jobs are measured.
Changes to The Employment Situation Data | | | | Establishment survey data have been revised as a result of the annual benchmarking | | process, the NAICS 2022 conversion, and the updating of seasonal adjustment factors. | | Also, household survey data for January 2023 reflect updated population estimates. | | See the notes at the end of this news release for more information. | |_________________________________________________________
President Biden had better give his State of the Union Address before the economy worsens any more.
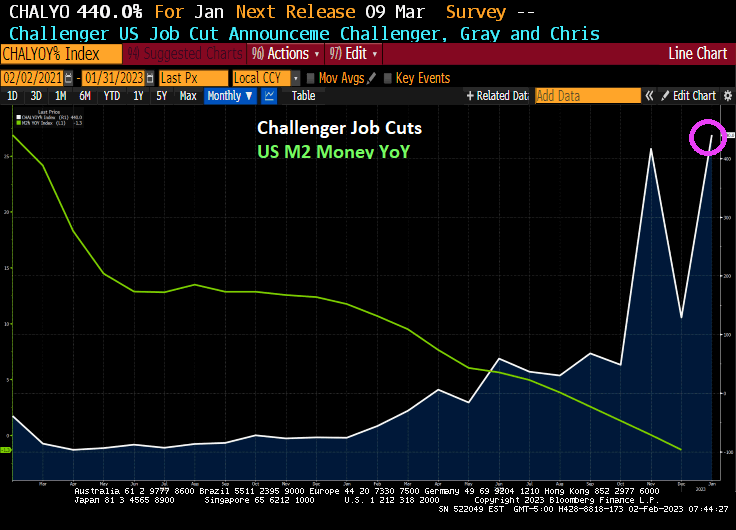
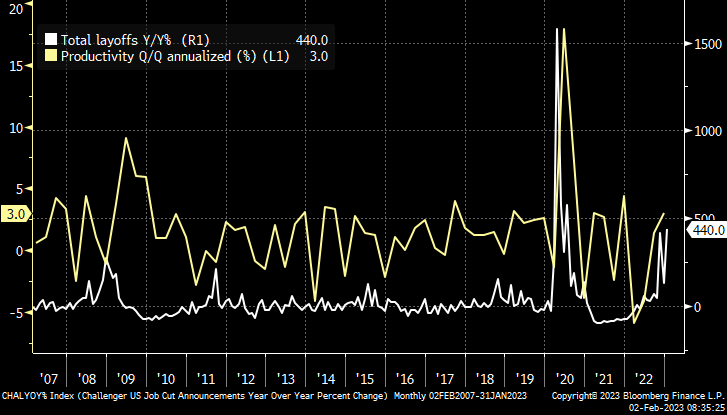
In January, the Challenger, Gray and Christmas jobs cuts index was a doozy. Jobs cuts rose 440%. This is happening as The Federal Reserve keeps its feet on the monetary brake pedal.
The Challenger report shows a big jump of 135.8 percent in layoff intentions to 102,943 in January, up from 43,651 in December and 440.0 percent higher than the 19,064 in January 2022. Many of the job cuts are in the tech sector, but job cuts are now spreading across the economy as a recession looms.
This morning, the US Treasury 10-year yield is down only -3.5 basis points, but it is Europe where the action is. UK is down -16.2 basis points and Italy is down -14.8 bps. UPDATE: US 10Y yield down -5.3 BPS, Italy 10Y down -29 bps.
The January mortgage applications book is closed. And we are off to another year of rising applications until May. Then the downhill slide.
Mortgage applications decreased 9.0 percent from one week earlier, according to data from the Mortgage Bankers Association’s (MBA) Weekly Mortgage Applications Survey for the week ending January 27, 2023.
The Refinance Index decreased 7 percent from the previous week and was 80 percent lower than the same week one year ago. The seasonally adjusted Purchase Index decreased 10 percent from one week earlier. The unadjusted Purchase Index increased 7 percent compared with the previous week and was 41 percent lower than the same week one year ago.
US mortgage rates have been steadily declining since November 2022.
The Federal Reserve’s Open Market Committee (FOMC) is meeting on Wednesday. What will they do?
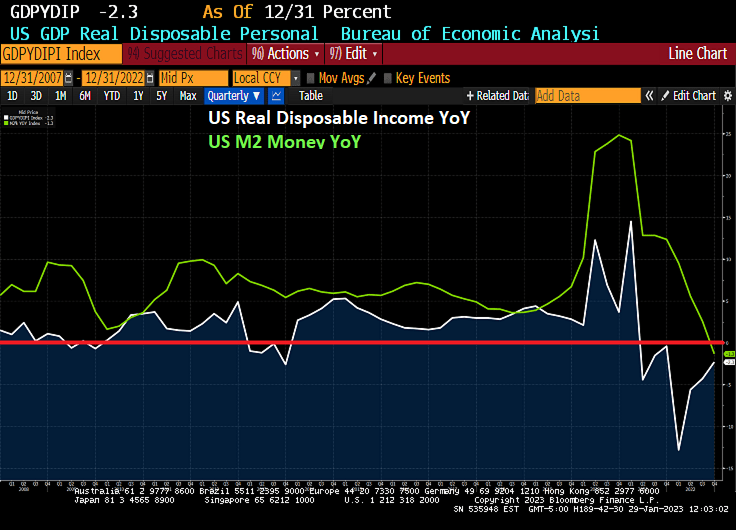
First, The Fed Funds Target (upper bound) is above the Core US inflation rate YoY. Second, M2 Money growth YoY has slowed to -1.3%.
Of course, the members of the FOMC might decide that this is not enough and may keep raising rates and shrinking The Fed’s enormous balance sheet.
In the “Haven’t they suffered enough?” arena, US real disposable income has fallen by -21% since Biden was sworn-in as President.
On the other hand, the Taylor Rule is still pointing to a target rate of 10% (we aren’t even half way there at 4.50%).
Oh and the price of insuring against a US debt default remains elevated (since Biden and Schumer are baving like arrogant bullies) and are refusing to negotitate over spending cuts.
The 1Y CDS volatility cube indicates that it will all be over soon.
Welcome to the wonderful world of Bidenomics, giving the US 40 year highs in inflation leading The Federal Reserve to remove its enormous monetary stimulus (known as “The Punch Bowl.”
I previously pointed out that US Real GDP was actually less than 1% year-over-year (YoY) in 2022, hardly a fantastic number given the trillions in Biden/Pelosi/Schumer spending (Omnibus, Infrastructure, etc) and Powell/Fed’s whopping monetary stimulus in 2020. But real disposable income, the amount households have left to spend after adjusting for inflation, had been falling for 7 straight months.
In fact, REAL disposable personal income peaked in March 2021, shortly after Biden was sworn-in as President in Janaury 2021 at $19,213.9 billion (or $19.214 TRILLION). As of December 2022, real personal disposable income had fallen to $15,213.0 or $15.213 TRILLION. That is a loss of $4 TRILLION since March 2021. Or a -21% Loss in Real Disposable Income.
Despite polticians like President Biden cheerleading his great economic accomplishments and Treasury Secretary Janet Yellen dipping into Social Security to fund the Federal government (much like Biden’s dipping into the Strategic Petroleum Reserve), there are serious problems facing America’s middle class and low-wage workers. Inflation is still brutal (but slowing) and REAL weekly earnings growth has been negative for 21 straight months (meaning that Biden’s bragging about wage growth has been destroyed by the inflation created by his energy policies and massive spending sprees). Personal spending rate YoY has plunged -53.5% to cope with inflation. To quote Joe Biden (Chauncy Gardner), “All is well in the garden.” But all is not well in the garden. As a result, we are now seeing pension funds jumping from stocks to bonds.
(Bloomberg) For some of America’s biggest bond buyers, the soft-versus-hard-landing debate on Wall Street might be a sideshow. They’re getting ready to swoop in with as much as $1 trillion, no matter what happens.
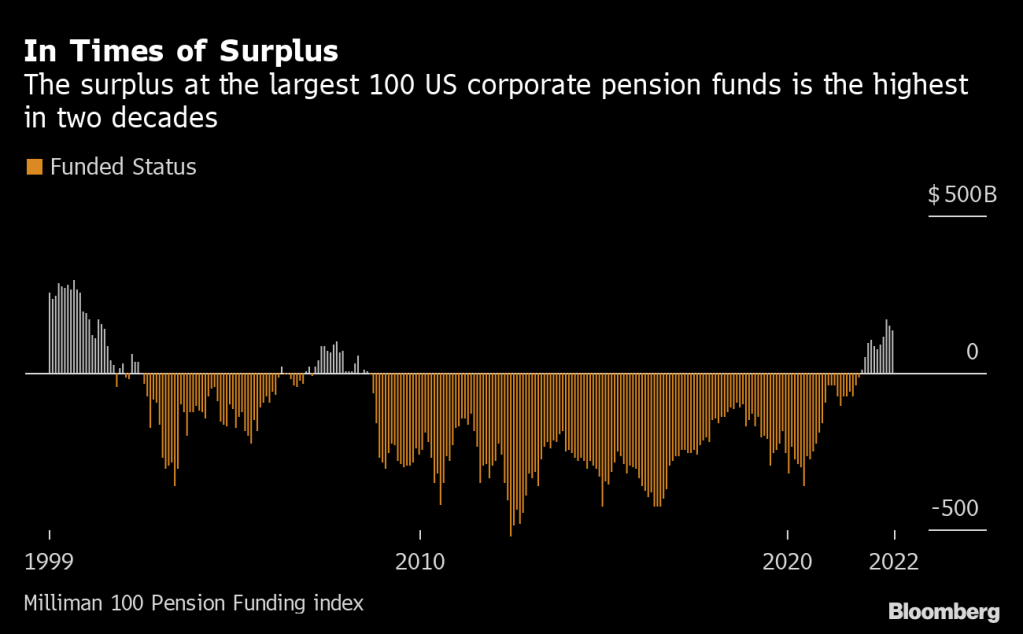
One of the pillars of the trillion-dollar pension fund complex is now awash in cash after struggling under deficits for two decades. This rare surplus at corporate defined-benefit plans, thanks to surging interest rates, means they can reallocate to bonds that are less volatile than stocks — “derisking” in industry parlance.
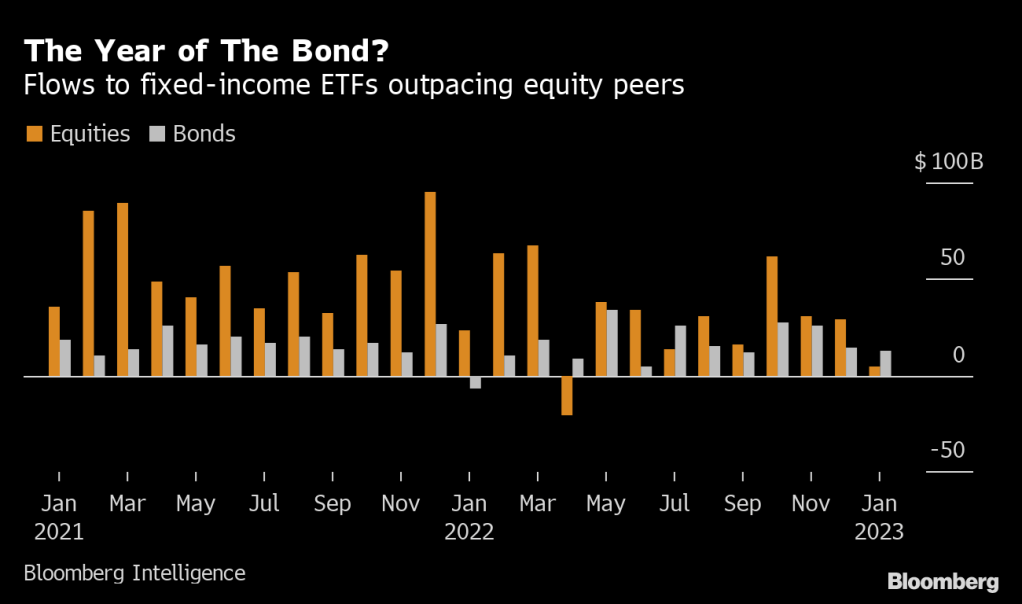
Strategists at Wall Street banks including JPMorgan Chase & Co., Bank of America Corp. and Wells Fargo & Co. say the impact will be far-reaching in what’s already being coined “the year of the bond.” Judging from the cash flooding into fixed income, they’re just getting started.
“The pensions are in good shape. They can now essentially immunize — take out the equities, move into bonds and try to have assets match liabilities,” Mike Schumacher, head of macro strategy at Wells Fargo, said in an interview. “That explains some of the rallying of the bond market over the last three or four weeks.”
An irony of pension accounting is that a year like last year, with its twin routs in stocks and bonds, can be a blessing of sorts to some benefit plans, whose future costs are a function of interest rates. When rates climb, their liabilities shrink and their “funded status” actually improves.
The largest 100 US corporate pension plans now enjoy an average funding ratio of about 110%, the highest level in more than two decades, according to the Milliman 100 Pension Funding index. That’s welcome news for fund managers who suffered years of rock-bottom interest rates and were forced to chase returns in the equity market.
Now, they have an opportunity to unwind that imbalance and Wall Street banks pretty much agree on how they’ll use the extra cash to do it: buying bonds, and then selling stocks to buy more bonds.
Already this year fixed-income flows are outpacing those of equity funds, marking the most lopsided relationship since July.
How much of that is due to derisking by pension funds is anyone’s guess. Some of the recent rally in bonds can be ascribed to traders hedging a growth downturn that would hit stocks hardest.
But what’s obvious is their clear preference for long-maturity fixed-income assets that most closely match their long-dated liabilities.
Pension funds need to keep some exposure to stocks to boost returns, but that equation is changing.
Once a corporate plan reaches full funding, their aim is often to derisk by jettisoning stocks and adding fixed income assets that line up with their liabilities. With the largest 100 US corporate defined benefit funds riding a cash pile of $133 billion after average yields on corporate debt more than doubled last year, their path is wide open.
With yields unlikely to go above their peak level once the Federal Reserve hits its terminal rate of about 5% around the middle of the year, there’s rarely been a better time for them to make the switch to bonds.
Even if growth surprises on the upside and yields rise, causing bonds to underperform, the incentive is still there, said Bruno Braizinha, a strategist at Bank of America.
“At this point and considering where we are in the cycle, the conditions are favorable for de-risking,” Braizinha said in an interview.
JPMorgan’s strategist Marko Kolanovic estimates derisking will lead pension managers to buy as much as $1 trillion of bonds; Bank of America’s Braizinha says a $500 billion buying spree is closer to the mark.
How about gold? As the probability of a US debt default looms (as Bride of Chucky Schumer stomps his feet and says ” No budget cuts!”) and the US Treasury 10Y-3M yield curve remains inverted, gold is soaring.
Perhaps pension funds should by gold rather than cryptos.
Today’s GDP report from the BEA reminds me of the Peggy Lee song “Is That All There Is?” Between the massive Fed monetary stimulus since late 2008 (and particularly since Covid in 2020) and all the Federal spending (Covid relief, Inflation reduction, Omnipork spending bill, etc.), US real GDP rose by only 2.9% in Q4 from Q3.
But signs of slowing underlying demand mounted as the steepest interest-rate hikes in decades threaten growth this year.
Gross domestic product increased at a 2.9% annualized rate in final three months of 2022 after a 3.2% gain in the third quarter, the Commerce Department’s initial estimate showed Thursday.
Personal consumption, the biggest part of the economy, climbed at a below-forecast 2.1% pace (forecast was for 2.9%). Again,
The report also showed some signs of stress for American consumers whose wages have failed to keep up with inflation and continued to encourage them to draw down savings accumulated from government pandemic-relief programs. The burden of elevated prices and higher borrowing costs is mounting, pointing to a tenuous outlook for the economy.
A key gauge of underlying demand that strips out the trade and inventories components — inflation-adjusted final sales to domestic purchasers — rose an annualized 0.8% in the fourth quarter after a 1.5% gain.
Core PCE growth grew at 3.9%, but is slowing already as M2 Money growth dies.
Stock-index futures and Treasury yields remained higher and the dollar was little changed after the GDP report and better-than-expected weekly jobless claims. Applications for unemployment insurance dropped to 186,000 last week, the lowest since April.
Recent data show cracks are developing more broadly. Retail and motor vehicle sales data showed households are starting to retrench, the housing market continues to weaken and some businesses are reconsidering capital spending plans.
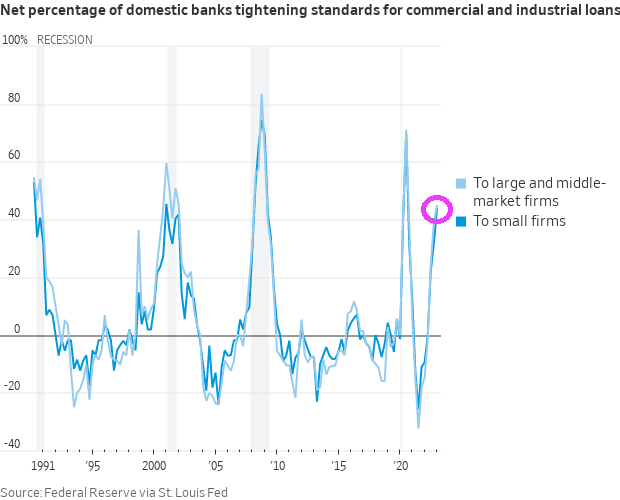
As the Federal Reserve continues to hike interest rates to ensure inflation is extinguished, housing and manufacturing have deteriorated quickly while industries including banking and technology are carrying out mass layoffs.
The GDP report showed the personal consumption expenditures price index, a key inflation metric for the Fed, rose at an annualized 3.2% rate in the fourth quarter, down from a 4.3% pace in the prior three months. The core index that excludes food and energy climbed at a 3.9% rate compared with 4.7% paces in the prior two quarters. Monthly data for December will be released Friday.
The moderation in price pressures is consistent with forecasts that the Fed will further scale back its tightening campaign next week, when it’s expected to raise rates by 25 basis points. Policymakers boosted the benchmark rate by 50 points in December after 75 basis-point hikes at their previous four meetings.
The world’s largest economy expanded 2.1% last year. In 2021, when demand snapped back from pandemic-related shutdowns, the economy grew 5.9% — the best performance since 1984.
The GDP data showed services spending increased at 2.6% annualized rate in the October-December period, the slowest since last year’s first quarter. Outlays on goods rose at a 1.1% pace, the first advance since 2021.
Business investment slowed sharply after a third-quarter surge. Spending on equipment declined an annualized 3.7%, the most since the second quarter of 2020. Outlays for structures rose at a 0.4% pace.
Let’s hope the BEA isn’t padding the numbers like the BLS was caught doing in the first half of 2022.
Lastly, US Real GDP growth YoY FELL to only 0.95925% as M2 Money growth disappears.


You must be logged in to post a comment.