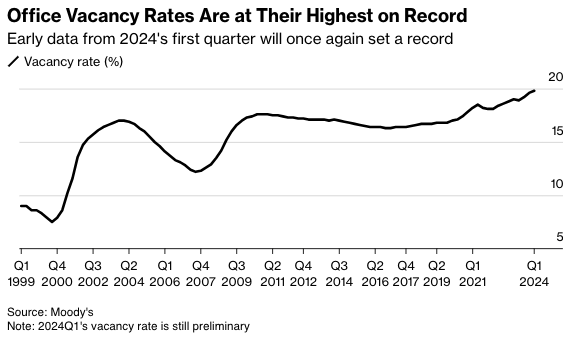
The rising supply of office space is due to a combination of surging remote and hybrid work that forces companies to reduce corporate footprints. Also, companies are exiting imploding progressive cities and high-taxed blue states for red ones while downsizing space. In the report, office tower vacancies rose to a record 19.8%, up from 19.6% in the fourth quarter of 2023.
Even with the increase, there is an eerily calm across the commercial real estate sector. This comes as the Federal Reserve’s interest rate hiking cycle is higher for longer, indicating that the pain train is nearing (perhaps after the presidential election).
“The office stress isn’t quite done yet,” Thomas LaSalvia, Moody’s head of commercial real estate economics and one of the authors of the report, told Bloomberg in an interview. He noted recent positive economic indicators stave off a “perfect storm in the office sector.”
“There are spots of light and there are spots of extreme darkness,” LaSalvia said, adding, “This is part of a longer-term evolution where we are seeing obsolete buildings in obsolete neighborhoods.”
The high office vacancy rate continues to be terrible news for landlords and developers eager to fill their buildings, and the Fed’s hiking cycle has made refinancing very challenging.
Viswanathan said there have been no major fireworks in CRE tower debt because the debt is being “extended and modified rather than refinanced,” which “mitigates a default wave and a sharp pick-up in losses on CRE loan portfolios.”
Yes, both residential and commercial real estate are thunderstruck under Bidenomics.
Mortgage applications decreased 0.6 percent from one week earlier, according to data from the Mortgage Bankers Association’s (MBA) Weekly Mortgage Applications Survey for the week ending March 29, 2024.
The Market Composite Index, a measure of mortgage loan application volume, decreased 0.6 percent on a seasonally adjusted basis from one week earlier. On an unadjusted basis, the Index decreased 0.1 percent compared with the previous week. The seasonally adjusted Purchase Index decreased 0.1 percent from one week earlier. The unadjusted Purchase Index increased 1 percent compared with the previous week and was 13 percent lower than the same week one year ago.
The Refinance Index decreased 2 percent from the previous week and was 5 percent lower than the same week one year ago.
What a mess! With M2 Money up 8.4% under Biden (green line), home prices are up a staggering 39.2% under Sheriff Joe and his deputy Fed chair Jerome Powell.
And conforming mortgage rates (30Y) are up 148% under Biden’s Reign of Error.
Thanks O’Biden! Although Biden is the figurehead, Obama and his team are still running The White House. Regardess of whether it is Biden or Obama (or Soros/World Economic Forum) calling the shots, the US housing market is on a highway to hell.
Bidenomics “helping” the middle class and low wage workers.
Happy Easter! I mean Happy TRADITIONAL Easter, not a Biden weird trans celebration.
Biden and Congress (Schumer, Johnson, McConnell, etc) spend and borrow like its cottage cheese.
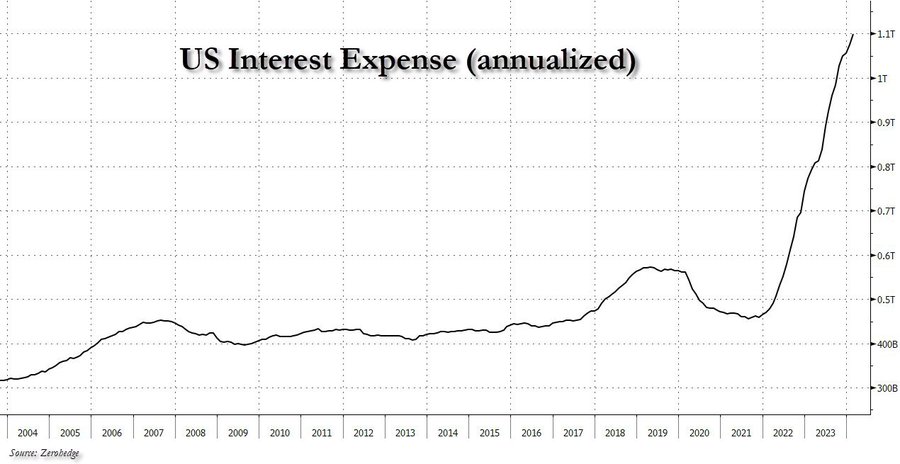
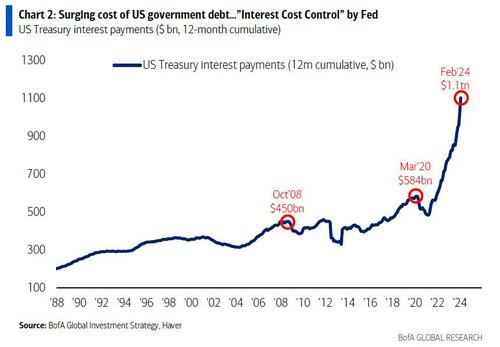
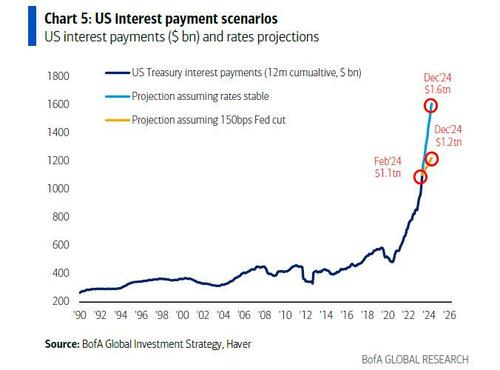
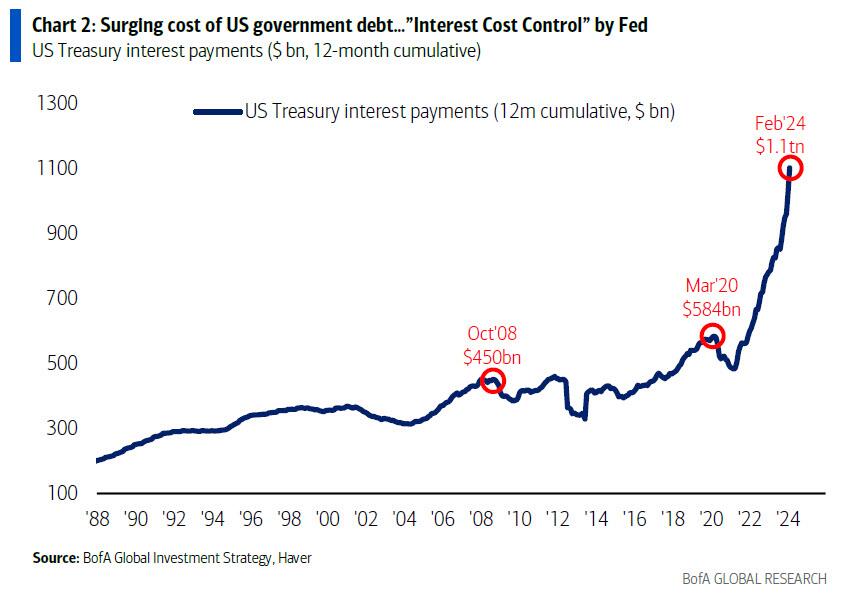
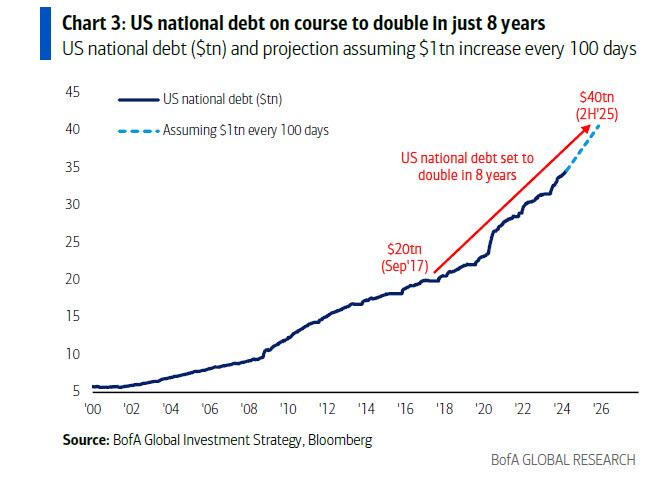
After hitting $1 trillion in late 2023, interest expense on US debt rose to a record $1.1 trillion in late March, and ii) while US debt is now rising at a pace of $1 trillion every 3 months, US interest expense is rising at a just as torrid $100 billion every 4 months (this interval will also shrink to three months very soon).
he Biggest Picture: $1.1tn in interest payments on US government debt past 12 months, doubled since COVID (Chart 2); trend in govt spending (up 9% YoY) & debt (up $1.0tn every 100 days)…big motivation for Fed to cut rates to constrain surge in interest costs (“ICC” or Interest Cost Control policy)… bear in bonds (if no recession), steeper yield curve, weaker US$, higher commodities/gold/crypto & TINA for stocks.
Of course, since Hartnett is one of those good strategists where one fact opens up a cascade of downstream observations, that’s precisely what happened this time and he fills out the balance of his latest report (available to pro subscribers in the usual place) with his tongue-in-cheek notes on why the US is on a doomsday date with a debtdisaster, starting with why being a “dove means never having to say you’re sorry”:
US government spending past 5 months = $2.7tn, up 9% YoY… on course for $6.7tn in FY24; US national debt rising $1tn every 100 days…set to hit $35tn in May’24, $37tn by US election, $40tn in H2’25 (doubling in 8 years); spending up, deficits up (9% of GDP average past 4 years), debt up -> interest payments up = $1.1tn in past 12 months & set to rise by $150bn in next 100 days[ZH: this sounds familiar]
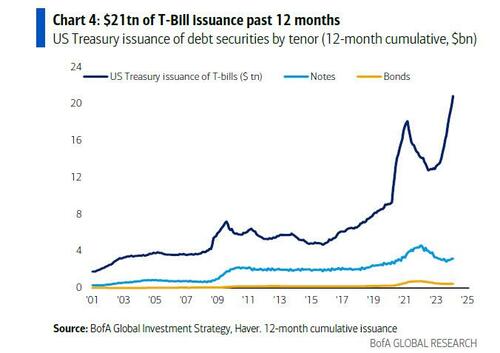
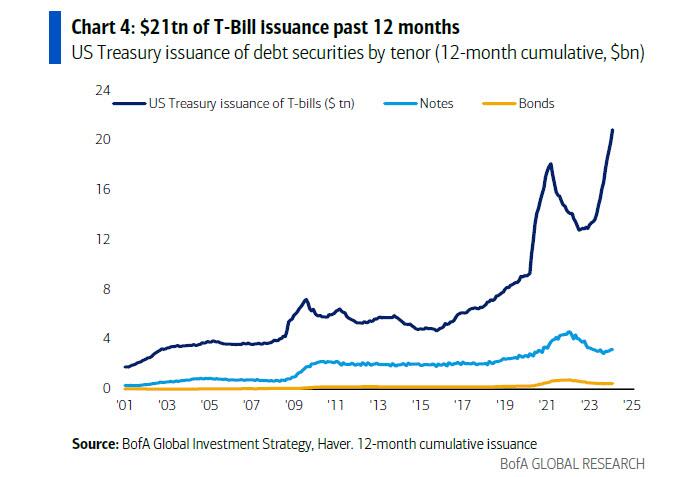
US Treasury has aggressively shifted refunding toward <1-year T-Bills ($21tn issuance past 12 months), lowering maturity of debt to ≈5 years, increasing sensitivity to short rates, incentivizing Fed to cut rates;
And the punchline: Hartnett takes our observations, and expands them to their logical, if absurd, extreme (which ironically takes places in just 9 months) to find that US annual interest costs are set to jump from $1.1 trillion to $1.6 trillion, which is a big deal…
Unchanged rates/yields & debt trend next 12 months & US refinancing rate is 4.4% & annual interest costs jump from $1.1tn to $1.6tn (Chart 5); in contrast 150bps of Fed cuts next 12 months and average refi rate is 3.2%, stabilizing/constraining interest payments to $1.2-1.3tn over next 2 years; call it “ICC”/Interest Cost Control but Fed must placate fiscal excess coming quarters…bear in bonds (if no recession), steeper yield curve, weaker US$, higher commodities/gold/crypto & TINA for stocks.
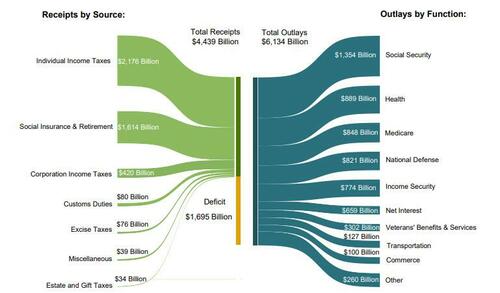
… because if the Fed does not cut rate by 150bps (as it may in an “ICC” scenario) should inflation prove to be sticky (something which Putin clearly has figured out realizing the fate of Biden’s re-election is in his oily hands), and total interest does rise to $1.6 trillion by year-end, that it will become the single biggest US government outlay by the end of the fiscal year; as a reminder, in fiscal 2023, Social Security spending was $1.354 trillion, Health was $889 billion, Medicare $848 and national defense, a paltry (by comparison) $821 billion.
Stepping briefly away from the looming US debt disaster, Hartnett makes three more observations on the current state of the market:
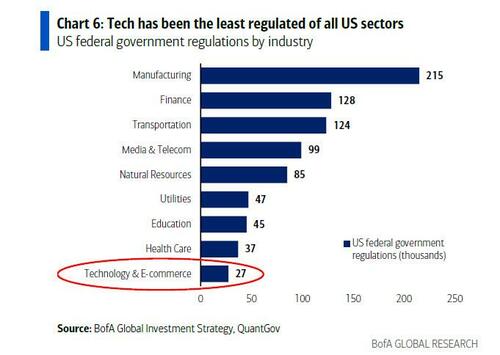
Tech regulation getting noisier: DoJ vs Apple antitrust lawsuit, FTC vs Amazon antitrust lawsuit, FTC inquiry into AI deals of Amazon, Google, Microsoft; EU investigation into Apple, Meta, Google breach of Digital Markets Act; EU $2bn Apple antitrust fine, Japan FTC Apple & Google antitrust complaint et al…
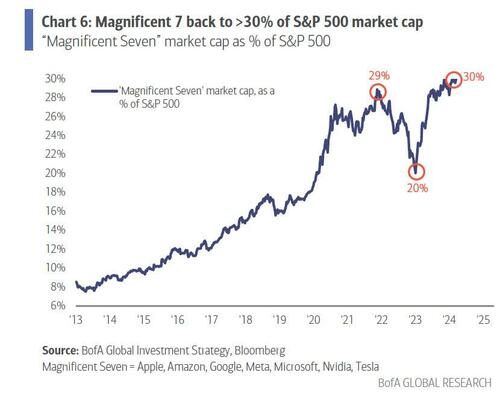
“Magnificent 7” = 30% of SPX index & 60% of SPX gains past 12 months…investors love big tech “moats”, monopolistic ability to protect margins, market share, pricing power, finance & control AI arms race; but ≈$2tn of Magnificent 7 revenues past 12 months tempting target for regulators/governments struggling to pay bills;
Note tech historically the least regulated of sectors (the chart below uses data from 2017) and in past 12 months average tax rate of “Magnificent 7” was 15% vs 21% for rest of S&P 500… and regulation & rates the historic way sector bulls & bubbles end.
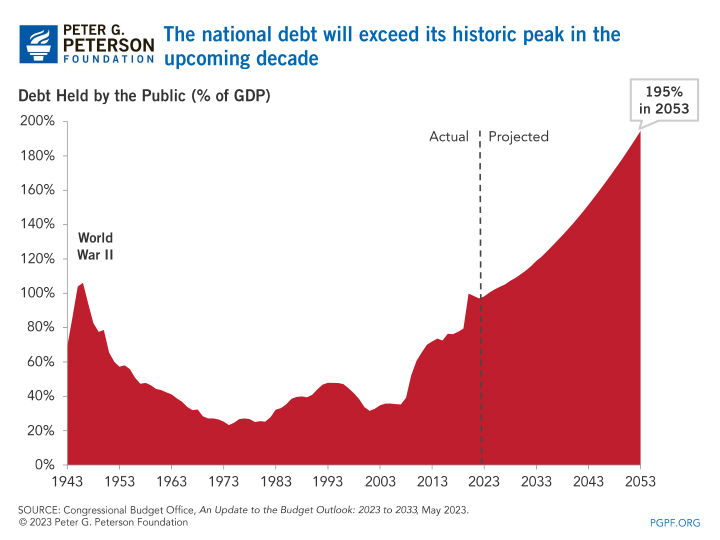
Now for the REALLY bad news. Unfunded liabilities (entitlements) have hit $214+ TRILLION. Given how voters hate paying more in taxes, look for the growing entitlements to add AT LEAST $214 trillion in NEW DEBT which will result in record high interest payments.
Hey big spender! How about NOT spending trilliions while pocketing 10% from foreign enemies?
Congress and The Biden Regime should select the now defunct British beer Watney’s Red Barrell (a truly awful beer) to symbolize their committment (or lack thereof) to fiscal responsibilty.
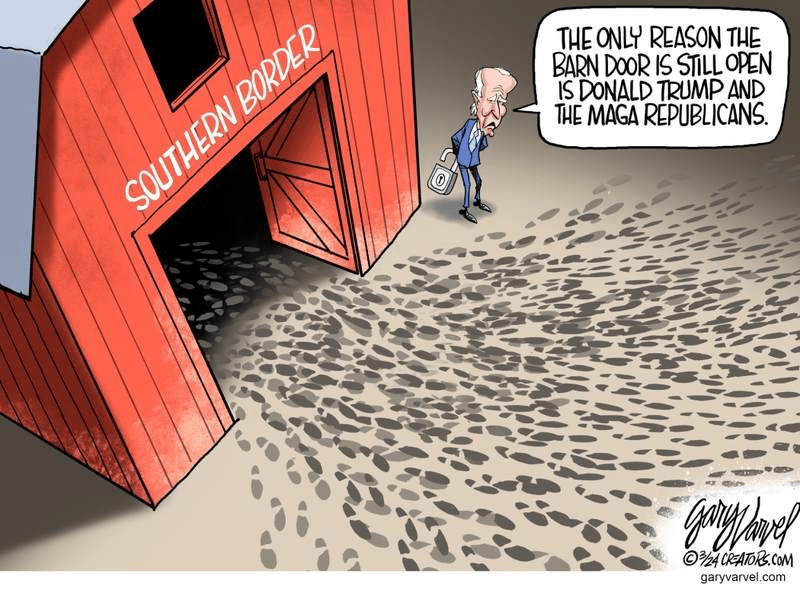
Biden loves to blame Republicans for the border crisis. Although he has it in his power to close and secure the border, but won’t. It’s easier to blame the opposition, like “extreme MAGA Republicans.” Huh, I didn’t realize that as a conservative American I am considered extreme by the Biden Administration.
Unfortunately, Biden, Schumer and Johnson only provided financial support for Jordan, Lebanon, Egypt, Tunisia and Oman. In the form of $380 million.
As the US falls to 23rd in World Happiness ranking. Based, in part, on Biden’s idiotic open borders policy.
1. Everybuddy: 100% of workforce 2. Wisense: 100% of workforce 3. CodeSee: 100% of workforce 4. Twig: 100% of workforce 5. Twitch: 35% of workforce 6. Roomba: 31% of workforce 7. Bumble: 30% of workforce 8. Farfetch: 25% of workforce 9. Away: 25% of workforce 10. Hasbro: 20% of workforce 11. LA Times: 20% of workforce 12. Wint Wealth: 20% of workforce 13. Finder: 17% of workforce 14. Spotify: 17% of workforce 15. Buzzfeed: 16% of workforce 16. Levi’s: 15% of workforce 17. Xerox: 15% of workforce 18. Qualtrics: 14% of workforce 19. Wayfair: 13% of workforce 20. Duolingo: 10% of workforce 21. Rivian: 10% of workforce 22. Washington Post: 10% of workforce 23. Snap: 10% of workforce 24. eBay: 9% of workforce 25. Sony Interactive: 8% of workforce 26. Expedia: 8% of workforce 27. Business Insider: 8% of workforce 28. Instacart: 7% of workforce 29. Paypal: 7% of workforce 30. Okta: 7% of workforce 31. Charles Schwab: 6% of workforce 32. Docusign: 6% of workforce 33. Riskified: 6% of workforce 34. EA: 5% of workforce 35. Motional: 5% of workforce 36. Mozilla: 5% of workforce 37. Vacasa: 5% of workforce 38. CISCO: 5% of workforce 39. UPS: 2% of workforce 40. Nike: 2% of workforce 41. Blackrock: 3% of workforce 42. Paramount: 3% of workforce 43. Citigroup: 20,000 employees 44. ThyssenKrupp: 5,000 employees 45. Best Buy: 3,500 employees 46. Barry Callebaut: 2,500 employees 47. Outback Steakhouse: 1,000 48. Northrop Grumman: 1,000 employees 49. Pixar: 1,300 employees 50. Perrigo: 500 employees
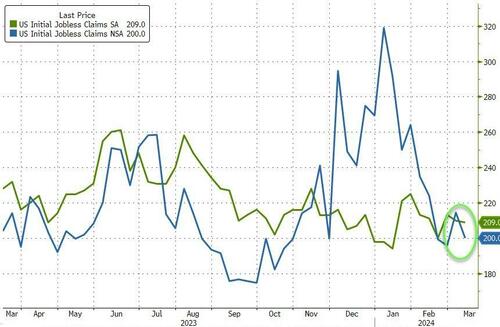
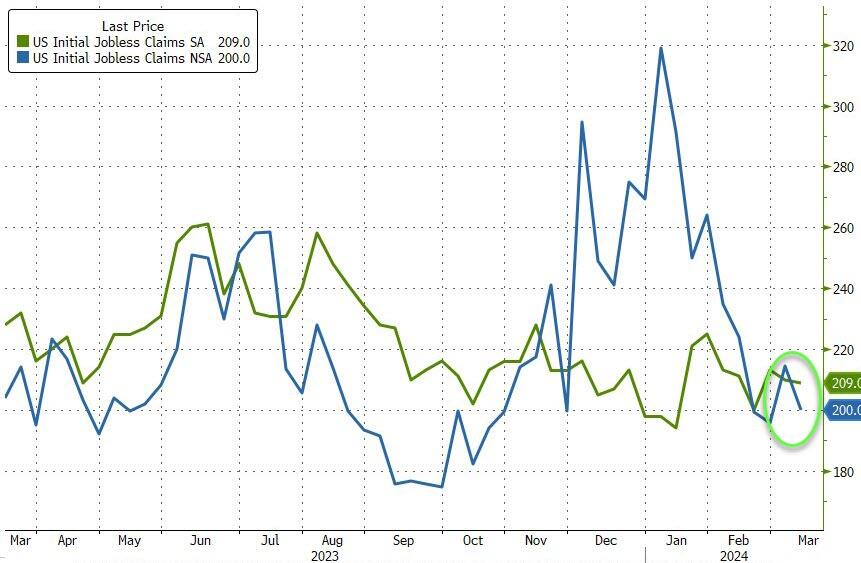
But, according to the government-supplied data…
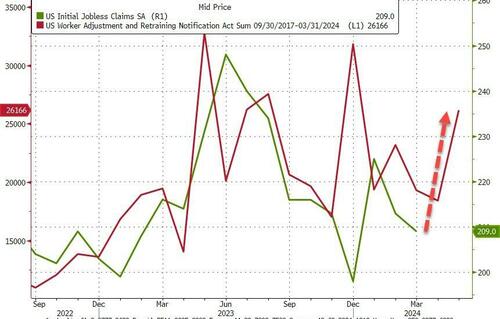
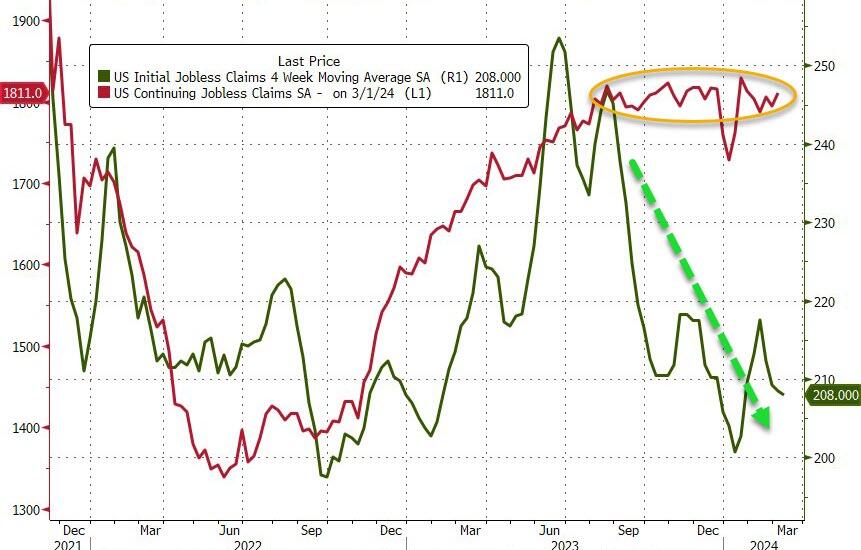
The number of American filing for jobless benefits for the first time last week dropped to 209k (vs 218k exp) with the NSA number tumbling to 200k…
Source: Bloomberg
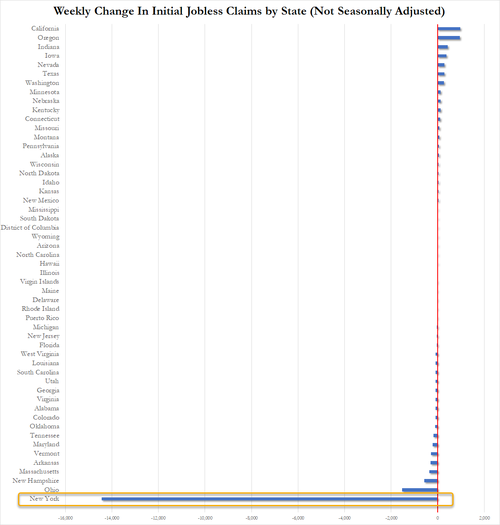
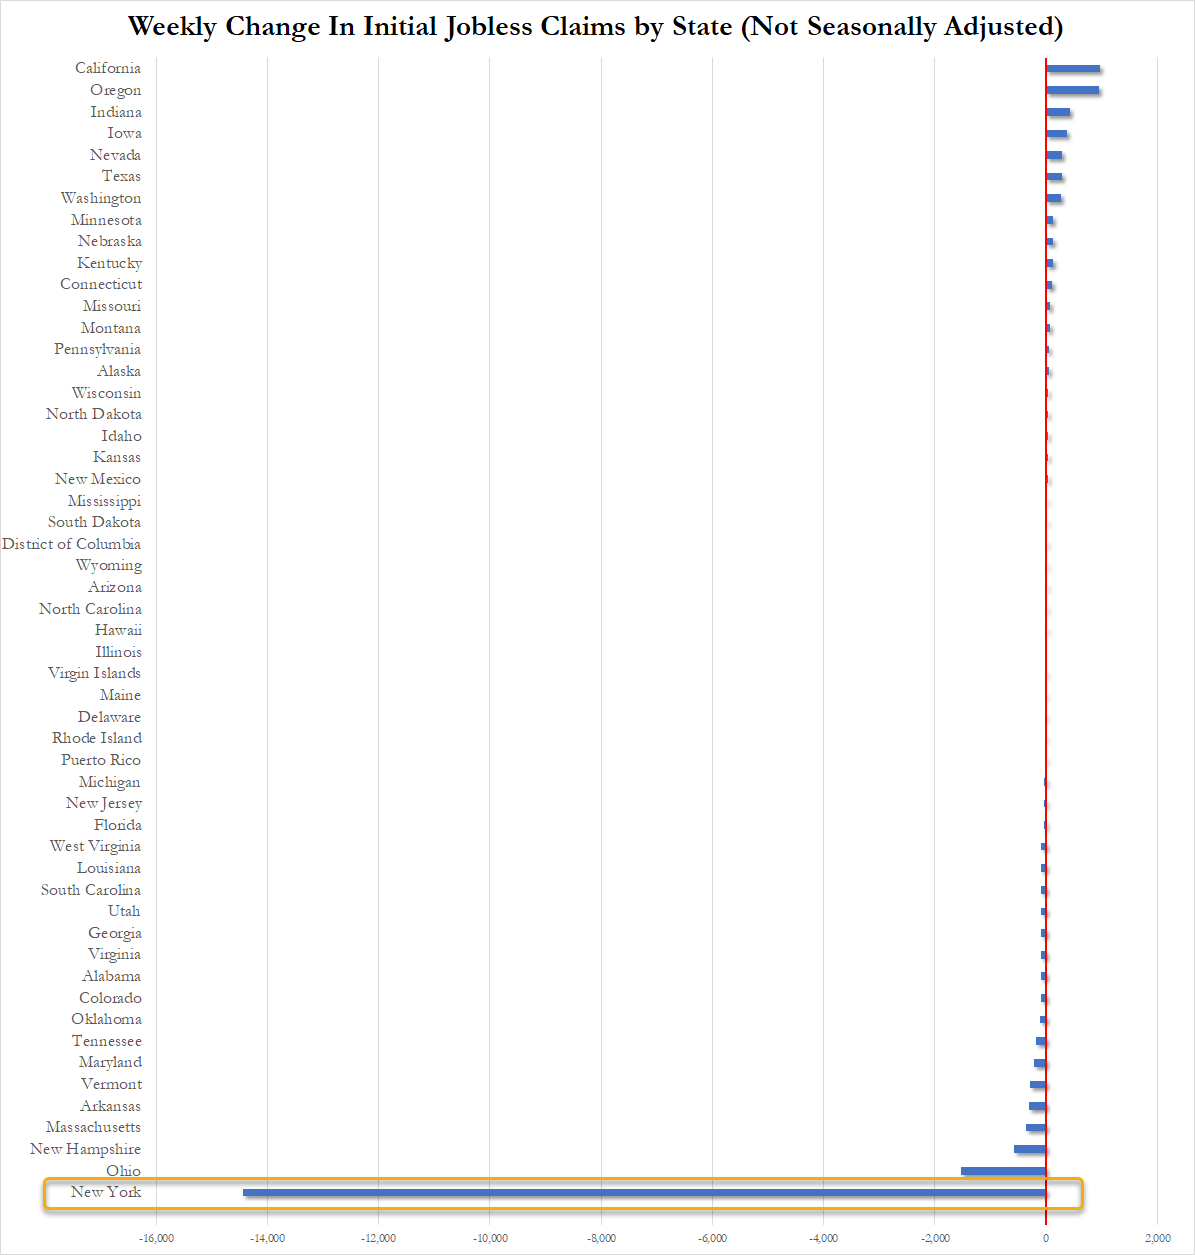
How is this possible, you may ask… well let us show you the ways… New York State claims that its jobless benefits rolls collapsed last week. New York accounted for 99.75% of the weekly change in initial claims across the entire US as shown below…
Source: Bloomberg
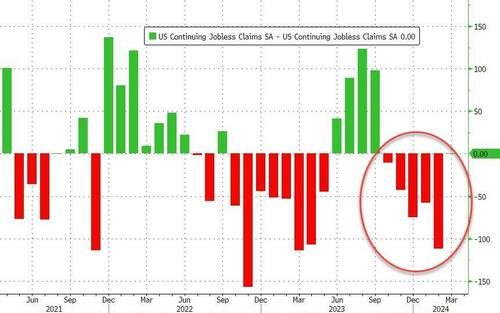
Continuing Claims was a shit show – with a massive 112k person downward revision for last week from 1.906 million to 1.794mm. That is the 5th straight weekly downward revision of continuing claims…
Source: Bloomberg
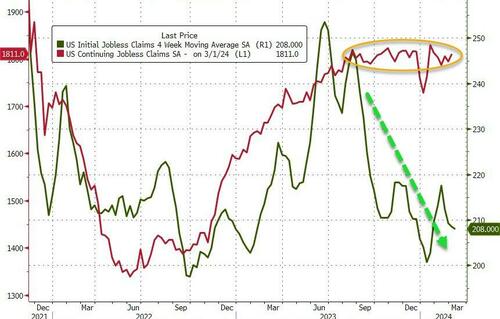
But thanks to the adjustments, it all looks ‘normal’ and ‘stable’ at around 1.8 million Americans…
Source: Bloomberg
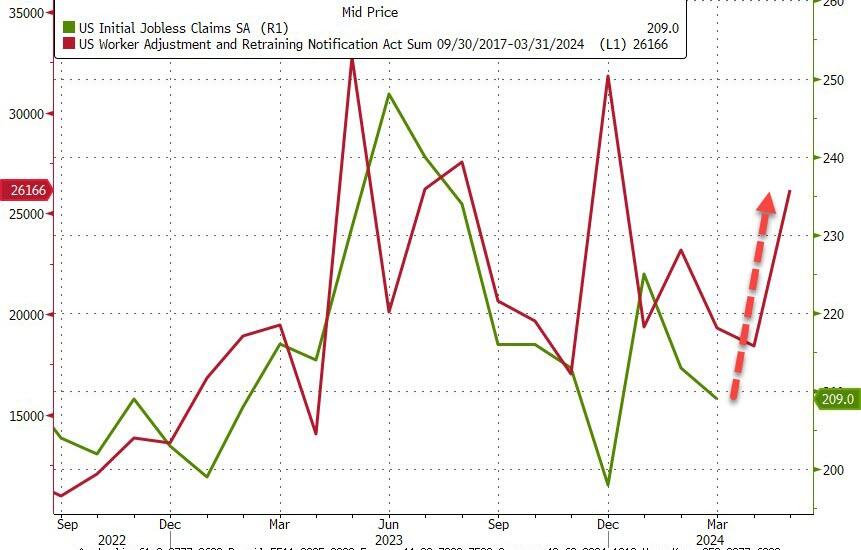
And WARN numbers are rising rapidly…
Source: Bloomberg
As a reminder, if you doubt the accuracy of the Biden admin’s data, here’s what the most recent FOMC Minutes said:
“While the recent trends prior to the meeting had been remarkably positive, Fed officials judged that some of the recent improvement “reflected idiosyncratic movements in a few series.”
Even they aren’t buying it, and neither should you!
Paul Krugman and others are cheering the defeat of inflation (odd since it is on the rise again). But how does our Federal government “grow” the economy and inflation? Borrow and spend, baby!
I still want to hear Biden (or any other elected official, Democrat or Republican) to explain to me how the US is going to honor its unfunded liabilities (Social Security, Medicare, etc) which is $664,000 PER CITIZEN. Again, this figure does not included the 8-11 million illegal immigrants who have stormed our borders under Biden. Hey, how about an entry fee for each immigrant of $664,000?
“Billions” Biden loves to spend money along with members of Congress and the Administrative State.
When Arnold Schwarzenegger was Governor California, his budget chief, a former high school pal of mine, called me to look at California’s budget. He sent me his spreadsheets with forecasts and asked me what I thought. Even back then, I called back and said “California is on an unsustainable fiscal path and seems to be committing suicide.” He agreed, but noted that Schwarzenegger would not like that conclusion. I told him to blame me for the report, as an unpaid consultant to The Golden State. But even back then, I could foresee the absolute mess that the California State legislature would make, particularly if they elected a Democrat governor.
California’s budget deficits look a lot like Biden’s (call him Newsom’s elderly intellectual grandpa) budget deficits where Biden and Congress went on a spending spree from “the honey pot” (US Treasury) and borrowed funds.
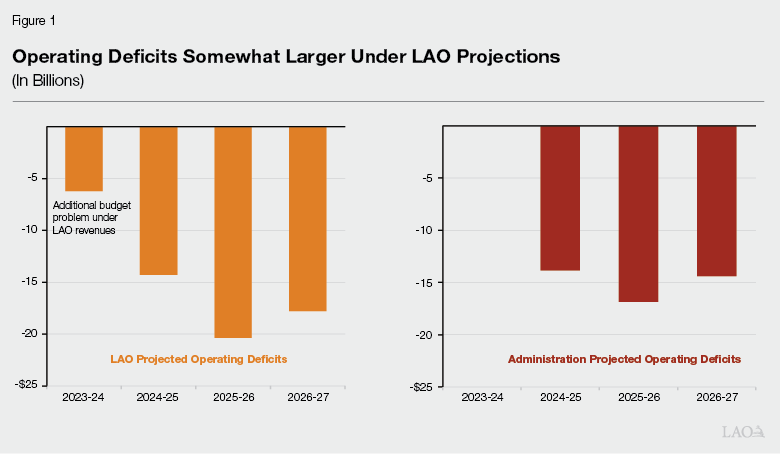
California’s budget crisis is projected to expand more than previously thought and could hit a record deficit of $73 billion, according to a new report from the state’s nonpartisan Legislative Analyst’s Office (LAO).Her
“The actual increase in the state’s budget problem will depend on a number of factors, including formula-driven spending changes, most notably Proposition 98 spending requirements for schools and community colleges,” the report said.
H.D. Palmer, the deputy director of the California Department of Finance and Newom’s spokesperson on budget matters, responded to the new LAO report by telling Fox News Digital that their budget shortfall differs from the $38 million they estimate.
“From now through April, more than $51 billion in income and corporate tax receipts are forecast to come in,” Palmer said. “No one can say today with certainty how those numbers may change the budget estimate of a $38 billion shortfall.”
“A responsible step would be for the Legislature to act now on the early action budget measures needed for $8 billion in solutions to help close this gap,” he added.
The projected bad news comes as Newsom has worked to increase his profile nationwide. It also occurred as California experienced a mass exodus.
California saw its first-ever population decline in 2020 when the state imposed rigid lockdowns during the COVID-19 pandemic. From January 2020 to July 2022, the state lost well over half a million people, with the number of residents leaving surpassing those moving in by almost 700,000.
Census data has shown that Texas is the most popular destination for residents fleeing the state, followed by Arizona, Florida, and Washington. (Of course, Arizona where I used to live has flipped from a Red state to a Blue state with immigration and Democrats are working hard to flip Texas to a Blue state. Washington, has already flipped Blue. Florida remains a Red state under Ron DeSantis).
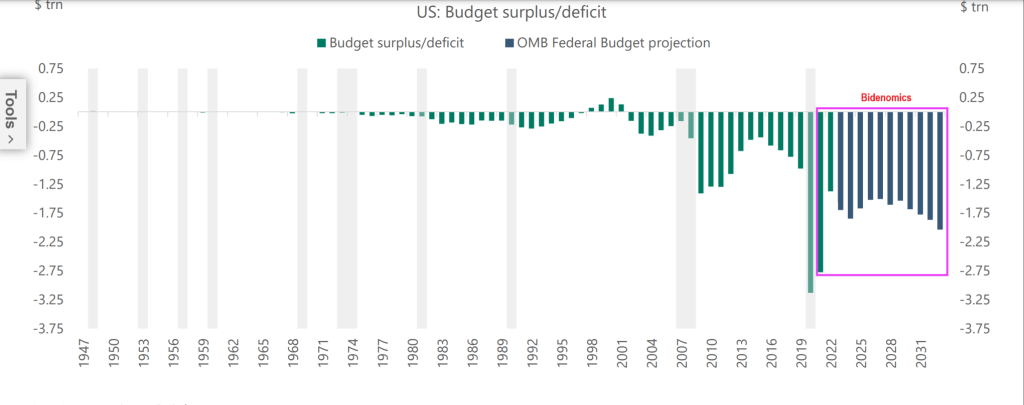
Here is Biden’s budget deficit chart under the hilariously termed “Bidenomics.” Ah, so maybe Governor Newsom is a perfect fit for the wild spenders in Washington DC.
Lest we forget, Biden/Congress can borrow endless funds and stick the bill to Gen Zers and the unborn.
And remember, US politicians have promised $213 TRILLION in unfunded payments that will require cuts (LOL!) or a massive increase in Federal debt.
Biden and Newsom could sing “Fiscal inferno” together! “Here is my demented, doddering grandfather!”
The Federal Reserve (aka, The Keep) is back in the saddle again. The Fed has been unable to control inflation since Federal government spending was so fast and furious after Covid that little thought was given to the long-term ramifications of insane spending. Not to mention The Fed’s overreaction to Covid.
Example?
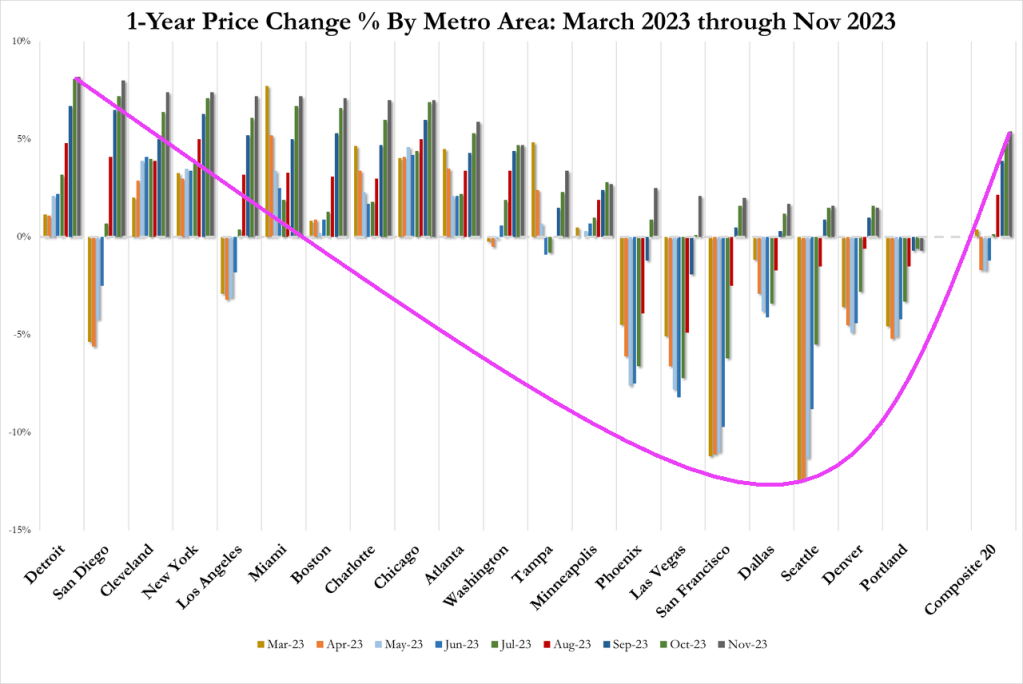
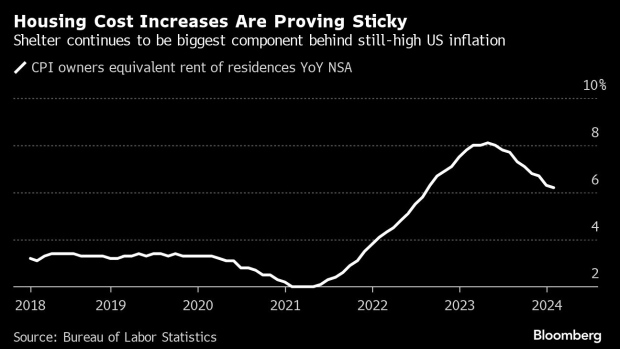
Home price growth is rising again. Home prices in traditional “bubble cities” out west were cooling, but are reaccelerating. Even Detroit and Cleveland are seeing rapid home price acceleration.
Yes, housing inflation is sticky.
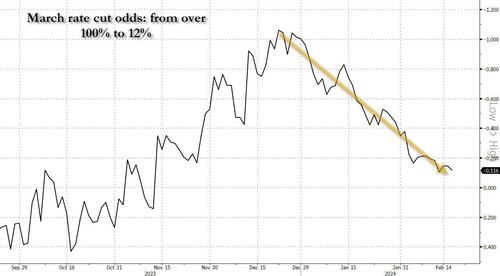
In retrospect, this wholesale dovish euphoria may have been rather short sighted, because after several strong economist reports hit the tape (with the Nov 2024 election growing closer by the day, that should hardly have been a surprise), March rate cut odds collapsed from over 100% in late December, to just 12% currently…
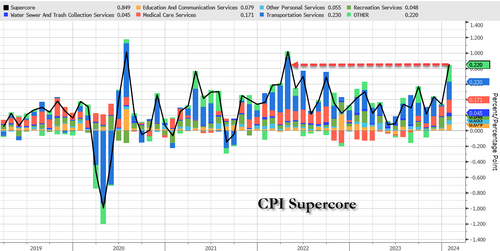
… as first the January CPI printed red blazing hot– with core coming in at 3.9% far higher than the 3.7% expected, with the 3-month annualized rate jumping to 4% from 3.3% and the 6-month annualized rate spiking to 3.7% vs 3.2%, but the biggest highlight was SuperCore CPI (i.e., core CPI services ex-Shelter) which soared 0.7% MoM, the biggest jump since Sept 2022…
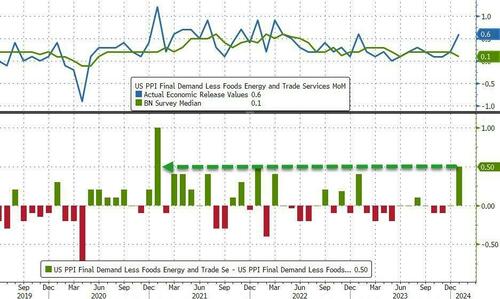
… and then the January PPI print come in even hotter, with a core component surging in January by 0.5%, smashing expectations and beating estimates by the most since Jan 2021.
The result: not only has the market rapidly priced out what if formerly saw as many as 6 rate cuts in 2024, but growing speculation that a rate cut may not come at all unless the Fed tightens some more first (and with the S&P500 now over 5000, it is pretty clear that the market has already priced in virtually all rate cuts and has cornered the Fed).
Of course, the mass migration across the Mexican border (who knows? could be up to 11 million under Biden’s Reign of Error). While Paul Krugman, the resident lunatic economist for the New York Times, extols the virtues of mass immigration for driving up GDP, fails to recognize that mass migration is helping drive up prices. This is inflation that The Fed can’t control. And Biden/Mayorkas want even MORE mass immigration.
“Progress on inflation has brightened the economic picture despite a slowdown in hiring and pay. Wages adjusted for inflation have improved over the past six months, and the economy looks like it’s headed toward a soft landing in the U.S. and globally,” says Nela Richardson, Chief Economist, ADP.
ADP National Employment Report
The ADP National Employment Report shows Private Sector Employment Increased by 107,000 Jobs in January; Annual Pay was Up 5.2%
Job Switching Payouts
Year-over-year pay gains for job-stayers reached 5.2 percent in January, down from 5.4 percent in December.
For job-changers, pay was up 7.2 percent, the smallest annual gain since May 2021.
Median Change in Annual Pay (ADP matched person sample) Job-Stayers 5.2%, Job-Changers 7.2%
ADP Notice
January’s report presents the scheduled annual revision of the ADP National Employment Report, which updates the data series to be consistent with the annual Quarterly Census of Employment and Wages (QCEW) benchmark data for March 2023. In addition, this revision introduces technical updates, namely, in re-weighting of ADP data to match QCEW data. The historical file was updated to reflect these revisions.
Notice Translation
ADP revises its data to match annual BLS data from March of 2023. The BLS will do the same in its annual revisions.
The BLS does not even back adjust the numbers so its historical record is bogus. And despite being incredibly lagging, the Fed makes key decisions on the data.
Job Openings Rise in December But Quits Tell the Real Story
There’s lots of meaningless chatter yesterday about job openings. However, actions speak louder than openings.
This report comes after Fed Chair Jerome Powell said “No Sugar Tonight” as in no expected rate cuts. That is, until it becomes obvious that Biden will lose the election, THEN The Fed will start cutting rates like crazy.
An example of the trash that Biden and Democrats are importing from Latin America, Africa and China. Among other sewers. I am sure that employers are lining up to hire this guy. … NOT! Correction: Biden may appoint this creep to his cabinet with the other losers.
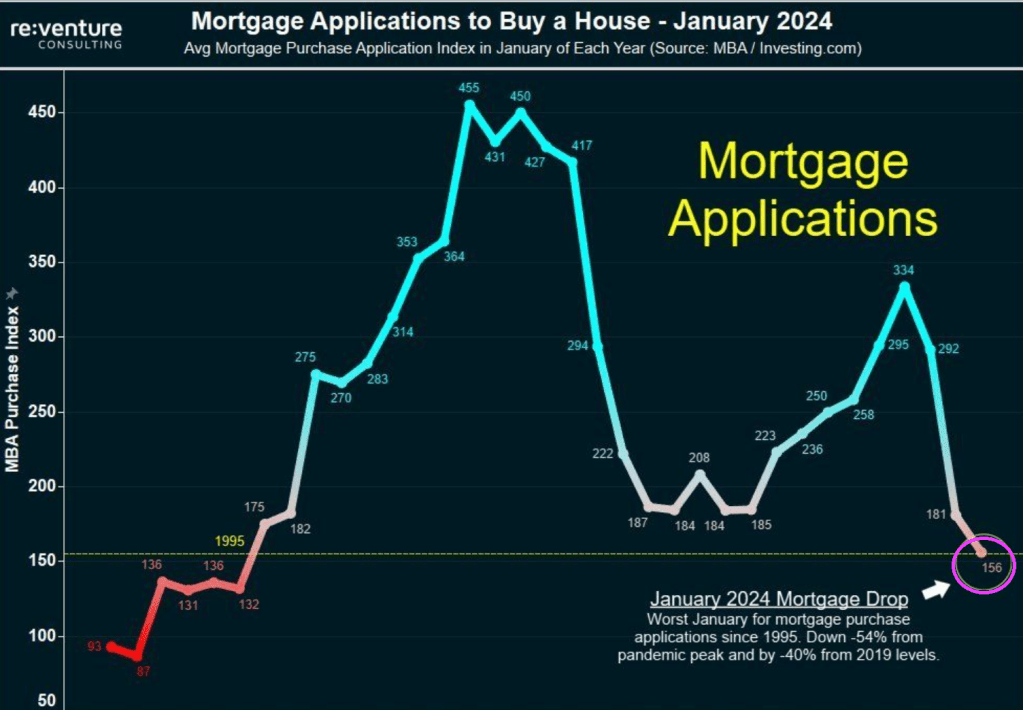
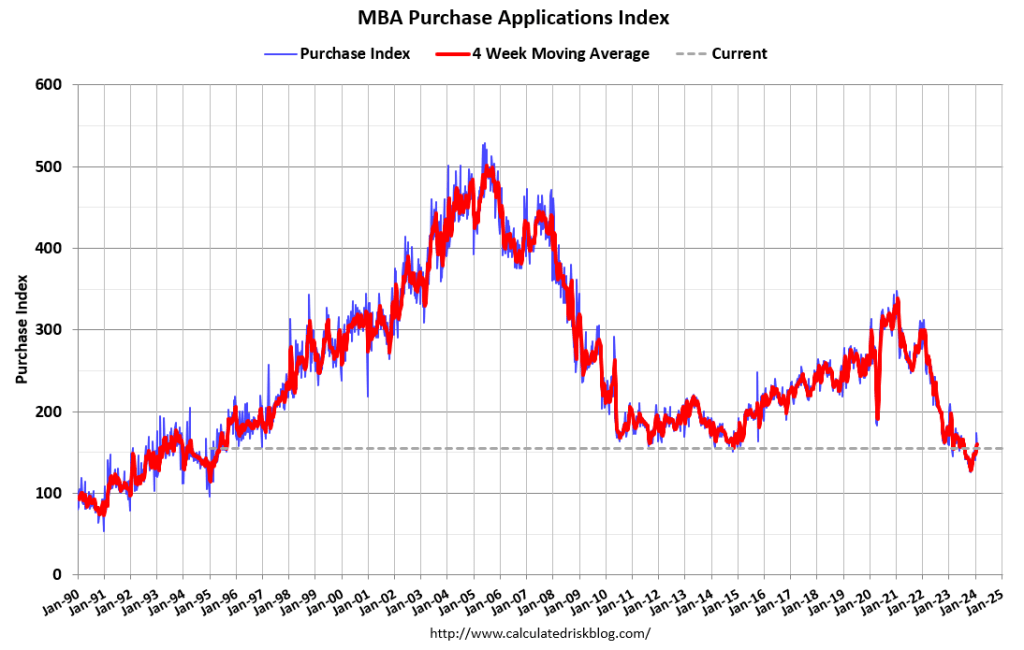
Yikes! Bidenomics is a disaster! MBA mortgage purchase applications are down 54% from Pandemic Peak. I was going to play “The Wreck of the Edmund Fitzgerald” by Gordon Lightfoot and rename it “The Wreck of The US Economy.”
Mortgage demand fell to a new 30-year low in January 2024, down 54% from the pandemic peak. Mortgage demand is down 14% over the last year and 40% from pre-pandemic levels.
Mortgage applications decreased 7.2 percent from one week earlier, according to data from the Mortgage Bankers Association’s (MBA) Weekly Mortgage Applications Survey for the week ending January 26, 2024. Last week’s results included an adjustment to account for the MLK holiday.
The Market Composite Index, a measure of mortgage loan application volume, decreased 7.2 percent on a seasonally adjusted basis from one week earlier. On an unadjusted basis, the Index increased 8 percent compared with the previous week. The Refinance Index increased 2 percent from the previous week and was 3 percent higher than the same week one year ago. The seasonally adjusted Purchase Index decreased 11 percent from one week earlier. The unadjusted Purchase Index increased 6 percent compared with the previous week and was 20 percent lower than the same week one year ago.


You must be logged in to post a comment.