The left has come out in force to attack D.O.G.E. and Elon Musk. Why? First, The Left doesn’t want to upset the candy apple cart (government waste and corruption). Second, the Left wants to pretend that they hate the rich (although George/Alexander Soros are huge donors, not to mention Bill Gates and most of Hollywood elites are billionaires/millionaires). But the saddest act of all are Joe Biden and Kamala Harris. These two clowns had the Social Security data and never looked at it … allegedly.
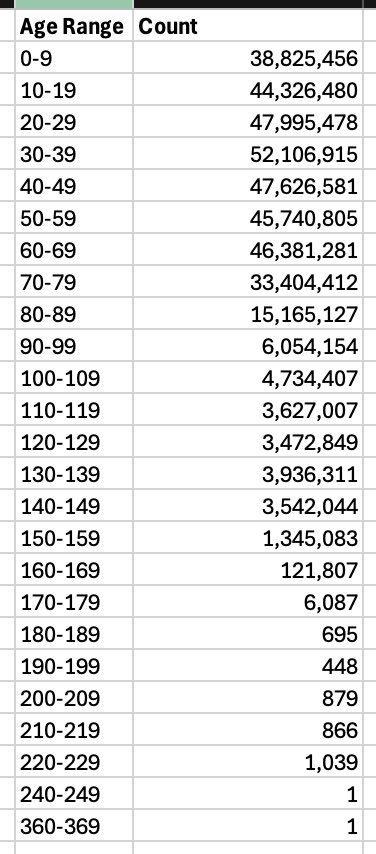
What would they have found if they had looked at the Social Security books? According to Elon Musk, they would have discovered 20,788,904 people at the age of 100 and above. That is significantly higher that the entire population of Naples Florida at 19,704.
Here is what Elon Musk discovered about people receiving Social Security (and disability payments). Joe and Kamala didnt notice someone that was between 360 and 369 years of age??
The point is that this is a collosal embarrasment. And epic fraud. And even more vexxing is that 394,943,364 are collecting Social Security while the total population of the USA is 334 Million?? That leaves 60 million more people receiving Social Security payments than there are people in the USA!
Don’t tell Elon about candied apples that have replaced government cheese in the Federal government giveaway program for votes!And Cloward/Piven!
We are living in the USA where corruption, favoritism, open borders and an out-of-control Federal budget and debt are destroying this once great nation.
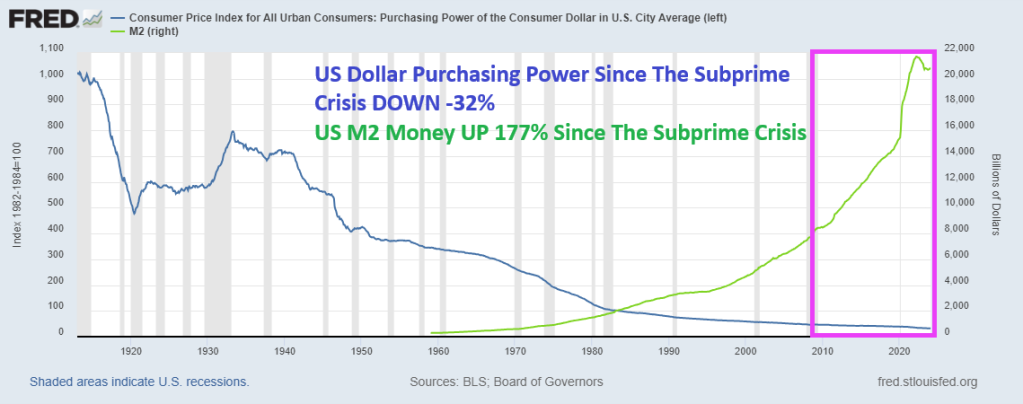
Former Kansas City Fed President Thomas M. Hoenig was absolutely right when he said recently that The Federal Reserve panders to Wall Street, Congress and special interest groups, prioritizing immediate relief over financial stability. Bernanke’s zero-interest rate policies (ZIRP) and Quantitative Easing (QE) were short-term fixes that never went away. Indeed, since the subprime mortgage crisis of 2008-2009, US Dollar purchasing power is DOWN -32% and M2 Money is up a staggering 177%. While Yellen stuck with zero-interest policies until Trump was elected, then raised The Fed Funds Target Rate 8 times. Yellen only raised the target rate once under Obama. Clearly playing political favoritism.
The Federal Reserve’s lack of transparency comes amidst reports that countries are removing their gold and other assets from the U.S. in the wake of the unprecedented Western sanctions imposed on Russia over its invasion of Ukraine. According to a 2023 Invesco survey, a “substantial percentage” of central banks expressed concern about how the U.S. and its allies froze nearly half of Russia’s $650 billion gold and forex reserves.Headline USA filed a FOIA request with the Fed for records reflecting how much gold the Federal Reserve Bank of New York currently holds in its vault, as well as records reflecting the ownership stake that each of FRBNY’s central bank/government clients have in that gold. The FOIA request also sought records about the Fed’s gold holdings prior to Russia’s February 2022 invasion of Ukraine. However, the Federal Reserve denied the FOIA request on Wednesday.
It influences the price of nearly everything, as well as the availability of jobs, the stability of our banking system, and the purchasing power of our money.
When the Fed Chair speaks, the entire world stops to listen.
But the average person has a poor understanding of how this colossally important entity operates. Or even why it exists.
And after a series of asset price bubbles — which some argue we’re in another one now — a chorus skeptical of the Fed’s actions has emerged.
So today we’re doing our best to shine as bright a light as possible on the Fed: how & why it operates, the good & as well as the shortcomings of its actions to date, what direction its policies are likely to take from here, and how all of this impacts the households of regular people like you and me.
Here are my top takeaways from from a speech by former KC Fed President Thomas Hoenig:
Dr Hoenig admits the Federal Reserve has experienced substantial “mission creep” since its creation as a lender of last resort. Its track record is very much “mixed” in terms of delivering on the intent of its policies. In Dr. Hoenig’s opinion, its efforts to add stability sometimes instead only create more instability.
While very critical of the Fed’s QE and ZIRP policies in the wake of the GFC, and more recently in the $trillions in monetary & fiscal stimulus unleashed post-COVID, Dr Hoenig thinks current Fed policy is “about right”. Though he expects the Fed to come under serious pressure soon as ebbing liquidity allows recessionary forces to build. He thinks the Fed will need to make an important decision within the coming year: return to QE and re-flame inflation, or allow a recession to occur.
Dr Hoenig criticizes the Federal Reserve for pandering to various interests, noting that short-term thinking and pressures from Wall Street, Congress, and interest groups often lead to decisions that prioritize immediate relief over long-term stability — a sort of “We’ll act now for optics sake and hopefully figure things out later”
In Dr Hoenig’s opinion, our fiscal policy is a runaway disaster. He criticizes both political parties of Congress for their roles in the cycle of ever-increasing deficits. Democrats advocate increased spending and tax hikes, while Republicans aim to keep taxes low but fail to curb spending. He warns of dire long-term consequences for future generations due to this impasse.
Dr Hoenig is very worried about the current stability of the banking system (and this from a former Direct of the FDIC!). He advocates for essential reforms to address government spending, prioritize essential areas without relying on future borrowed funds or inflationary measures, and communicate transparently with the public. He stresses the importance of reducing debt growth substantially below national income growth to avoid a full-blown crisis scenario in the future.
Dr Hoenig predicts the purchasing power of the US dollar (and other world fiat currencies) will continue to decline due to current policies and the lack of a “discipline” to money creation. Until such a discipline is restored (perhaps a return to some sort of hard backing of the currency), the dollar’s fall in purchasing power won’t abate.
Dr Hoenig suggests investing time in reading history and biographies as a valuable way to learn about leadership and gain insights into what strategies works and which don’t.
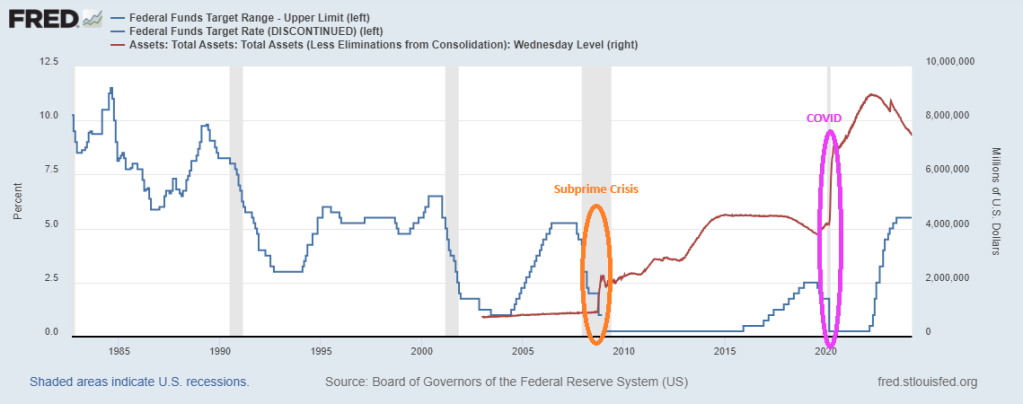
Here is the “Sound Money Parade” in 1896. By the aftermath of the subprime crisis, Janet Yellen (1993-2020) adopted the UNSOUND Money Fest, an orgy of printing and charging near zero interest rates. Powell in 2021 is ever-so-slowly unwinding The Fed’s balance sheet, but Powell has raised The Target Rate to its highest level since 1998 to fight inflation caused by Biden’s policies.
Combine The Fed not telling us how much gold they hold and their overprinting problems since 2008, and you can see why investors are turning to gold and silver and crypto currencies. The adoption of Central Bank Digital Currency (CBDC) is a step towards financial collapse.
Here is a parade you will NEVER see in Washington DC. A Sound Money Parade!
Powell is beginning to act like a sound money fan, but he still is taking his sweet time shriking the balance sheet.
I am thinking of fleeing to Lilliehammer Normay like Frank Tagliano.
Happy Easter! I mean Happy TRADITIONAL Easter, not a Biden weird trans celebration.
Biden and Congress (Schumer, Johnson, McConnell, etc) spend and borrow like its cottage cheese.
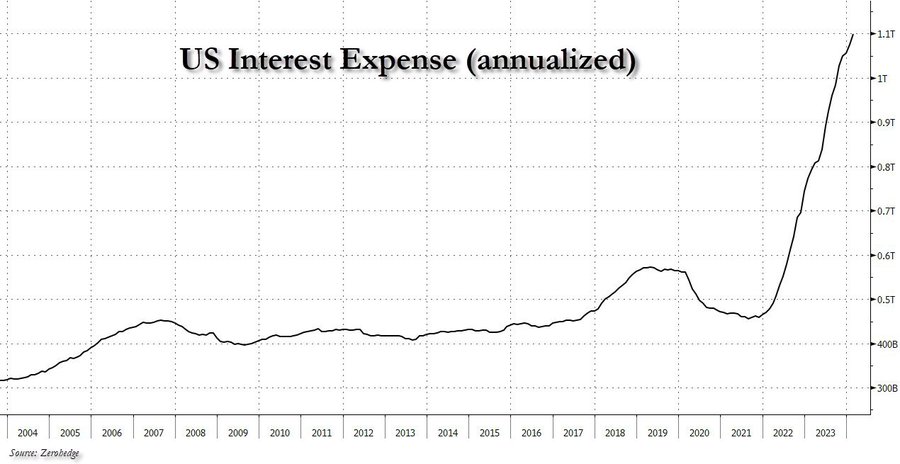
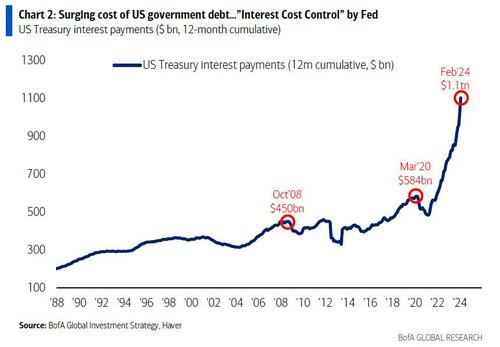
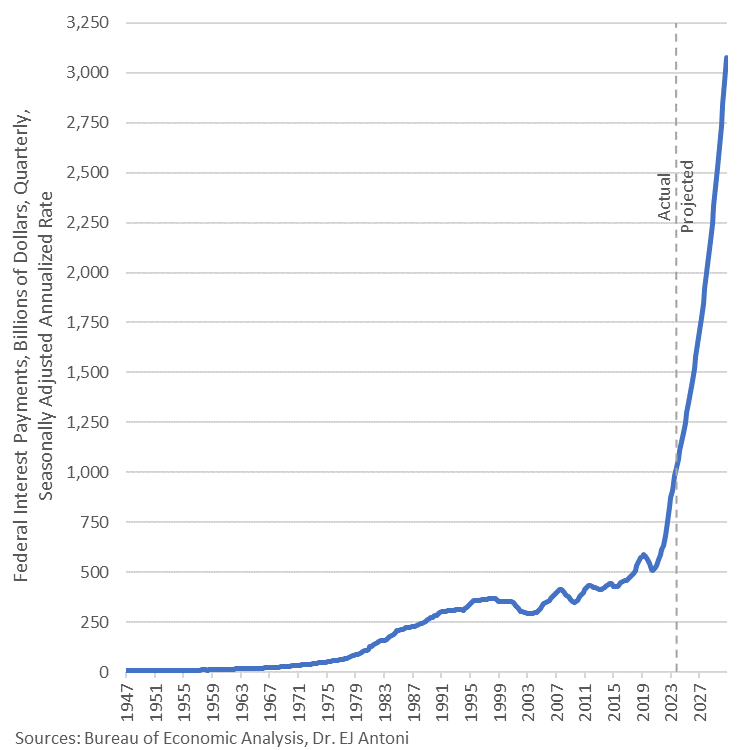
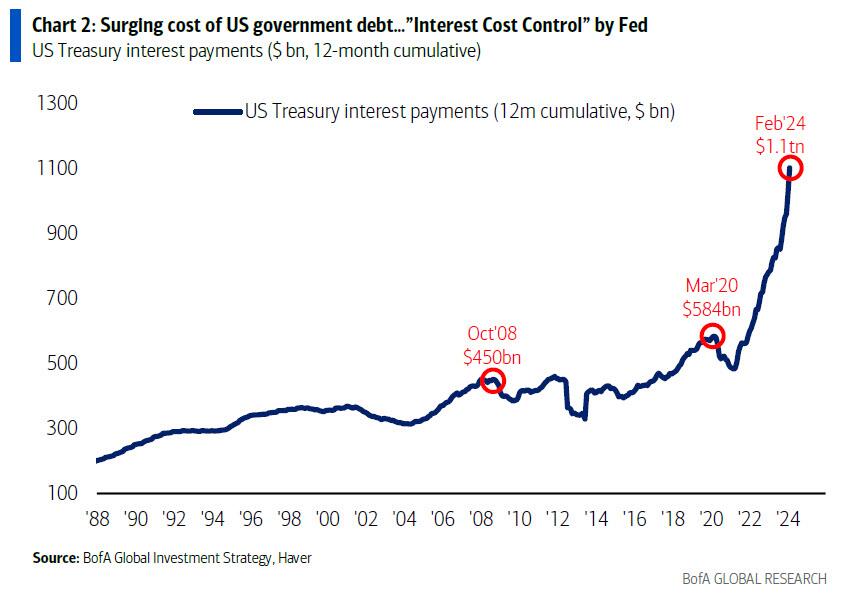
After hitting $1 trillion in late 2023, interest expense on US debt rose to a record $1.1 trillion in late March, and ii) while US debt is now rising at a pace of $1 trillion every 3 months, US interest expense is rising at a just as torrid $100 billion every 4 months (this interval will also shrink to three months very soon).
he Biggest Picture: $1.1tn in interest payments on US government debt past 12 months, doubled since COVID (Chart 2); trend in govt spending (up 9% YoY) & debt (up $1.0tn every 100 days)…big motivation for Fed to cut rates to constrain surge in interest costs (“ICC” or Interest Cost Control policy)… bear in bonds (if no recession), steeper yield curve, weaker US$, higher commodities/gold/crypto & TINA for stocks.
Of course, since Hartnett is one of those good strategists where one fact opens up a cascade of downstream observations, that’s precisely what happened this time and he fills out the balance of his latest report (available to pro subscribers in the usual place) with his tongue-in-cheek notes on why the US is on a doomsday date with a debtdisaster, starting with why being a “dove means never having to say you’re sorry”:
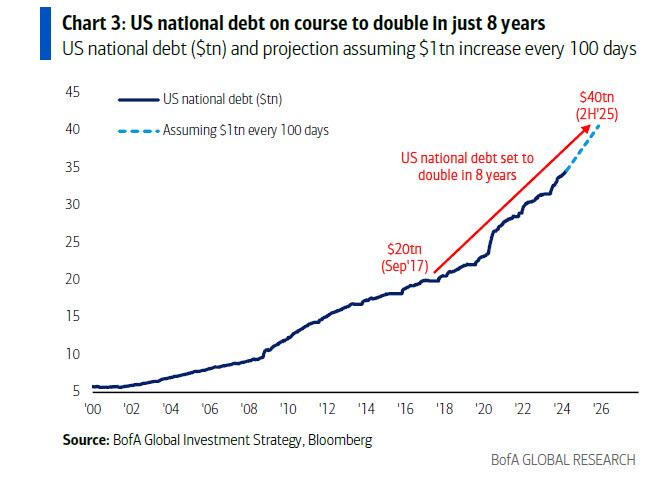
US government spending past 5 months = $2.7tn, up 9% YoY… on course for $6.7tn in FY24; US national debt rising $1tn every 100 days…set to hit $35tn in May’24, $37tn by US election, $40tn in H2’25 (doubling in 8 years); spending up, deficits up (9% of GDP average past 4 years), debt up -> interest payments up = $1.1tn in past 12 months & set to rise by $150bn in next 100 days[ZH: this sounds familiar]
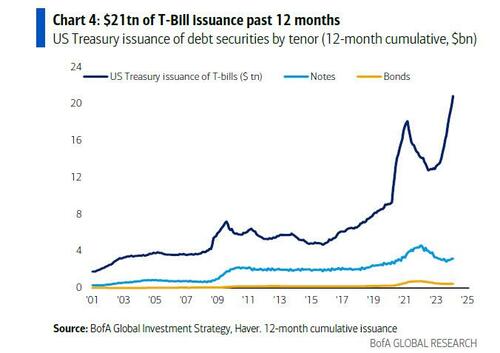
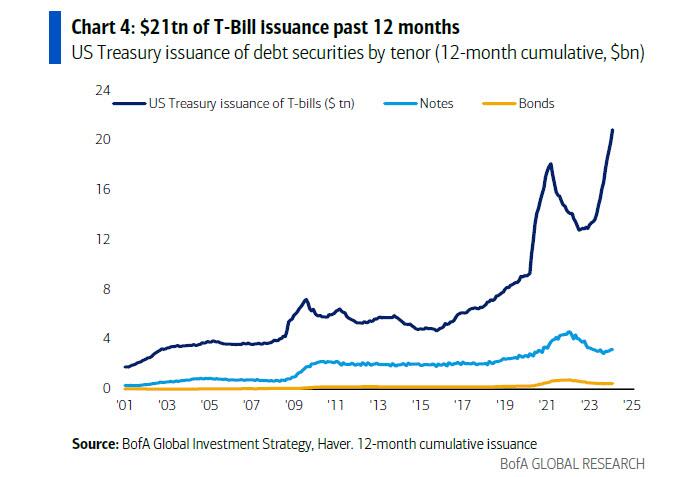
US Treasury has aggressively shifted refunding toward <1-year T-Bills ($21tn issuance past 12 months), lowering maturity of debt to ≈5 years, increasing sensitivity to short rates, incentivizing Fed to cut rates;
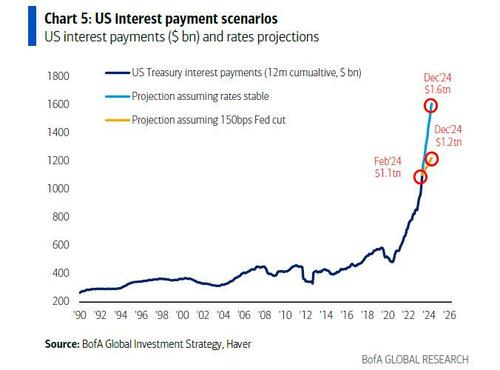
And the punchline: Hartnett takes our observations, and expands them to their logical, if absurd, extreme (which ironically takes places in just 9 months) to find that US annual interest costs are set to jump from $1.1 trillion to $1.6 trillion, which is a big deal…
Unchanged rates/yields & debt trend next 12 months & US refinancing rate is 4.4% & annual interest costs jump from $1.1tn to $1.6tn (Chart 5); in contrast 150bps of Fed cuts next 12 months and average refi rate is 3.2%, stabilizing/constraining interest payments to $1.2-1.3tn over next 2 years; call it “ICC”/Interest Cost Control but Fed must placate fiscal excess coming quarters…bear in bonds (if no recession), steeper yield curve, weaker US$, higher commodities/gold/crypto & TINA for stocks.
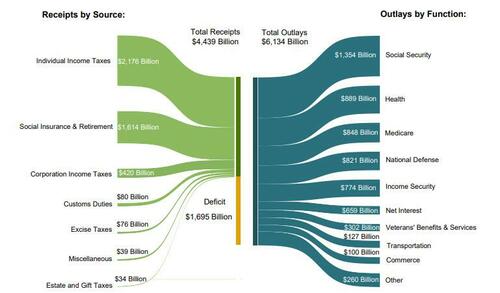
… because if the Fed does not cut rate by 150bps (as it may in an “ICC” scenario) should inflation prove to be sticky (something which Putin clearly has figured out realizing the fate of Biden’s re-election is in his oily hands), and total interest does rise to $1.6 trillion by year-end, that it will become the single biggest US government outlay by the end of the fiscal year; as a reminder, in fiscal 2023, Social Security spending was $1.354 trillion, Health was $889 billion, Medicare $848 and national defense, a paltry (by comparison) $821 billion.
Stepping briefly away from the looming US debt disaster, Hartnett makes three more observations on the current state of the market:
Tech regulation getting noisier: DoJ vs Apple antitrust lawsuit, FTC vs Amazon antitrust lawsuit, FTC inquiry into AI deals of Amazon, Google, Microsoft; EU investigation into Apple, Meta, Google breach of Digital Markets Act; EU $2bn Apple antitrust fine, Japan FTC Apple & Google antitrust complaint et al…
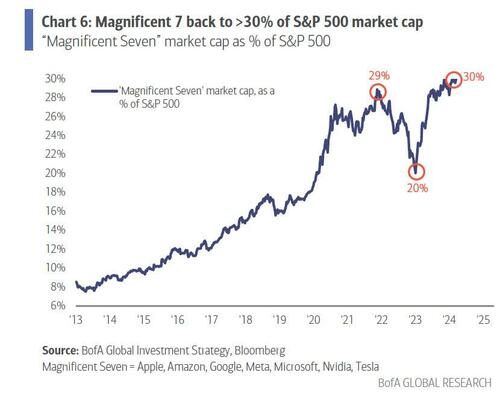
“Magnificent 7” = 30% of SPX index & 60% of SPX gains past 12 months…investors love big tech “moats”, monopolistic ability to protect margins, market share, pricing power, finance & control AI arms race; but ≈$2tn of Magnificent 7 revenues past 12 months tempting target for regulators/governments struggling to pay bills;
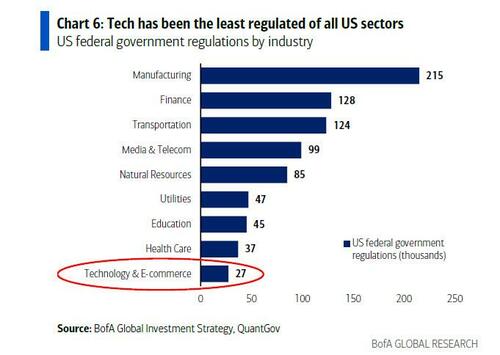
Note tech historically the least regulated of sectors (the chart below uses data from 2017) and in past 12 months average tax rate of “Magnificent 7” was 15% vs 21% for rest of S&P 500… and regulation & rates the historic way sector bulls & bubbles end.
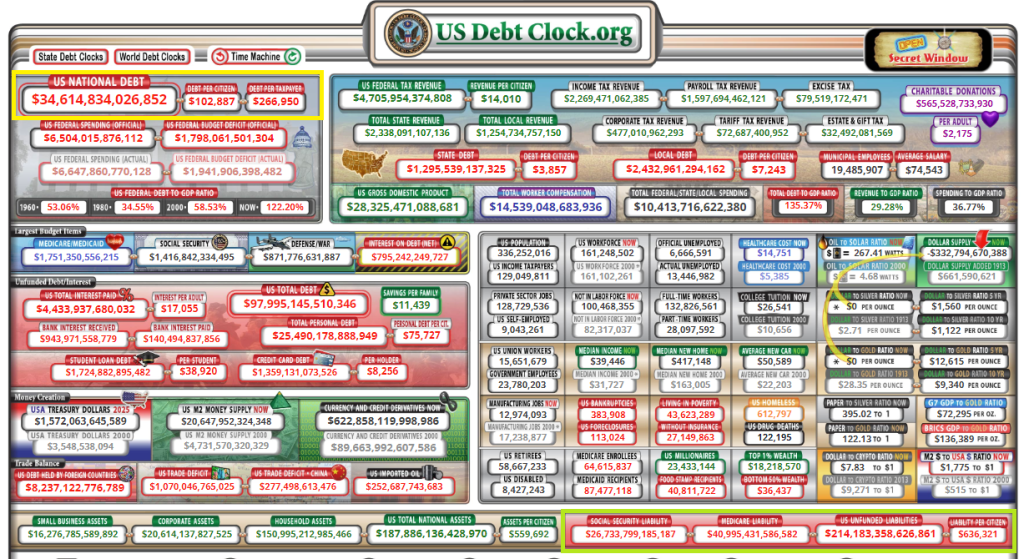
Now for the REALLY bad news. Unfunded liabilities (entitlements) have hit $214+ TRILLION. Given how voters hate paying more in taxes, look for the growing entitlements to add AT LEAST $214 trillion in NEW DEBT which will result in record high interest payments.
Hey big spender! How about NOT spending trilliions while pocketing 10% from foreign enemies?
Congress and The Biden Regime should select the now defunct British beer Watney’s Red Barrell (a truly awful beer) to symbolize their committment (or lack thereof) to fiscal responsibilty.
The Hollies said it best: Stop, stop, stop. FIAT Money Printing that is.
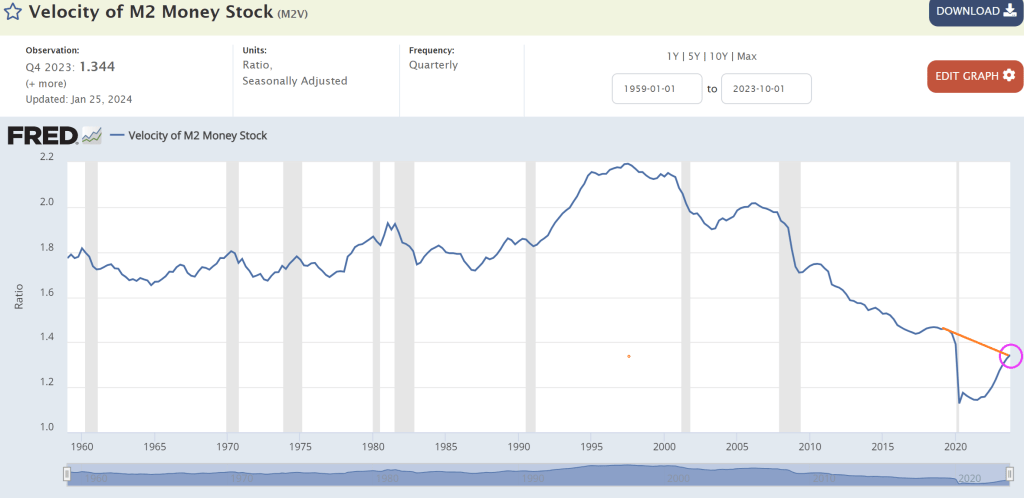
Typically, we look at M2 Money Velocity (GDP/M2) as a measure of how much the economy grows by expanding the money supply.
M2 Money Velocity is currently at 1.344, and still below where we were under Trump prior to Covid. After Powell printing palooza after Covid, M2 Money Velocity collapsed and is slowly rising, but remains low by historic standards.
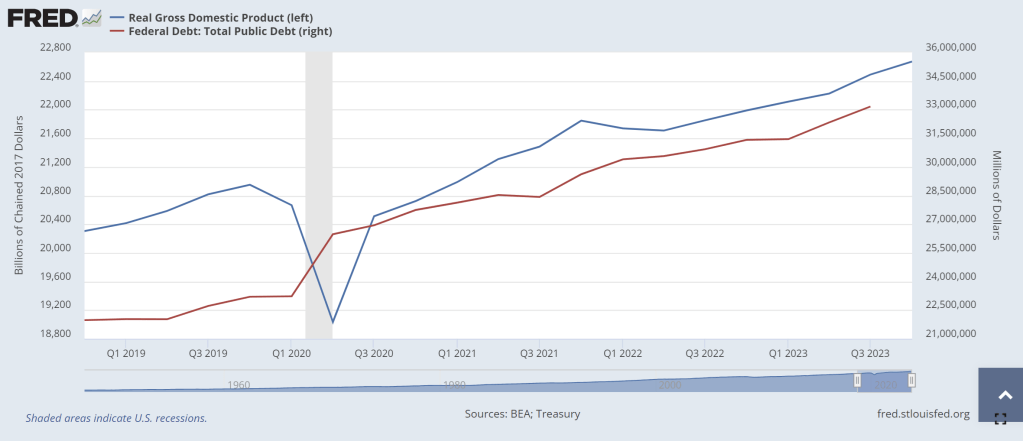
Perhaps a more interest velocity is DEBT velocity (GDP/DEBT). Under Biden’s Reign of Error, Federal debt has increased by $6,539,359 million while real GDP has increased by only $1,948.731 billion (or roughly $2 trillion in GDP growth after $6.54 trillion in debt). Or a DEBT velocity of 0.3. Yikes! No wonder China is bailing on US debt!
This chart makes debt issuance look better than it really is. Again, the DEBT VELOCITY of 0.3 is terrible meaning that for every $1 of Federal debt, we get 30 cents in Real GDP under Biden. One of my macroeconomics textbooks stated that debt growth is fine as long as real GDP growth rises faster than debt growth. Apparently, Treasury Secretary Janet Yellen didn’t read that textbook! Real GDP has grown by 9.43% under Biden while Federal debt has grown by … gulp .. 24%.
Yes, the US is borrowing like the proverbial drunken sailor while they “invest” in green energy, wars in Ukraine and the Middle East, and massive social welfare programs (like the old breads and circuses from the dying Roman Empire). When watching the media’s obsession with Taylor Swift and Chief’s Tight End Travis Kelce at The Super Bowl, it reminded me of “Breads and Circuses” as our nation is collapsing like a dying star. (That is why I Iike Gold, Silver and Bitcoin!)
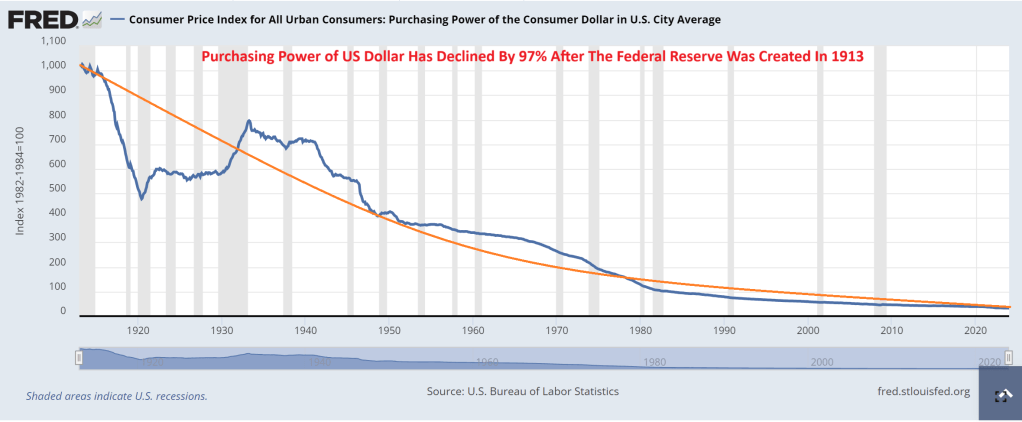
What about The Federal Reserve? It was created in 1913 after signed into existence by President Woodrow Wilson. Since The Fed’s inception, consumer purchasing power has declined by 97%.
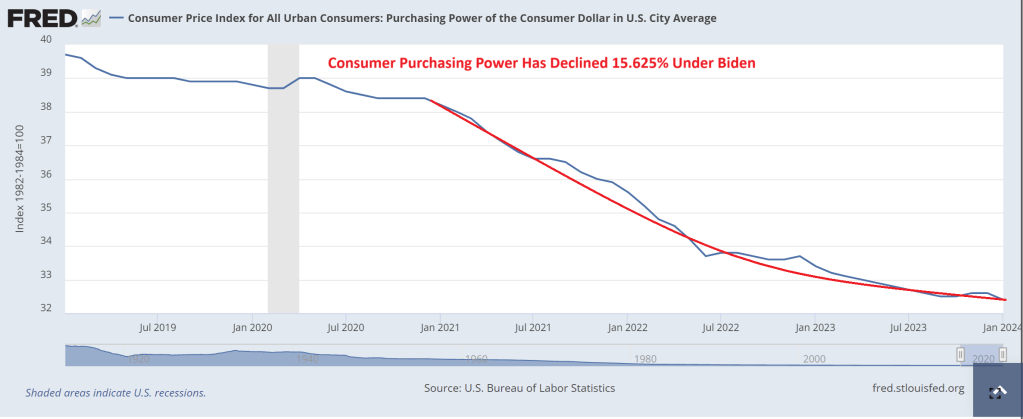
And under Biden, inflation has been so bad that consumer purchasing power is down 16%.
In summary, The Federal Reserve has been printing like crazy (I would say Batshit Crazy, but I actually think bats are adorable). And Treasury (under former Fed Chair Janet Yellen) has been borrowing like crazy too. While politicians claim the economy is in great shape, it is really because The Fed is printing wildly, Yellen is borrowing wildly, and much of US GDP is not due to the private sector, but Federal government spending … to the donor class. This is NOT a sustainable and will eventually crash into a ravine.
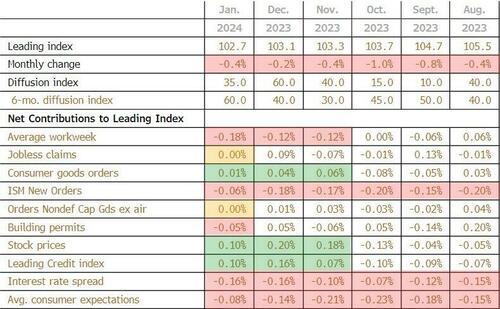
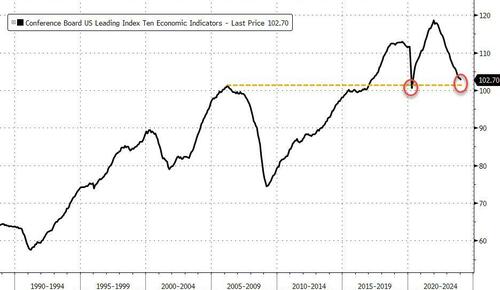
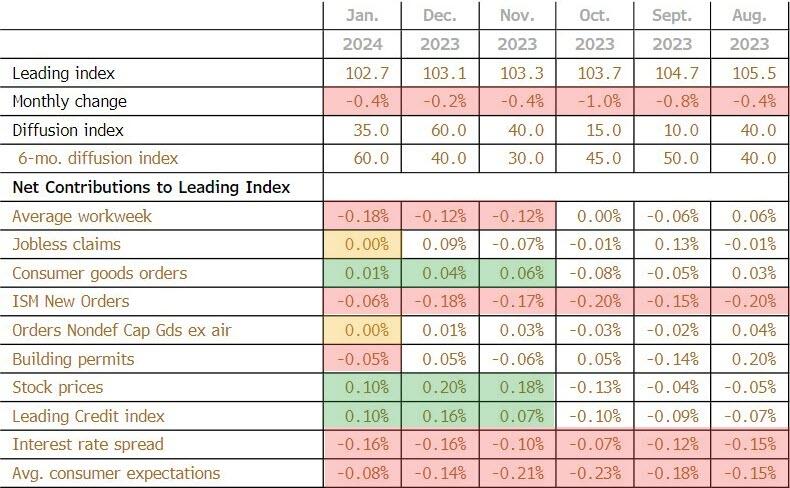
The biggest positive contributor to the leading index was stock prices (again)at +0.10
The biggest negative contributor was average workweek at -0.18
This is the 22nd straight MoM decline in the LEI (and 23rd month of 25) – equaling the longest streak of declines since ‘Lehman’ (22 straight months of declines from June 2007 to April 2008)
“While the declining LEI continues to signal headwinds to economic activity, for the first time in the past two years, six out of its ten components were positive contributors over the past six-month period (ending in January 2024).
As a result, the leading index currently does not signal recession ahead.
While no longer forecasting a recession in 2024, we do expect real GDP growth to slow to near zero percent over Q2 and Q3.”
While the Conference Board seems optimistic, we are struggling to see any signs of hope! tumbling back below the peak in March 2006…
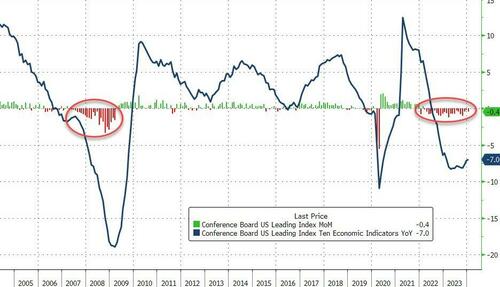
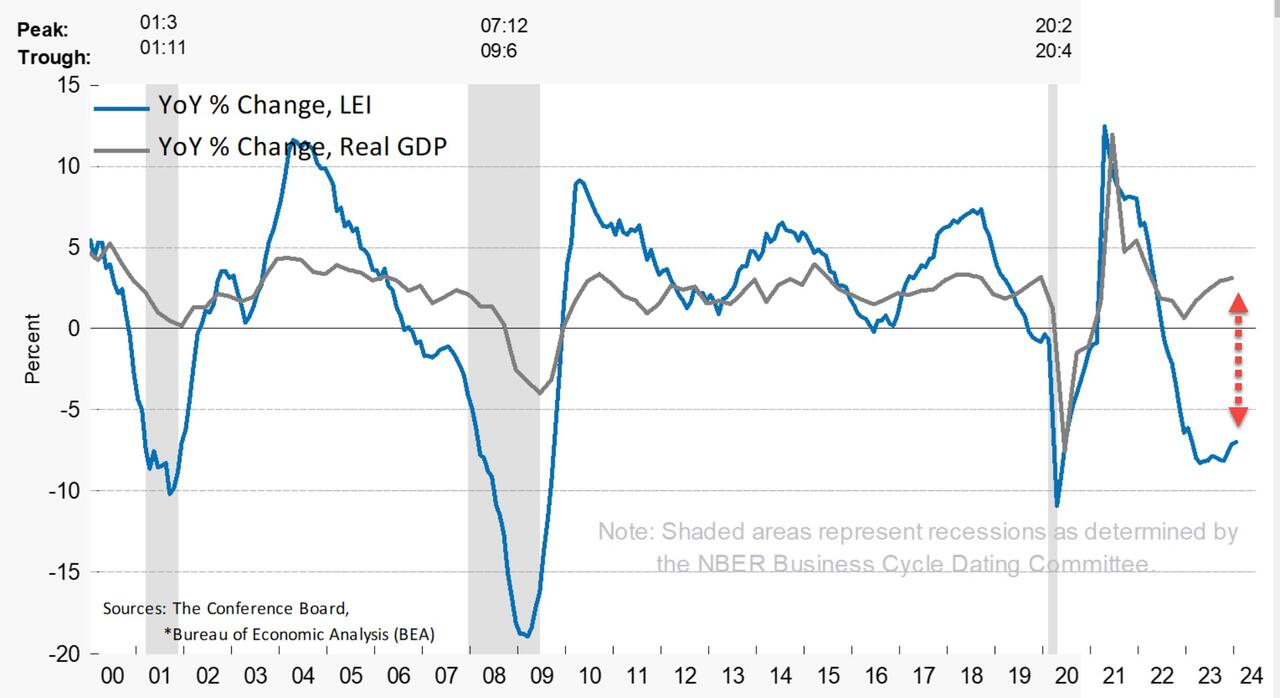
And on a year-over-year basis, the LEI is down 7.0% (down YoY for 19 straight months) – still close to its biggest YoY drop since 2008 (Lehman) outside of the COVID lockdown-enforced collapse (but starting to inflect)…
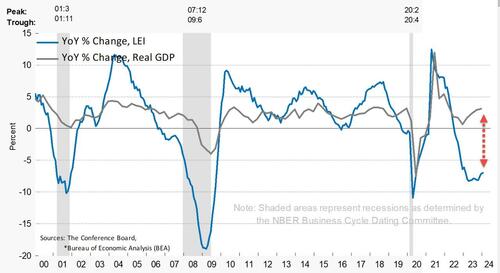
The annual growth rate of the LEI remains deeply negative and decoupled from Real GDP…..
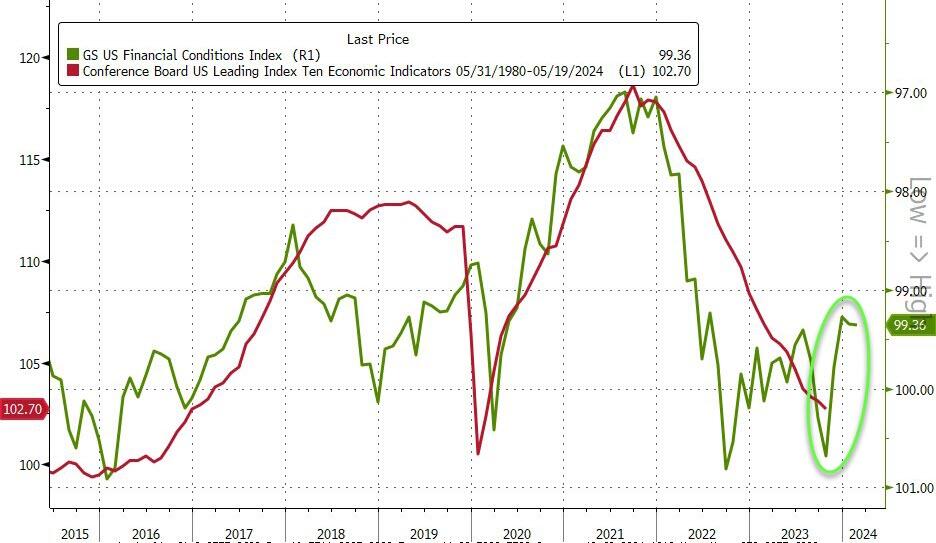
Finally, the massive easing of financial conditions in the last few months suggests a turn in LEI is imminent…
And hence the ‘soft landing’ mission is accomplished… so no need for rate-cuts? (Except for the banking crisis that looms in March).
This headline from Zero Hedge makes me so glad I have eaten heart-healthy Quaker Oats and Cheerios every morning for the last 20 years! Study Finds 80% Of Americans Exposed To Fertility-Lowering Chemicals In Cheerios, Quaker Oats. The chemical (chlormequat chloride) was detected in “92 percent of oat-based foods purchased in May 2023, including Quaker Oats and Cheerios.” But that was nothing compared to this Zero Hedge headline: EU “Suicide Pact” Threatens To Flood Continent With 75 Million More Migrants. Makes me wonder if Biden/Mayorkas are under orders from the UN/WEF/Soros to let immigrants pour across our southern border (including 20,000+ Chinese military age males). But back to the economy.
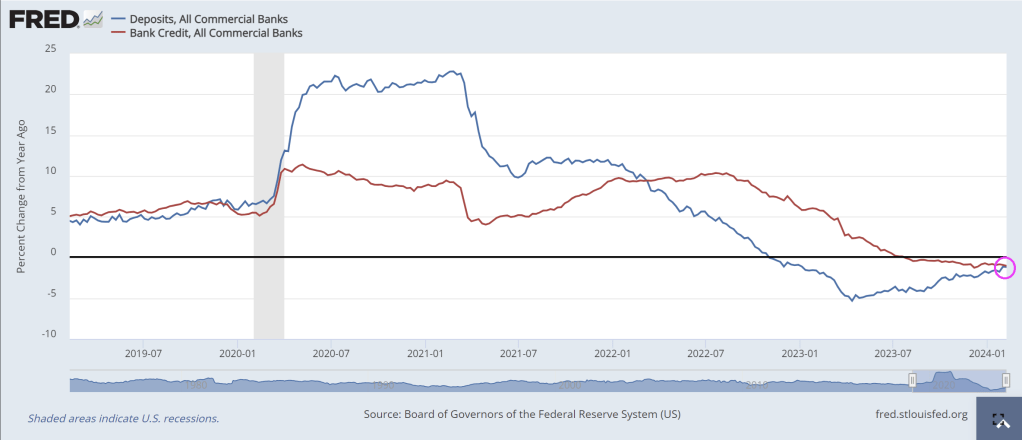
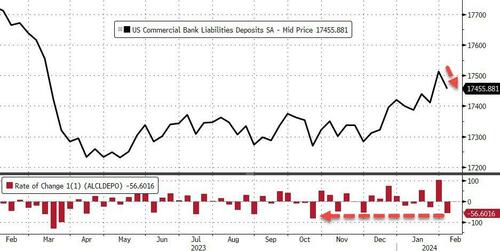
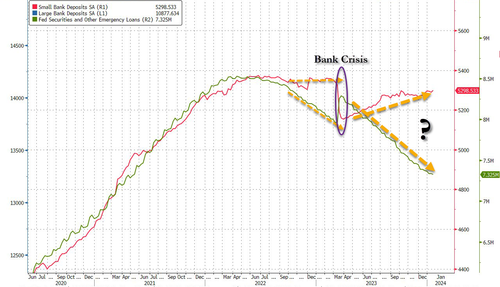
Both bank credit growth year-over-year (YoY) and bank deposit growth (YoY) are NEGATIVE. Covid resulted in massive Federal government stimulus spending (and Federal Reserve hyper stimulus) in 2020, but as the stimulus wears out, so does bank lending and deposits.
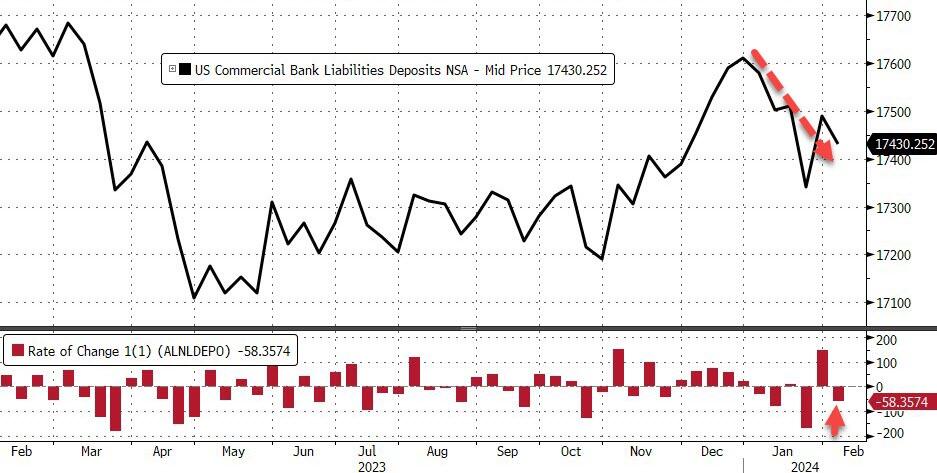
And after the prior week’s miraculous surge in deposits (again, according to The Fed), last week saw total bank deposits (seasonally-adjusted) drop $57BN – the biggest weekly drop since October…
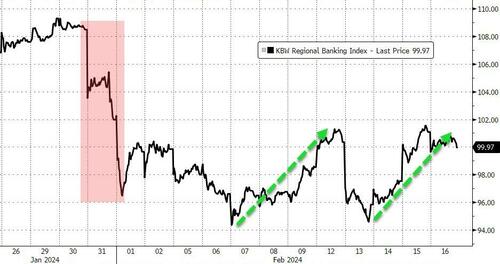
This data is from the week when Regional bank shares shit the bed thanks to NYCB…
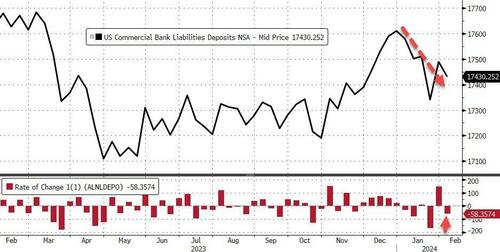
Interestingly, on a non-seasonally-adjusted basis, total bank deposits declined about the same as SA -$58BN (and are down $180BN YTD)…
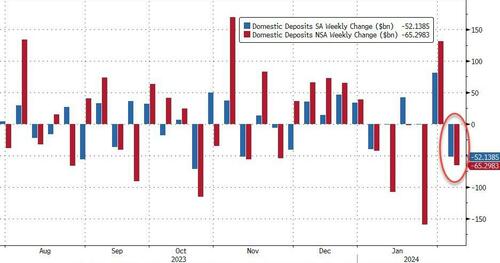
And, excluding foreign banks, domestic deposits dropped $52BN SA (Large Banks -$40BN, Small Banks -$12BN), and tumbled $65BN NSA (Large Banks -$57BN, Small Banks -$$8BN)
As the chart above shows, on an NSA basis, domestic banks have only seen one week of inflows in 2024.
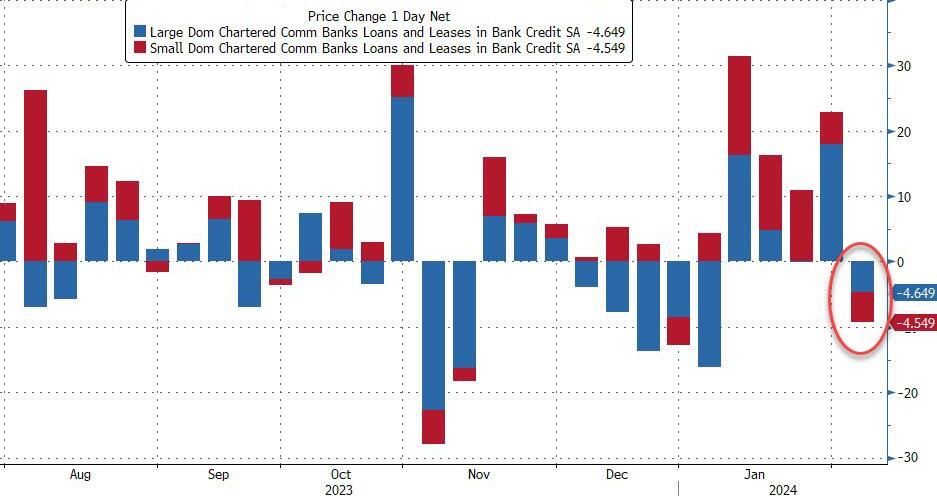
As one might expect, loan volumes shrank during that week by just over $9BN (Large banks -$4.6BN, Small banks -$4.4BN)…
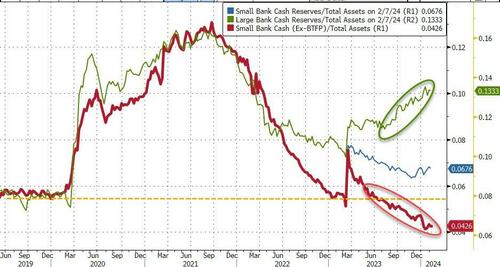
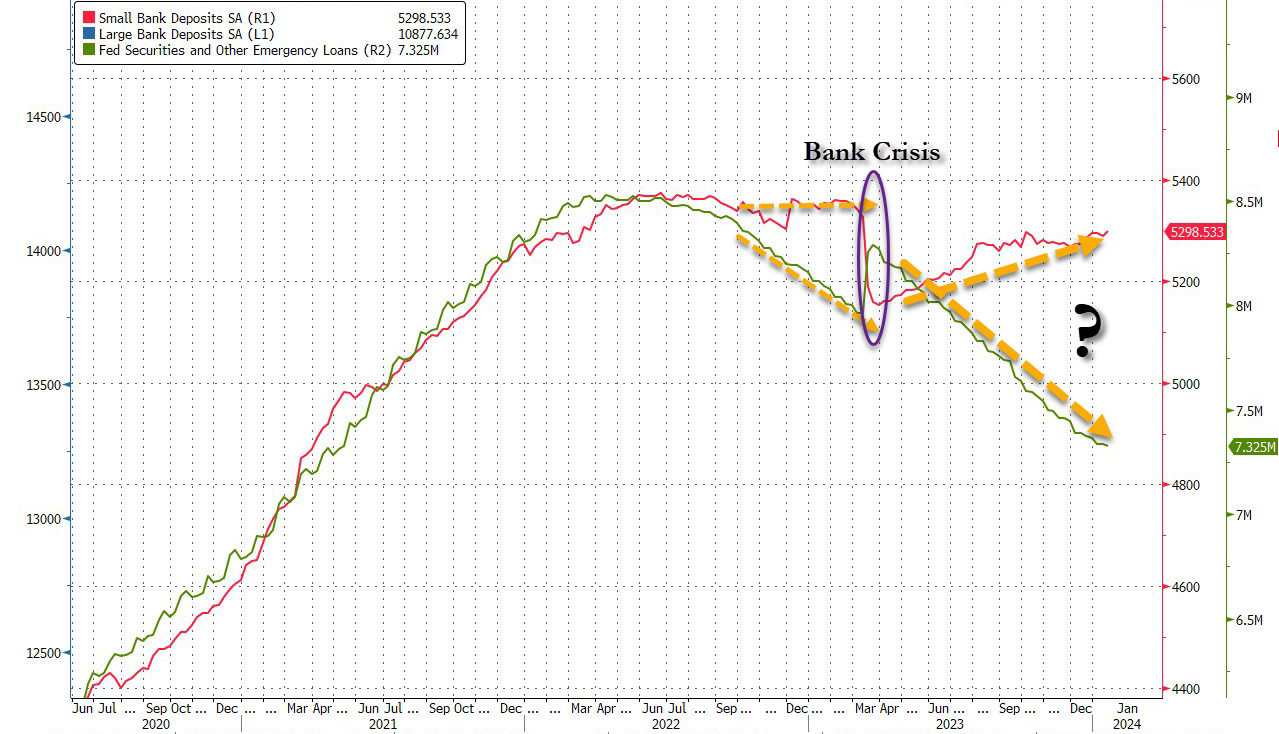
And finally, as a reminder – despite the rebound off the lows again this week in regional bank shares, which must mean everything is awesome, right? – the regional bank crisis is still very much alive as evidenced by the red line below (without The Fed’s imminently expiring BTFP facility)…
…what else are big banks (green line) going to do with all that cash burning a hole in their pockets?
The bottom line is – this looks a lot like a ‘Small Bank’ crisis. The last time this happened, the crisis sparked a sudden $300BN ‘run’ in small bank deposits…
Is The Fed ‘hoping’ for a controlled bank-run this time – so as many small bank deposits are drained voluntarily, before they are drained all at once in a panic (and the Reverse Repo facility is empty, unable to provide any cushion)?
It is looking like a recession in mid-2024 as Covid Stimulypto has run its course. Is the US economy so lame that is requires constant Federal government and Federal Reserve manipulation??
Joe Biden (President of the top 1% of Americans) and his likely replacement “Greasy Gavin” Newsom, wrecker of the California economy. Two economy wreckers on the same stage.
Remember when Democrats were the party of the working man and Republicans (like George HW Bush) were called “Country Club Republicans”? Now Biden and Democrats represent the elitist top 1% of wealth and Trump/Republicans (that Biden snidely calls “Maga Republicans”) represent the bottom 99%. Who woulda thunk??
“Progress on inflation has brightened the economic picture despite a slowdown in hiring and pay. Wages adjusted for inflation have improved over the past six months, and the economy looks like it’s headed toward a soft landing in the U.S. and globally,” says Nela Richardson, Chief Economist, ADP.
ADP National Employment Report
The ADP National Employment Report shows Private Sector Employment Increased by 107,000 Jobs in January; Annual Pay was Up 5.2%
Job Switching Payouts
Year-over-year pay gains for job-stayers reached 5.2 percent in January, down from 5.4 percent in December.
For job-changers, pay was up 7.2 percent, the smallest annual gain since May 2021.
Median Change in Annual Pay (ADP matched person sample) Job-Stayers 5.2%, Job-Changers 7.2%
ADP Notice
January’s report presents the scheduled annual revision of the ADP National Employment Report, which updates the data series to be consistent with the annual Quarterly Census of Employment and Wages (QCEW) benchmark data for March 2023. In addition, this revision introduces technical updates, namely, in re-weighting of ADP data to match QCEW data. The historical file was updated to reflect these revisions.
Notice Translation
ADP revises its data to match annual BLS data from March of 2023. The BLS will do the same in its annual revisions.
The BLS does not even back adjust the numbers so its historical record is bogus. And despite being incredibly lagging, the Fed makes key decisions on the data.
Job Openings Rise in December But Quits Tell the Real Story
There’s lots of meaningless chatter yesterday about job openings. However, actions speak louder than openings.
This report comes after Fed Chair Jerome Powell said “No Sugar Tonight” as in no expected rate cuts. That is, until it becomes obvious that Biden will lose the election, THEN The Fed will start cutting rates like crazy.
An example of the trash that Biden and Democrats are importing from Latin America, Africa and China. Among other sewers. I am sure that employers are lining up to hire this guy. … NOT! Correction: Biden may appoint this creep to his cabinet with the other losers.
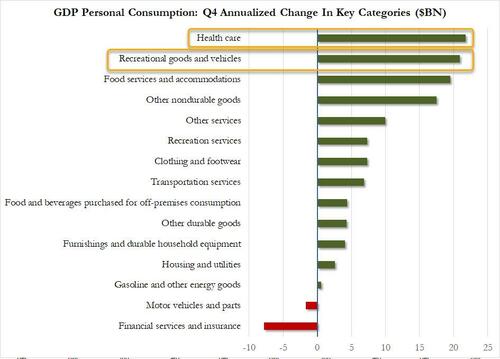
To quote Cousin Eddie from Christmas Vacation, “That there’s an RV.” Recreational goods and vehicles (aka, RVs) were second in Personal Consumption spending after America’s overpriced healthcare.
Spending on RVs makes sense since housing has become unaffordable for millions of households under Bidenomics.
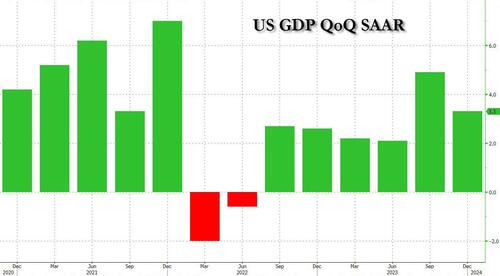
Note that GDP growth was better under Trump (pre-Covid).
The increase in consumer spending reflected increases in both services and goods. Within services, the leading contributors were food services and accommodations as well as health care. Within goods, the leading contributors to the increase were other nondurable goods (led by pharmaceutical products) and recreational goods and vehicles (led by computer software). Within exports, both goods (led by petroleum) and services (led by financial services) increased. The increase in state and local government spending primarily reflected increases in compensation of state and local government employees and investment in structures. The increase in nonresidential fixed investment reflected increases in intellectual property products, structures, and equipment. Within federal government spending, the increase was led by nondefense spending. The increase in inventory investment was led by wholesale trade industries. Within residential fixed investment, the increase reflected an increase in new residential structures that was partly offset by a decrease in brokers’ commissions. Within imports, the increase primarily reflected an increase in services (led by travel).
Compared to the third quarter of 2023, the deceleration in real GDP in the fourth quarter primarily reflected slowdowns in private inventory investment, federal government spending, residential fixed investment, and consumer spending. Imports decelerated.
Current‑dollar GDP increased 4.8 percent at an annual rate, or $328.7 billion, in the fourth quarter to a level of $27.94 trillion. In the third quarter, GDP increased 8.3 percent, or $547.1 billion (tables 1 and 3).
The price index for gross domestic purchases increased 1.9 percent in the fourth quarter, compared with an increase of 2.9 percent in the third quarter (table 4). The personal consumption expenditures (PCE) price index increased 1.7 percent, compared with an increase of 2.6 percent. Excluding food and energy prices, the PCE price index increased 2.0 percent, the same change as the third quarter.
Personal Income
Current-dollar personal income increased $224.8 billion in the fourth quarter, compared with an increase of $196.2 billion in the third quarter. The increase primarily reflected increases in compensation, personal income receipts on assets, and proprietors’ income that were partly offset by a decrease in personal current transfer receipts (table 8).
Disposable personal income increased $211.7 billion, or 4.2 percent, in the fourth quarter, compared with an increase of $143.5 billion, or 2.9 percent, in the third quarter. Real disposable personal income increased 2.5 percent, compared with an increase of 0.3 percent.
Personal saving was $818.9 billion in the fourth quarter, compared with $851.2 billion in the third quarter. The personal saving rate—personal saving as a percentage of disposable personal income—was 4.0 percent in the fourth quarter, compared with 4.2 percent in the third quarter.
GDP for 2023
Real GDP increased 2.5 percent in 2023 (from the 2022 annual level to the 2023 annual level), compared with an increase of 1.9 percent in 2022 (table 1). The increase in real GDP in 2023 primarily reflected increases in consumer spending, nonresidential fixed investment, state and local government spending, exports, and federal government spending that were partly offset by decreases in residential fixed investment and inventory investment. Imports decreased (table 2).
The increase in consumer spending reflected increases in services (led by health care) and goods (led by recreational goods and vehicles). The increase in nonresidential fixed investment reflected increases in structures and intellectual property products. The increase in state and local government spending reflected increases in gross investment in structures and in compensation of state and local government employees. The increase in exports reflected increases in both goods and services. The increase in federal government spending reflected increases in both nondefense and defense spending.
The decrease in residential fixed investment mainly reflected a decrease in new single-family construction as well as brokers’ commissions. The decrease in private inventory investment primarily reflected a decrease in wholesale trade industries. Within imports, the decrease primarily reflected a decrease in goods.
Current-dollar GDP increased 6.3 percent, or $1.61 trillion, in 2023 to a level of $27.36 trillion, compared with an increase of 9.1 percent, or $2.15 trillion, in 2022 (tables 1 and 3).
The price index for gross domestic purchases increased 3.4 percent in 2023, compared with an increase of 6.8 percent in 2022 (table 4). The PCE price index increased 3.7 percent, compared with an increase of 6.5 percent. Excluding food and energy prices, the PCE price index increased 4.1 percent, compared with an increase of 5.2 percent.
Measured from the fourth quarter of 2022 to the fourth quarter of 2023, real GDP increased 3.1 percent during the period (table 6), compared with an increase of 0.7 percent from the fourth quarter of 2021 to the fourth quarter of 2022.
The price index for gross domestic purchases, as measured from the fourth quarter of 2022 to the fourth quarter of 2023, increased 2.4 percent, compared with an increase of 6.2 percent from the fourth quarter of 2021 to the fourth quarter of 2022. The PCE price index increased 2.7 percent, compared with an increase of 5.9 percent. Excluding food and energy, the PCE price index increased 3.2 percent, compared with 5.1 percent.
Annualized interest on the federal debt now exceeds $1 trillion and is projected to breach $3 trillion, annualized rate, by Q4 2030.
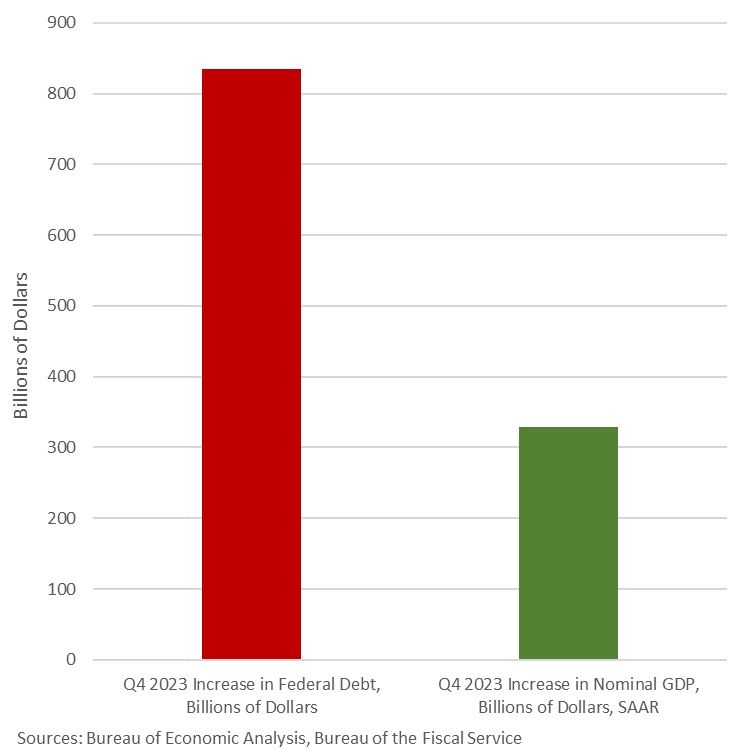
What can you get for an $834-billion increase in federal debt? Only a $328-billion increase in GDP. This economic “growth” in Q4 ’23 was fueled by gov’t expenditures and gov’t transfers, which in turn are fueled by deficits – sound sustainable?
This is Cousin Eddie’s RV. Cheaper than a house under Bidenomics!
Housing is simply unaffordable under Bidenomics, a strange brew of big corporate green subsidies, political handouts (any wonder why Biden is forgiving student loans in an election year?) and bad Fed policy errors.
But young Americans don’t always have a sugar daddy like Hunter Biden has who are willing to pay for rent for political parasites like those in Washington DC.
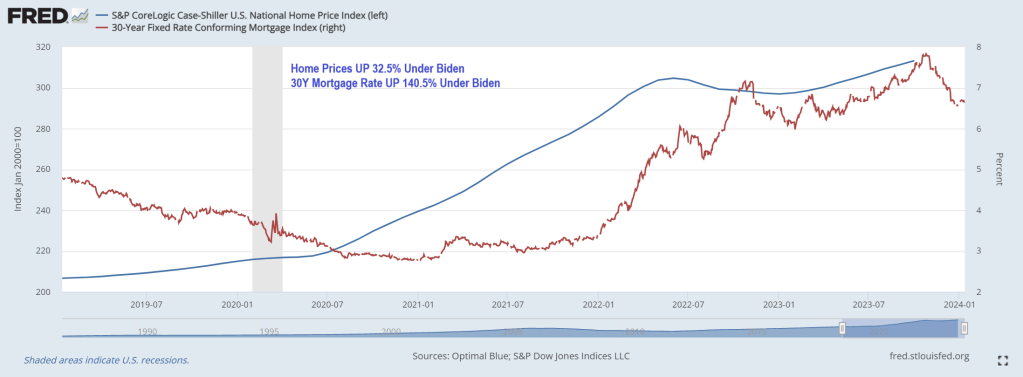
Young adults used to dream of moving out of their parents’ homes and into their own apartments, but living alone has become a luxury not everyone can afford. Not surprising, since home prices under Biden have risen 32.5% while 30-year mortgage rates are up a staggering 140.5% under Clueless Joe.
But in growth terms (year-over-year), White House Propagandists Karine Jean Pierre and John Kirby will no doubt focus on the cooling of housing prices and mortgage rates … although both are reaccelerating.
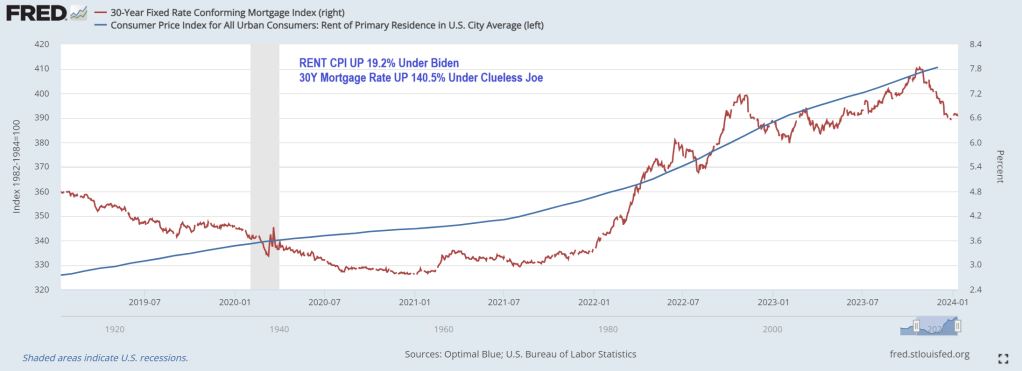
Rent CPI is up 19.2% under Clueless Joe.
How does this impact younger Americans? According to a recent study by Intuit Credit Karma, 31% of Gen Zers are living with their parents because they can’t afford to rent or buy their own place. Overall, 11% of American adults still live at home with their parents.
“The current housing market has many Americans making adjustments to their living situations, including relocating to less-expensive cities and even moving back in with their families,” said Courtney Alev, a consumer financial advocate at Intuit Credit Karma.
Even young adults who live alone are reconsidering their living arrangements because costs are too high.
About a quarter (27%) of Gen Zers reported that they could no longer afford rent and 25% said they’ll have to move back in with family to make ends meet.
Millennials are in the same boat: 30% say rent is unaffordable, and 25% are thinking about moving back in with their parents.
The research is consistent with a 2021 study conducted by the U.S. Census Bureau, which showed that one in three adults ages 18 to 34 live with their parents.
In a 2022 study, Pew Research also found that the percentage of Americans living with their parents has increased steadily since 2000. Pew calls these living arrangements “multigenerational households,” and said young adults ages 25 to 29 are most likely to cohabit with their parents.
Different studies, but all tell the same story: Finances are the top reason young adults are still living with family.
Housing and rental costs rise
It’s hardly surprising that young adults are struggling to make ends meet. Housing costs and living expenses have skyrocketed since the pandemic, and younger generations have faced the most financial hardship.
As Creditnews Research reports, Millennials and Gen Zers have been locked out of homeownership due to rising home prices, elevated interest rates, and stagnant real wages (adjusted for inflation).
For example, in 2023, Millennials accounted for only 28% of homebuyers despite being in their prime home-buying age. Gen Zers barely made a dent in the housing market, accounting for a paltry 4% of all buyers.
According to Fed data, average home prices were $431,000 as of the third quarter of 2023.
The rental market isn’t much better. Although rent costs have declined for three straight months, landlords are still asking for $1,964 per month on average, per Redfin data. Average rents were below $1,650 at the start of Covid.
But the problem of surging rents goes back much longer than that. According to a report from Moody’s Analytics, rent prices grew 135% between 1999 and 2022, while average incomes for all age groups were up 77% over the same period.
In terms of earning potential, younger generations are at the lower end of the totem pole, so they’re more likely to be affected by rising rent prices.
Where’s the “strong economy” everyone always talks about?
While the U.S. economy has steered clear of recession and unemployment remains near historic lows, Americans are still struggling to afford basic expenses. This is especially true for younger generations.
A 2023 study conducted by Deloitte found that more than half of Millennials and Gen Zers were living paycheck to paycheck. Perhaps shockingly, 37% of Millennials and 46% of Gen Z reported taking another part-time or full-time job just to afford their bills.
Working longer hours and barely scraping by is one of the main reasons why younger adults feel they’re worse off financially than their parents were at their age.
An August 2023 study conducted by The Harris Poll found that 74% of Millennials and 65% of Gen Zers believe they are starting further behind financially than previous generations.
“They’re telling us they can’t buy into that American dream the way that their parents and grandparents thought about it—because it’s not attainable,” said The Harris Poll CEO John Gerzema.
Remember, Clueless Joe Biden is in charge!(or Obama, take your pick).
Did you see the recent government propaganda from the U.S. Bureau of Labor Statistics?
Not the latest faulty claim that consumer prices increased at an annual rate of just 3.4 percent in December. But rather the claim that 216,000 jobs were added in December.
Upon release, and right on cue, Treasury Secretary Janet Yellen declared that the U.S. economy had achieved a soft landing. She also said that her “hope is that it will continue.”
What Yellen neglected to mention was that October employment was revised down by 45,000 jobs and November was revised down by 26,000 jobs. That’s 71,000 jobs the government recently reported which didn’t exist.
How many of the 216,000 jobs reported for December will wind up being pure fantasy?
Yellen also didn’t mention that 52,000 of the reported jobs are in government, 59,000 are in health care and social assistance, and 22,000 are in food services.
These aren’t the kind of jobs that create and spread new wealth and abundance to the economy.
In addition, there are 4.2 million workers that are employed part time for economic reasons.
This represents individuals who prefer full-time employment but are working part-time because their hours have been cut or they cannot find full-time work.
There are also 8.5 million multiple job holders. These are people who work more than one job because a single job doesn’t pay the bills.
Yellen, obviously, isn’t interested in these pesky details. What she is interested in is that when the data is massaged and contrived, and then summed up, the government can report an unemployment rate of 3.7 percent.
Hence, she can point to this number and crow about how through her expert navigation skills she has piloted a soft landing.
What’s really going on?
Here we’ll offer an anecdote followed by some thoughts…
Burning Ambition
Your editor’s son, a junior in high school, works at a pizza joint in the mall. There he makes and sells pizzas to hungry customers for $12.50 per hour – pre-tax. The minimum wage in Tennessee is $7.25 per hour.
Of note, he’s the only highschooler working there. His coworkers are all well into their dirty-30s. Some have kids. Some have multiple jobs. We haven’t asked any of them. But we suppose none would claim to be living the dream.
Reviews on Google are unflattering. They warn of pizzas and customer service that are of dubious quality. They tell a story of a shortage of good help. Here are several recent examples:
“Walked up to ask when they open. Some jerk behind the counter with a ponytail and big ear piercings goes, ‘Lights out not open!’ With a ton of attitude. We said, ‘You don’t have to be rude, we just wanted to know what time you opened.’ And his response was, ‘Welcome to the mall.’ What an absolute jerk. Don’t go here!”
“Ever had stale crackers with cheap ketchup and paper-thin burnt pepperoni on top of a thin layer of what was once cheap cheese before? If you’re on a quest to find the worst pizza in Knoxville, then come to the west town mall.”
“Got a slice of cheese pizza, sat down and the bottom of it was burnt. I tried to go get a different slice and he told me that all the other pizzas would be like that too and that it was normal for them to serve burnt pizza. He was a bit sarcastic about the situation.”
There are over one hundred reviews posted which share various tales of customer dissatisfaction. You’ve likely had similar experiences at your own local establishments. Burning pizzas and serving them with heapings of attitude is normal these days. Though having a burning ambition is rare.
What’s the point…
Cherry Picking Data Durations
These low-level service jobs, filled by people with low-level skill sets, are the jobs that Yellen is so excited about.
Absolutely, these jobs are important.
If they didn’t exist there would be no option to get cheap mall pizza while simultaneously getting insulted.
Life would be less abundant.
Nonetheless, these are not the type of jobs that drive the economy forward.
They certainly don’t offer opportunities for American workers to get ahead.
They don’t provide the cutting-edge skills, or the higher wages needed to propel the American economy above its foreign competitors.
One of Yellen’s key talking points is that wage growth is outpacing inflation. She can even point to the December jobs report for justification.
Based on the government propaganda, hourly earnings rose 4.1 percent in the year through December while consumer price inflation, as measured by the consumer price index (CPI), came in at 3.4 percent for the year. Here’s Yellen:
“Wage increases are running over price increases now. American workers are getting ahead and the progress for the middle-income families is very noticeable.”
Cherry picking data durations to support a false narrative is a longstanding tactic of big government statists. The reality is that on Yellen’s watch American workers have steadily fallen behind.
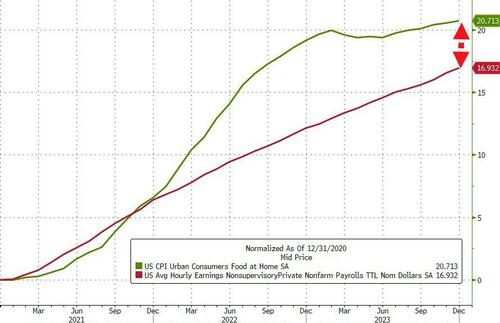
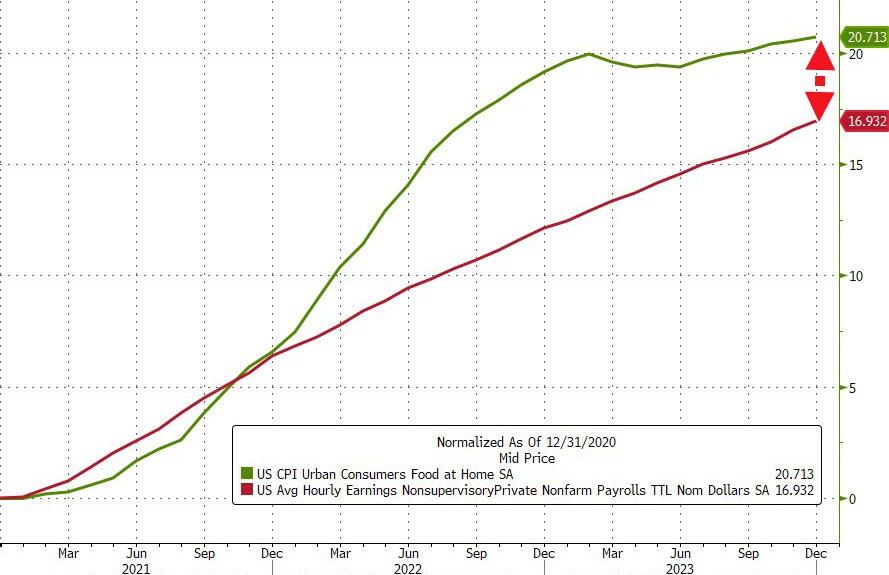
When you zoom out to show from December 2020 to the present, average hourly wages and CPI tell a much different story.
As David Stockman, the former Director of the Office of Management and Budget recently detailed, “the cost of living has risen 25 percent more than the average hourly wage.”
In other words, American workers have taken a significant pay cut over the last three years.
Yellen’s Bald-Faced Lies
If you didn’t know, Yellen has held various positions with the Federal Reserve and later the Treasury over the last 30 years. She’s participated in and advanced an era of unprecedented economic activism.
Moreover, Yellen and her colleagues at the Fed have their fingerprints all over the wage debasement that has taken place over the last several years.
As Stockman elaborated:
“A few years ago when the shortest inflation ruler available—the core PCE deflator—was running significantly below the Fed’s sacred 2.00% target, the Eccles Building was all for a catch-up of the level. The Fed even announced a policy of targeting inflation to average 2.0% over time, which ukase did not include, conveniently, the exact span of time to be measured.
“‘The Federal Reserve now intends to implement a strategy called flexible average inflation targeting (FAIT). Under this new strategy, the Federal Reserve will seek inflation that averages 2% over a time frame that is not formally defined. This means that after long periods of low inflation, the Federal Reserve will not enact tighter monetary policy to prevent rates higher than 2%. One benefit of this flexible strategy to managing the mandate of price stability is that it will impose fewer restrictions on the mandate of full employment.’
“Wouldn’t you know it? The Fed switched to ‘averaging’ in August 2020—just months before inflation went soaring to levels not seen since the 1970s.”
The gap between reality – consumer price increases vs wage increases – and what government bureaucrats want you to believe to be true takes frequent bald-faced lies to fill.
Yellen, for her part, excels at selectively using contrived data to make assertions that are visibly false.
We don’t know if she believes the propaganda she spews or if her intent is to deceive people. Regardless, the whole act is exceedingly wearisome.


You must be logged in to post a comment.