I was hoping that the week of July 4th would start off with fireworks, but we got bad news about the economy.
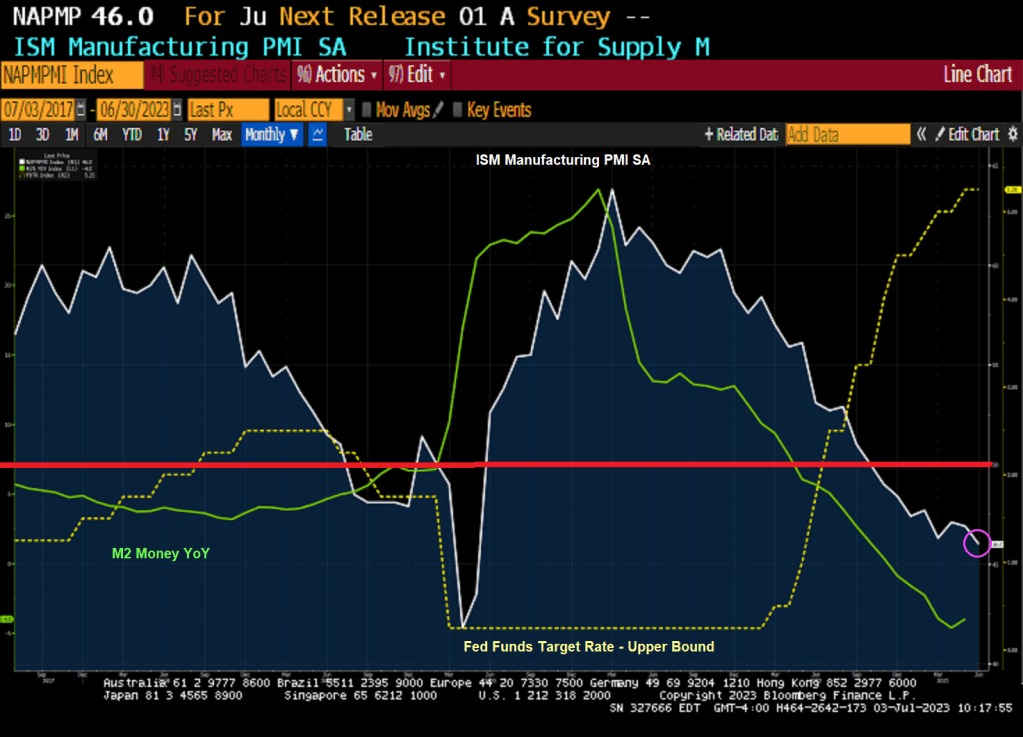
US factory activity contracted for an eighth month in June, slipping to the weakest level in more than three years as production, employment and input prices retreated.
The Institute for Supply Management’s manufacturing gauge fell to 46, the weakest since May 2020, from 46.9 a month earlier, according to data released Monday. The current stretch of readings below 50, which indicates shrinking activity, is the longest since 2008-2009.
The decline in the ISM production gauge, which also stands at the lowest level since May 2020, suggests demand for merchandise remains weak. The index of new orders contracted for the 10th straight month and order backlogs shrank, which may help explain a pullback in a measure of manufacturing employment.
The ISM gauge retreated to a three-month low and, at 48.1, indicates fewer producers adding to payrolls.
Many Americans continue to limit their spending on merchandise as they rotate to services and experiences. Others are simply tightening their belts as still-high inflation takes a toll on their incomes.
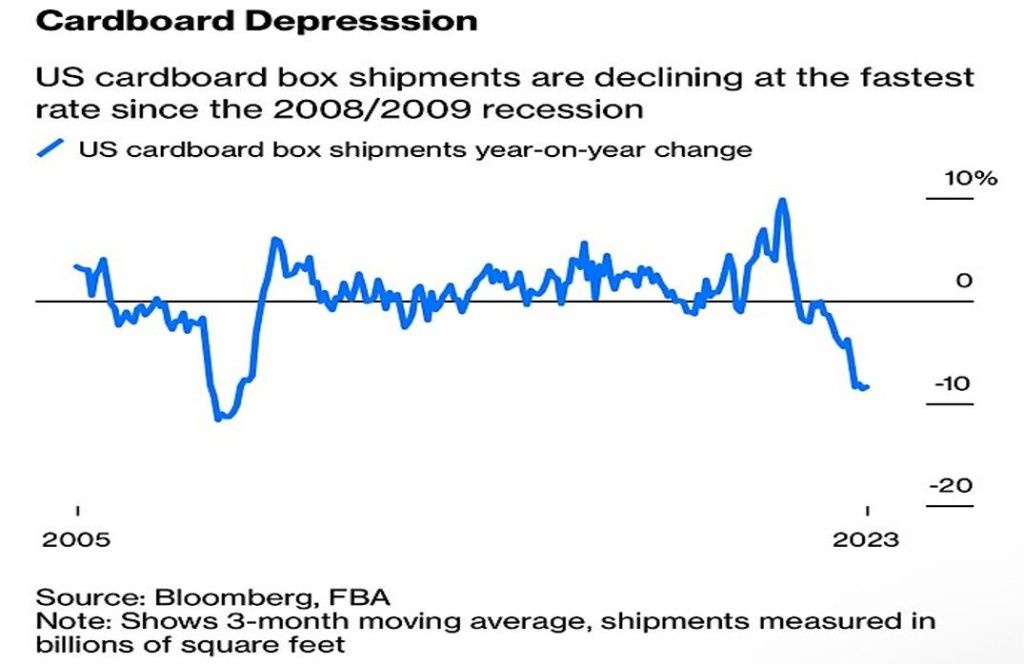
And then we have cardboard box shipments declining at fastest rate since 2008/2009.
At least Ethereum is up over 2% this morning.
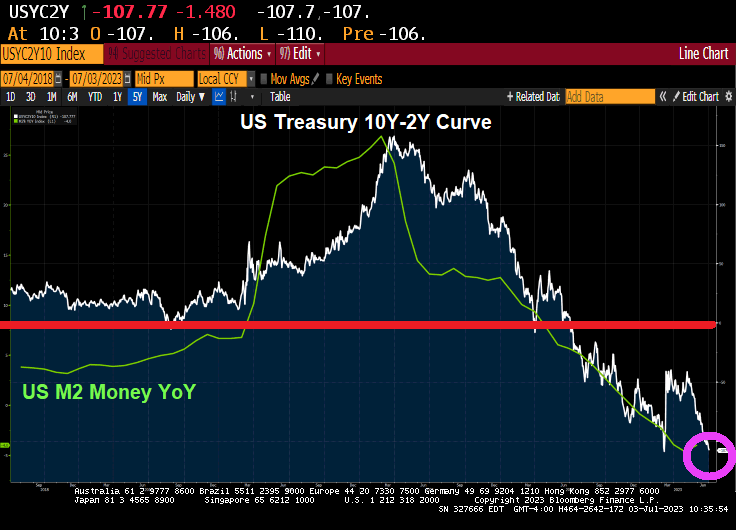
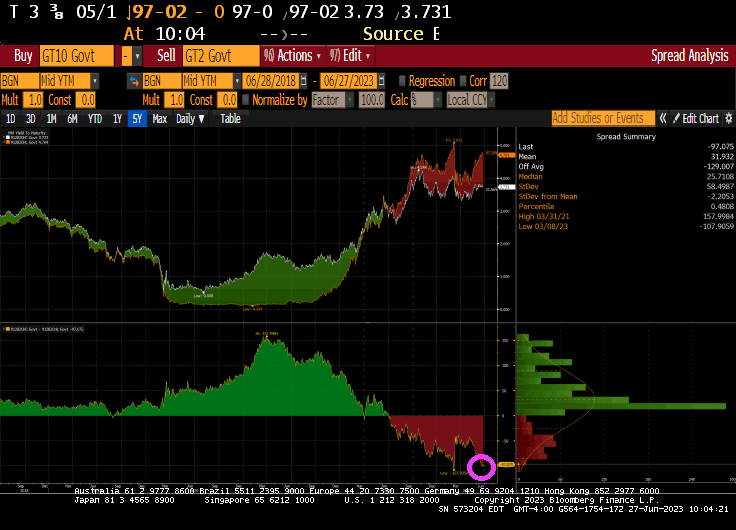
And the US Treasury 10Y-2Y keeps on diving deeper into inversion.
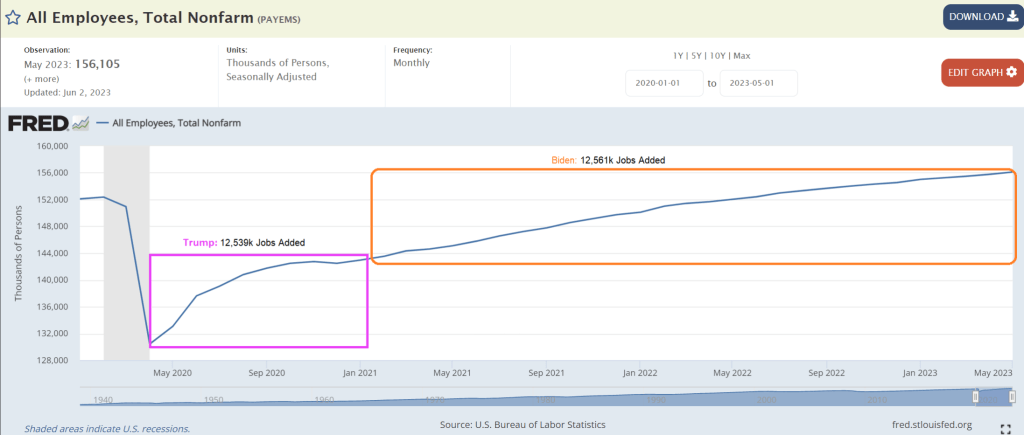
Yes, Resident Biden, our bumbling, corrupt “leader” said “We created more new jobs in two years than any president did in their entire term.” Of course, like almost everything that comes out of Biden’s mouth was a lie.
Actually, the US economy added 12.53 million jobs after April 2020 (Trump) while Bidenomics created took 2 1/2 years to add 12.56 million jobs. So, Biden took over twice as long to create jobs after Covid than it did under Trump. Simply opening the economy and schools produced that magical claim by Biden.
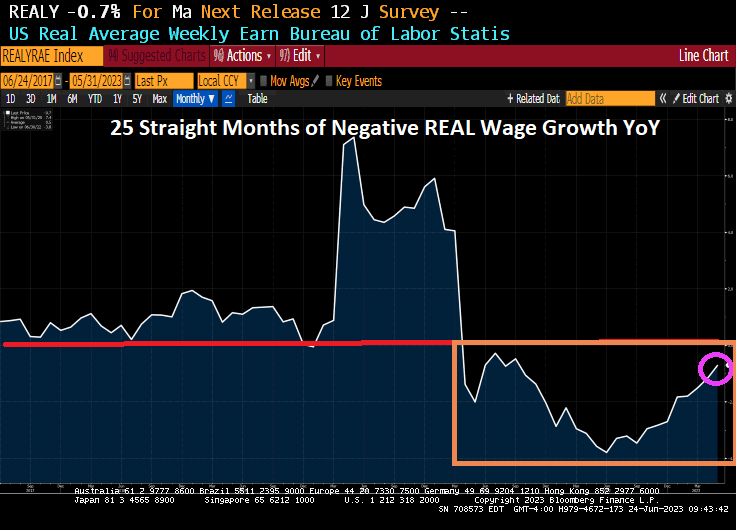
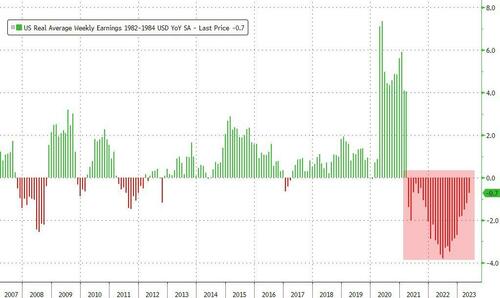
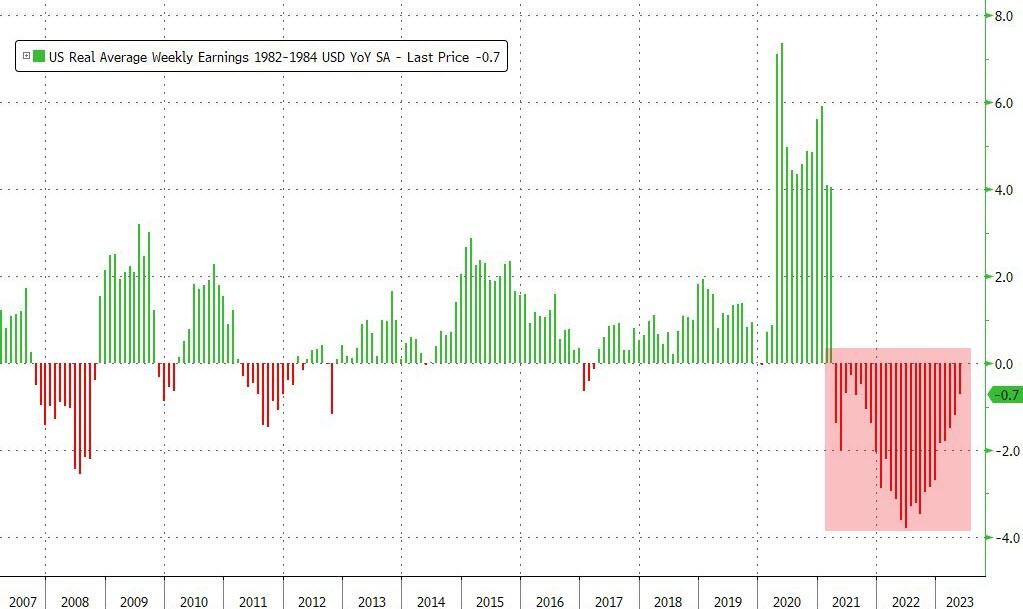
Then we have 25 consecutive months of negative REAL weekly earnings YoY.
And the 10Y-2Y Treasury yield curve is on a decidedly downward trend.
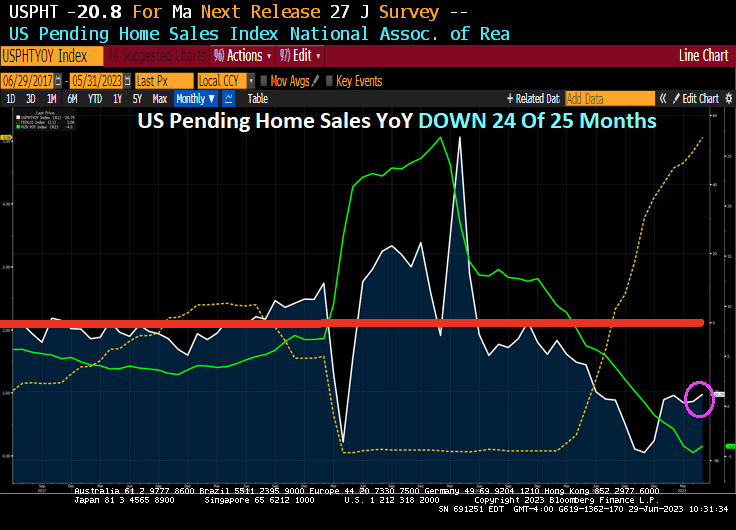
Bidenomics? Yes, an economy where inflation crushes the middle class and low wage workers with 2 years of negative wage growth and now 24 or the last 25 months of negative growth rates of Pending Home Sales YoY.
After existing home sales were flat and new home sales exploded higher, pending home sales once again are the tie-breaker on May’s housing market (and were expected to decline 0.5% MoM). The actual print was considerably worse than expected, down 2.7% MoM (and April was revised down from unchanged to -0.4% MoM). Pending Home Sales were down -20.8% YoY in May.
This is not exactly surprising given that Americans have suffered from 25 straight months of NEGATIVE real weekly earnings growth.
“C’mon man! The Biden clan is getting filthy rich with foreign bribes! Stop the malarkey about Bidenomics being a disaster!”
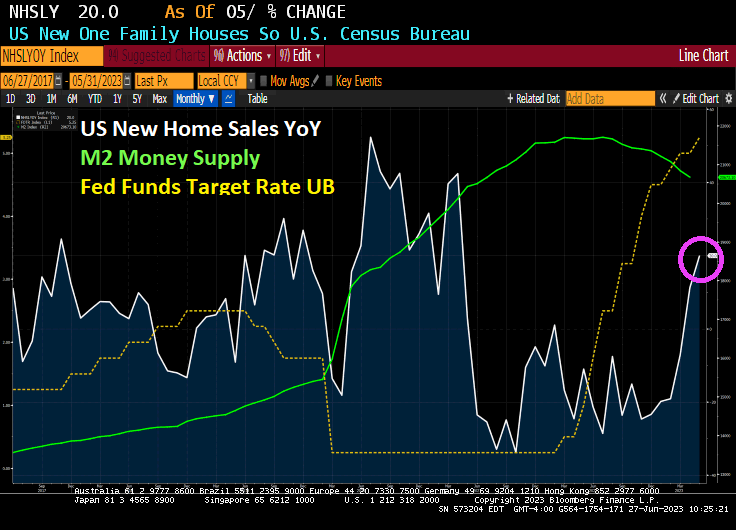
Well its about time that homebuilder started building again! And maybe it was The Fed rate hike pause (and possible rate cuts in the future.
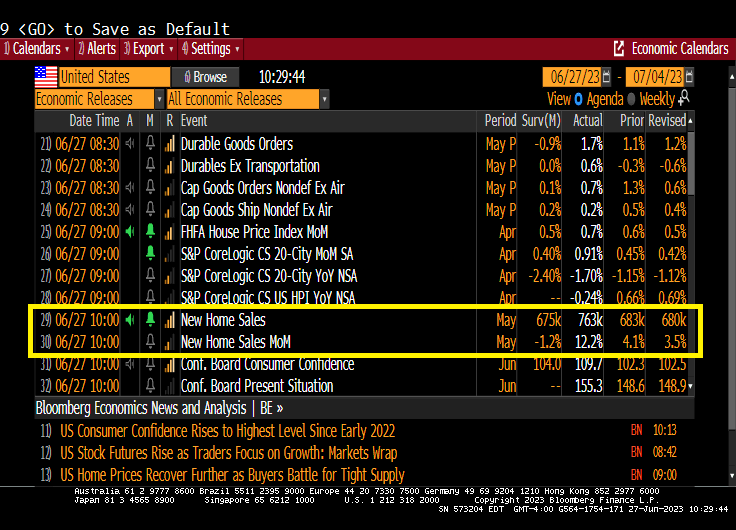
US new home sales rose 20% in May as The Fed pauses rate hikes.
Fed Funds Futures point to one or two more rate hikes, then down she goes!!!
763k new homes were added in May
Remember, there is still a lot of stimulus (M2) sloshing around the economy. Perhaps we can rename all the infrastructure stimulus that is leaking out into the economy “Buttigieg Bucks.” Or “Buty Bucks!”
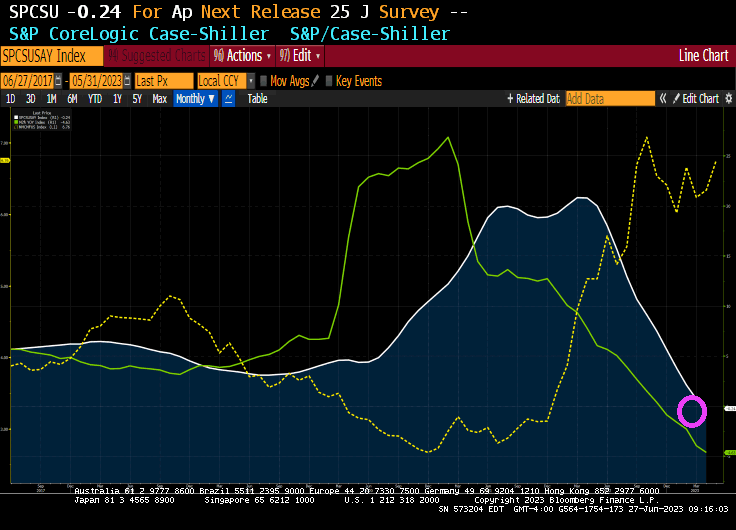
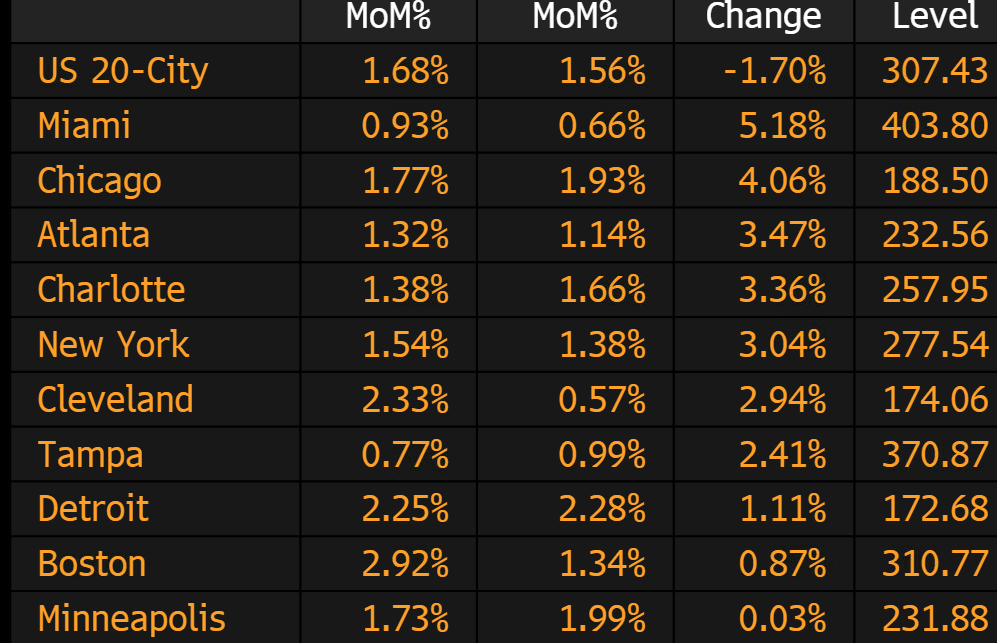
The S&P CoreLogic Case-Shiller U.S. National Home Price NSA Index, covering all nine U.S. census divisions, reported a -0.2% annual decrease in April, down from a gain of 0.7% in the previous month. The 10-City Composite showed a decrease of -1.2%, down from the -0.7% decrease in the previous month. The 20-City Composite posted a -1.7% year-over-year loss, down from -1.1% in the previous month.
The winners in April? Miami and … Chicago?
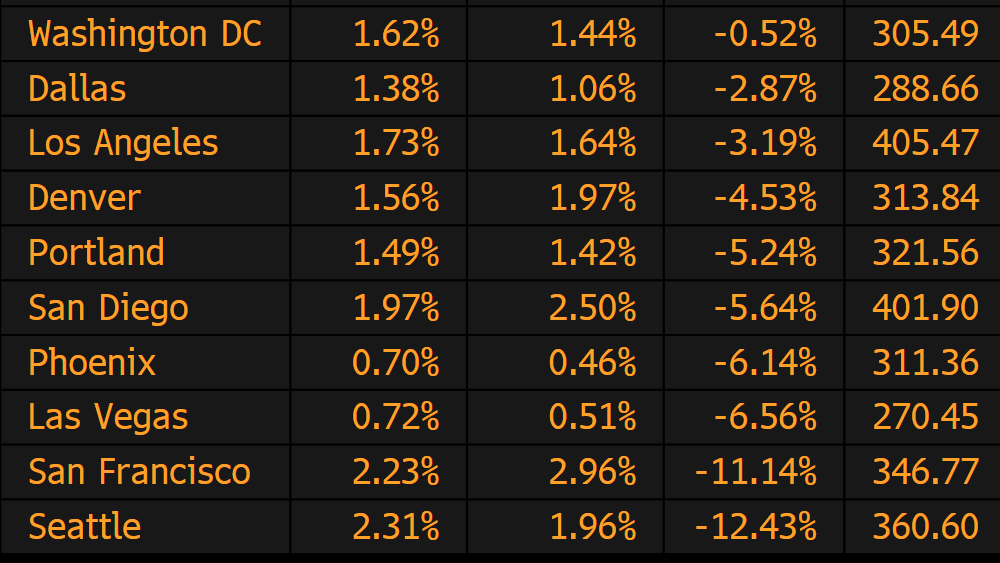
The biggest losers in April? Seattle and San Francisco both suffered YoY losses over -11%.
The US Treasury 10Y-2Y yield curve remains steeply inverted at -97 basis points.
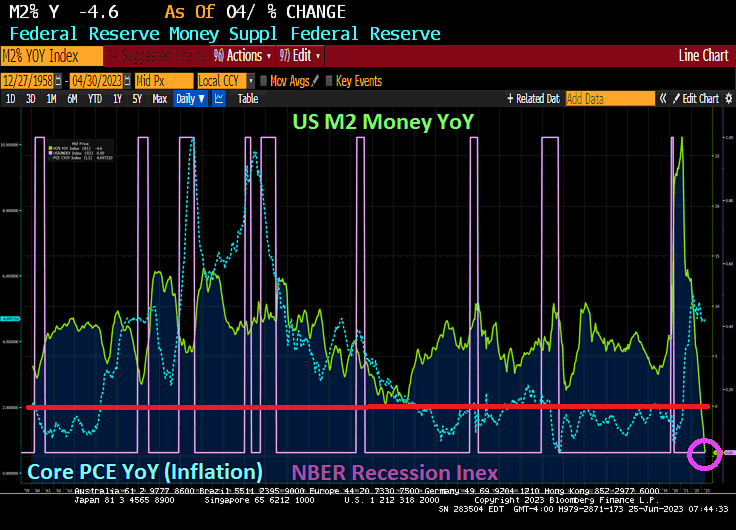
Money supply growth fell again in April from Jerome Powell And The Fed, plummeting further into negative territory after turning negative in November 2022 for the first time in twenty-eight years. April’s drop continues a steep downward trend from the unprecedented highs experienced during much of the past two years.
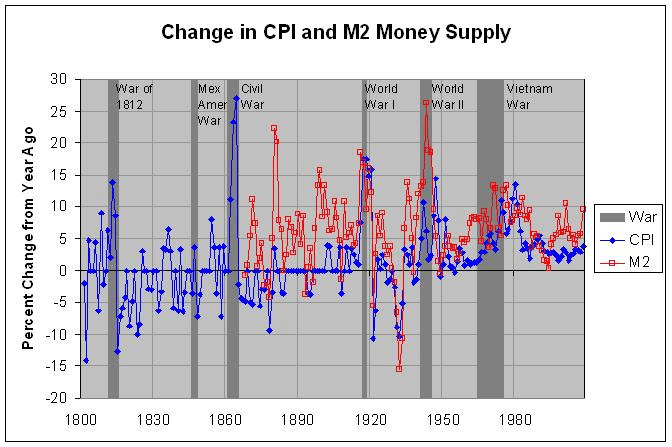
Yes, The Fed is printing money like it is going out of style! The war on Covid was similar to other wars fought where the US printed boatloads of money to pay for WWI. WWII, Korea and Vietnam wars. And the war against the middle class (known as The Best Depression). Apparently, The Fed is still waging war against the middle class.
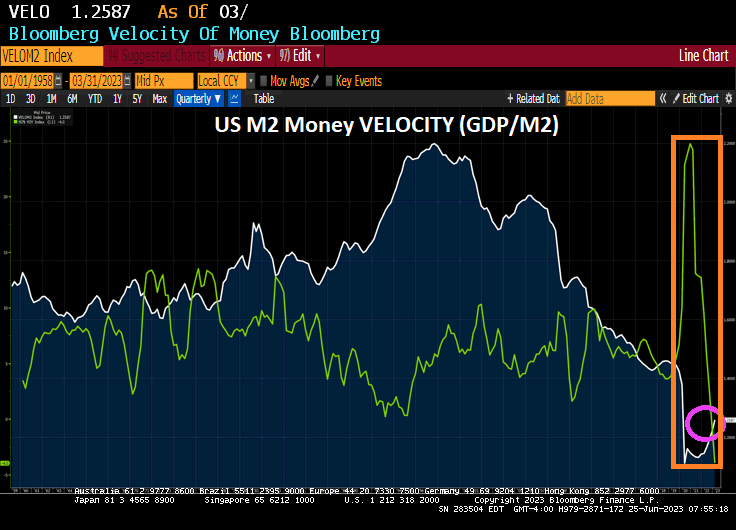
US M2 Money VELOCITY (GDP/M2) is near an all-time low after The Fed went berserk with money printing to combat the Covid economic and school shutdowns.
Then with The Fed’s massive monetary expansion and sudden contraction, we have REAL average weekly earnings growth YoY in negative territory for 25 straight months.
The Walking Dead’s Negan, the poster child for The Federal Reserve.
I could have used 3 shades of Joe, but 50 shades of Joe sounds better!
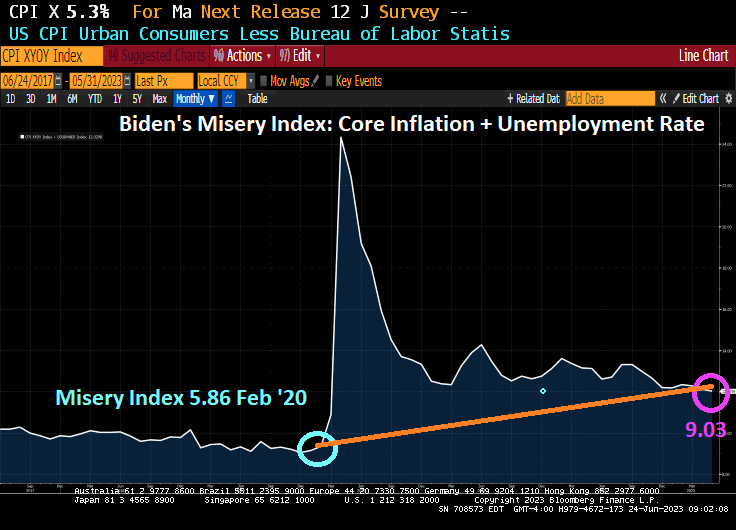
But the fact remains that Americans are far more miserable under Biden than they were under Trump before the Chinese Wuhan Covid virus was unleashed. 9.03 today (Core CPI YoY + U-3 Unemployment) than it was in February 2020 under Trump (5.86). While not twice as bad, inflation is continues to cause serious problems for America’s middle class and low-wage workers.
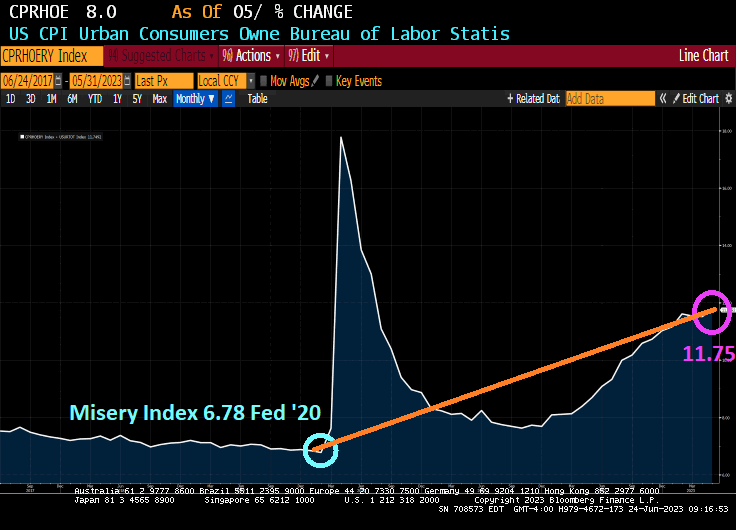
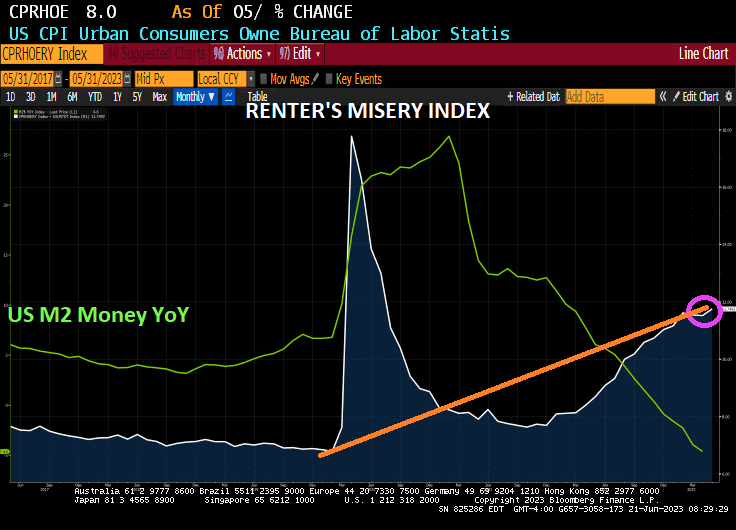
Speaking of the middle class and low wage workers, let’s look at the Renter’s Misery index (CPI Owner’s equivalent rent YoY + Unemployment rate). It was 6.78% in February 2020 under Trump and before Covid struck and is now 11.75% under Inflation Joe.
Speaking of misery, how 25 straight months of negative REAL wage growth? Real weekly wage growth went negative in April 2021, just a few months after Biden was installed as President.
Now, there was winners under Biden. Green energy donors, the big banks, big pharma, big tech, but media … essentially any big donors from big entities got massive payoffs. The middle class and low-wage workers? As Jerry Reid once sang, “They got the coal mine and we got the shaft.”
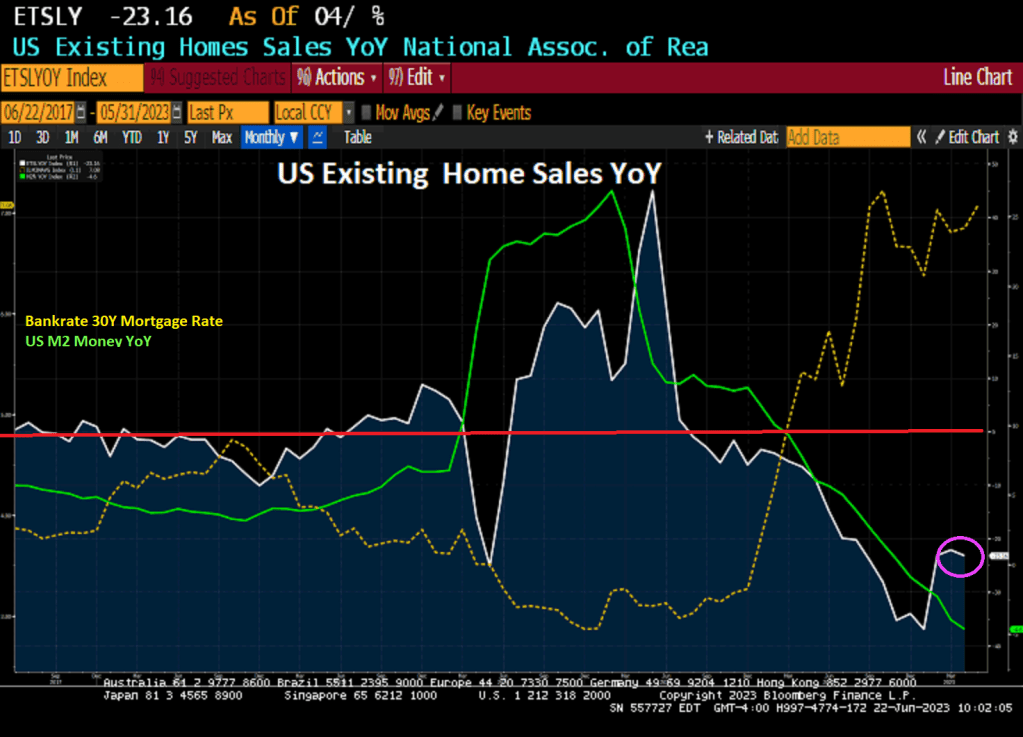
Like a bad good news, bad news joke, the good news is that US existing home sales ROSE 0.2% in May. The bad news? Existing home sales are DOWN -23.16% on a year-over-year basis.
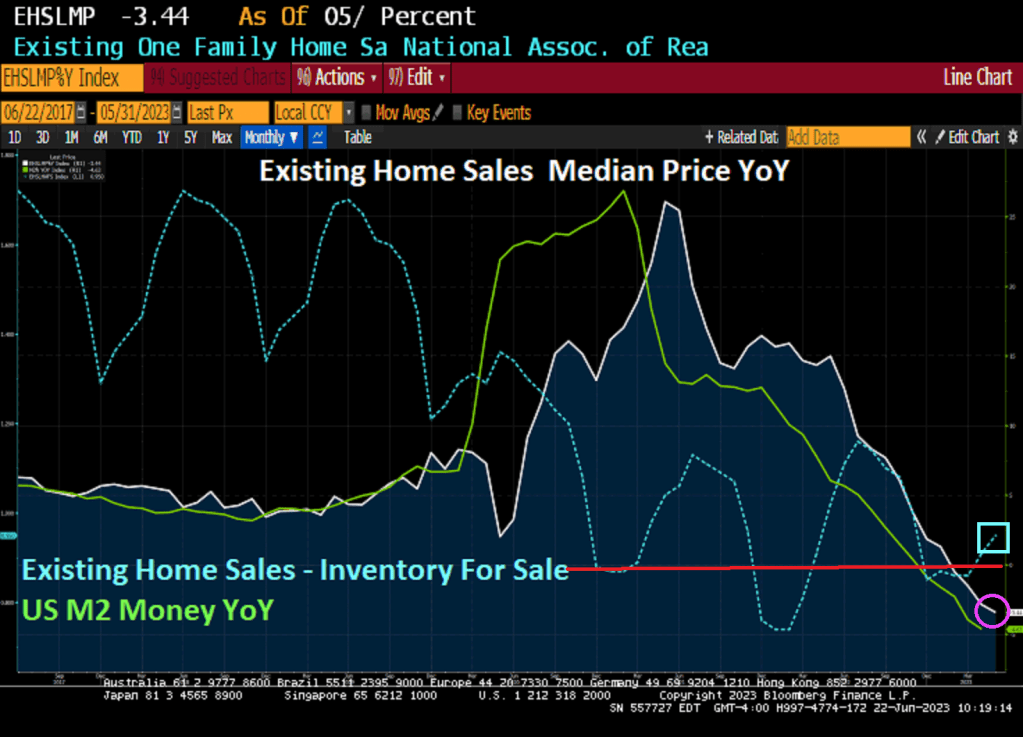
And the median price of existing home sales fell -3.44% YoY as inventory for sales remains missing in action (like Biden debating Democrat challengers).
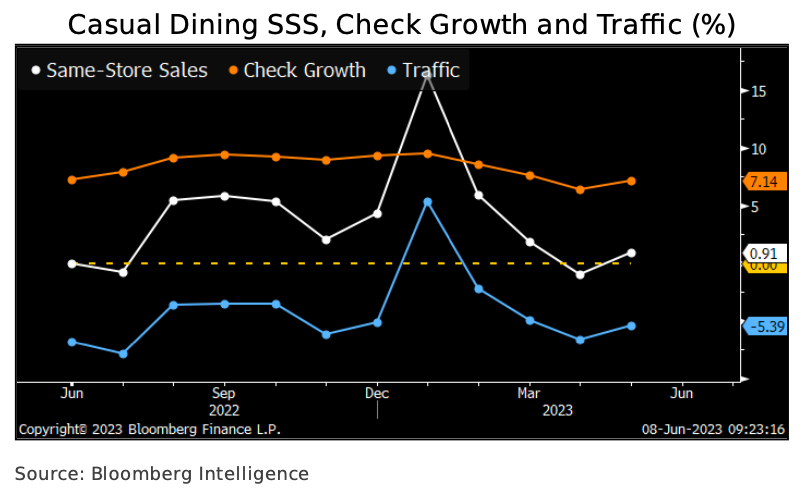
Bloomberg Intelligence’s Michael Halen penned a new note titled “2H Restaurant Sales: Inflation Killing Appetites.” It outlines, “Consumer spending finally buckles under more than two years of inflation and price hikes,” and the likely result is a trade-down of casual-dining chains like Brinker and Cheesecake Factory for quick-service chains like McDonald’s and Wendy’s.
The trade-down, which could start as early as this summer, is expected to dent consumer spending in restaurants such as Cheesecake Factory, Texas Roadhouse, and at brands operated by Brinker and Darden, Halen said.
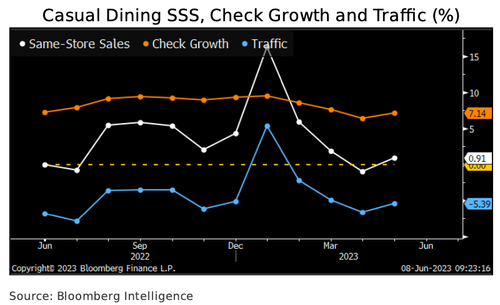
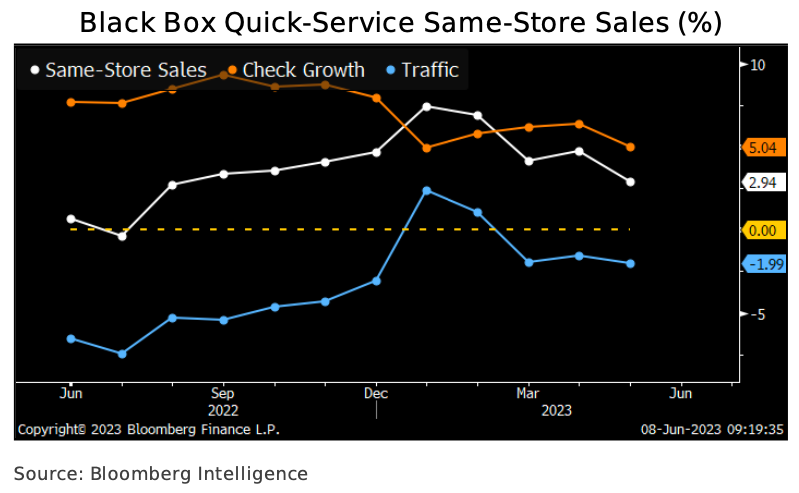
Casual-dining industry same-store sales rose just 0.9% in May, according to Black Box Intelligence, as traffic dropped 5.4%. We expect cash-strapped low- and middle-income diners to cut restaurant visits and checks through year-end due to more than two years of real income declines and ballooning credit-card balances.
Halen provides more details about quick-service restaurants to fare better than causal-dining ones as “consumer spending finally buckles.”
Quick-service restaurants’ same-store sales could moderate with consumer spending in 2H but should fare better than their full-service competitors. Results rose 2.9% in May, according to Black Box data, as a 5% average-check increase was partly offset by a 2% guest-count decline. Check- driven comp-store sales gains are unsustainable, and we think inflation and menu price hikes will motivate low- and middle-income diners to reduce restaurant visits and manage their spending in 2H. On Domino’s 1Q earnings call, management said lower-income consumers shifted delivery occasions to cooking at home. Still, a trade-down from full-service dining due to cheaper price points may cushion the blow.
McDonald’s, Burger King, Wendy’s, and Jack in the Box are among the quick-service chains in Black Box’s index.
The latest inflation data shows consumers have endured the 26th straight month of negative real wage growth. What this means is that inflation is outpacing wage gains. And bad news for household finances, hence why many have resorted to record credit card usage.
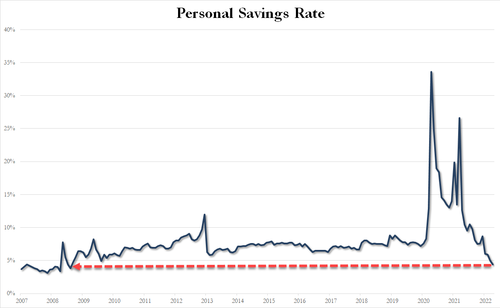
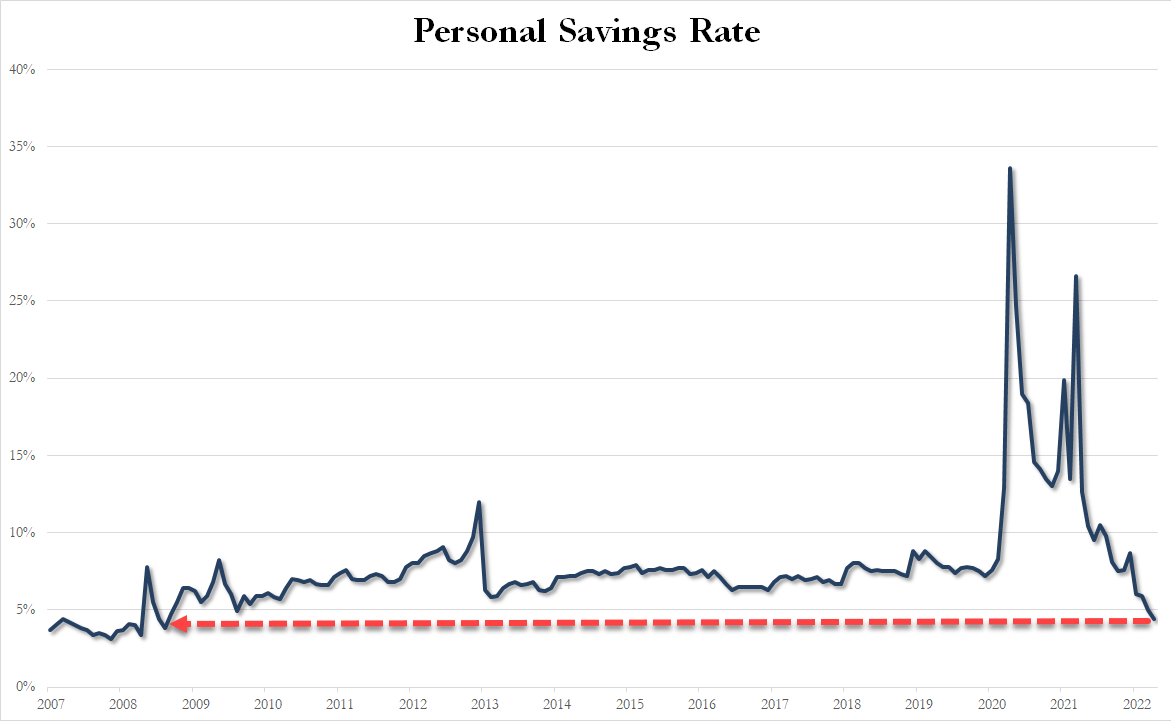
And the personal savings rate has collapsed to just 4.4%, its lowest level since Sept. 2008 (the dark days of Lehman). And why is this? To afford shelter, gas, and food, consumers are drawing from emergency funds due to the worst inflation storm in a generation.
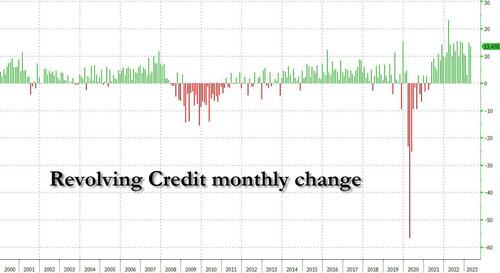
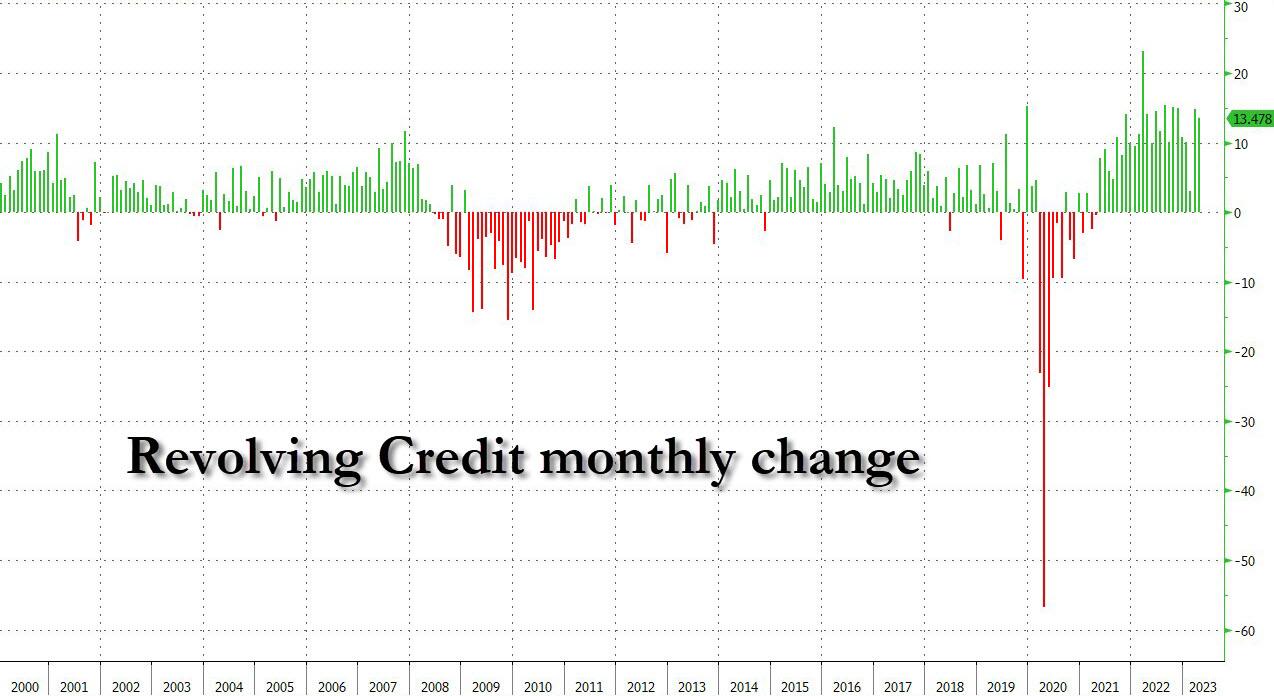
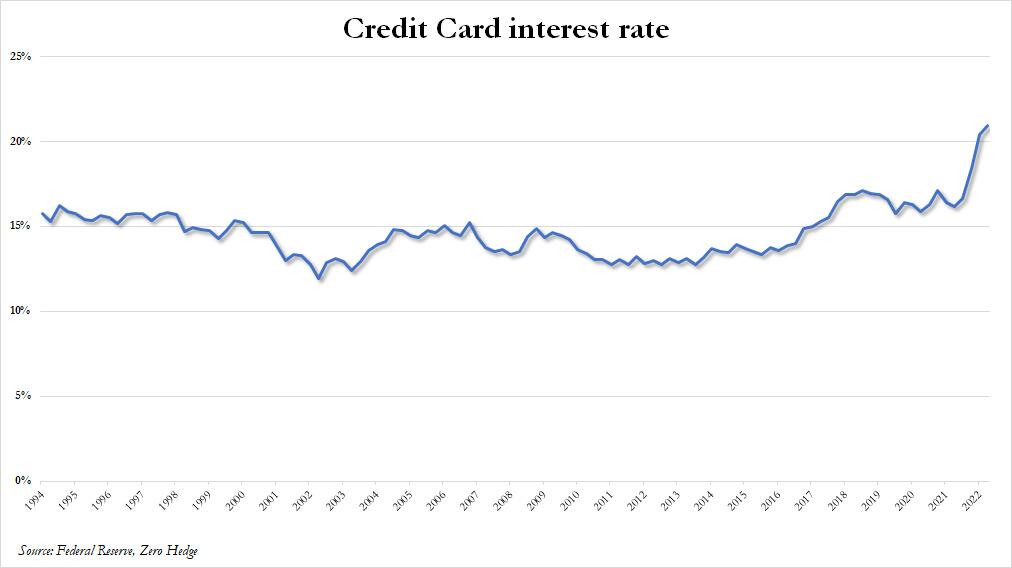
As revolving consumer credit has exploded higher and the last two months have seen a near-record increase…
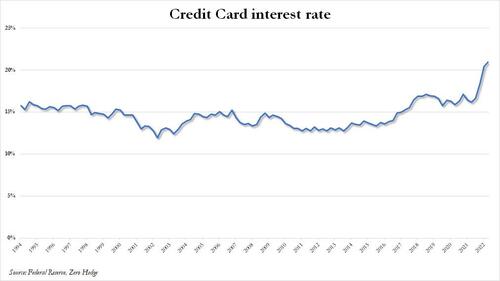
… even as the interest rate on credit cards has jumped to the highest on record.
With record credit card debt load and highest interest payments in years, plus depleted savings, oh yeah, and we forgot, the restart of student loan payments later this year, this all may signal a consumer spending slowdown at causal diners while many trade down for McDonald’s value menu. Even then, we’ve reported consumers have shown that menu items at the fast-food chain have become too expensive.
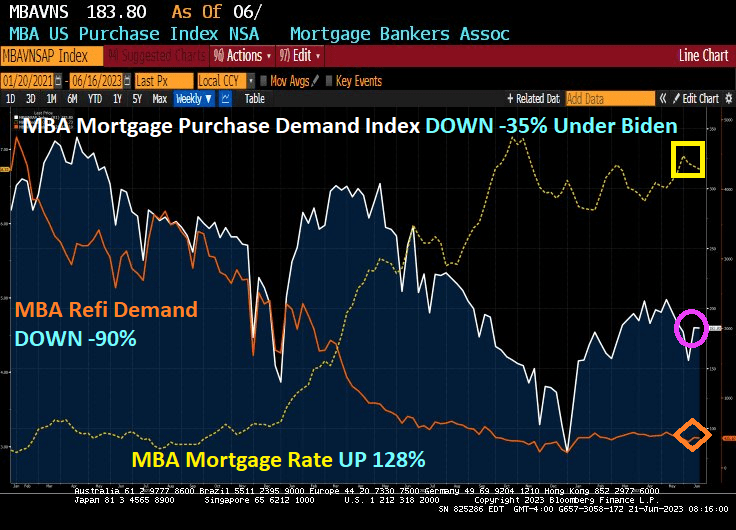
The good news? Mortgage purchase demand fell only -0.05% from last week. The bad news? Mortgage purchase demand is down -35% since Resident Biden was sworn in. And mortgage refinancing demand is down a whopping -90%. Reason? Mortgage rates are up 128% under Clueless Joe.
Mortgage applications increased 0.5 percent from one week earlier, according to data from the Mortgage Bankers Association’s (MBA) Weekly Mortgage Applications Survey for the week ending June 16, 2023.
The Market Composite Index, a measure of mortgage loan application volume, increased 0.5 percent on a seasonally adjusted basis from one week earlier. On an unadjusted basis, the Index decreased 1 percent compared with the previous week. The Refinance Index decreased 2 percent from the previous week and was 40 percent lower than the same week one year ago. The seasonally adjusted Purchase Index increased 2 percent from one week earlier. The unadjusted Purchase Index decreased 0.1 percent compared with the previous week and was 32 percent lower than the same week one year ago.
And as Paul Harvey used to say, here is the rest of the story.
And the renter’s misery index, CPI for owner’s equivalent rent YoY + U-3 unemployment rate, is now a staggering 11.75% verus 6.78% in February 2020, the last month before the Chinese Wuhan virus led to economic and school shutdowns. And we have Donald Trump as President instead of this corrupt clown.
What is the difference between baseball legend Shoeless Joe Jackson and Clueless Joe Biden? While both sold out their teams for personal wealth, at least Shoeless Joe was good at baseball. Clueless Joe is a corrupt bully. Shoeless Joe was allegedly stupid, but so is Clueless Joe.


You must be logged in to post a comment.