Joe Biden, or “Blow Biden” after the cocaine was discovered in the White House the other day, owns the abysmal mortgage and housing market thanks to The Fed fighting inflation caused by Bidenomics (massive Federal spending and massive Fed stimulus).
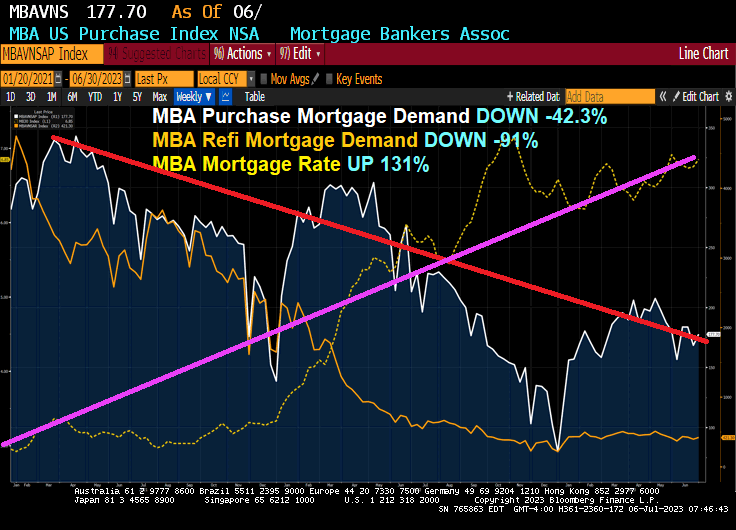
Mortgage applications decreased 4.4 percent from one week earlier, according to data from the Mortgage Bankers Association’s (MBA) Weekly Mortgage Applications Survey for the week ending June 30, 2023. Last week’s results included an adjustment for the Juneteenth holiday.
The Market Composite Index, a measure of mortgage loan application volume, decreased 4.4 percent on a seasonally adjusted basis from one week earlier. On an unadjusted basis, the Index increased 6 percent compared with the previous week. The Refinance Index decreased 4 percent from the previous week and was 30 percent lower than the same week one year ago. The seasonally adjusted Purchase Index decreased 5 percent from one week earlier. The unadjusted Purchase Index increased 6 percent compared with the previous week and was 22 percent lower than the same week one year ago.
Here is the rest on the story:
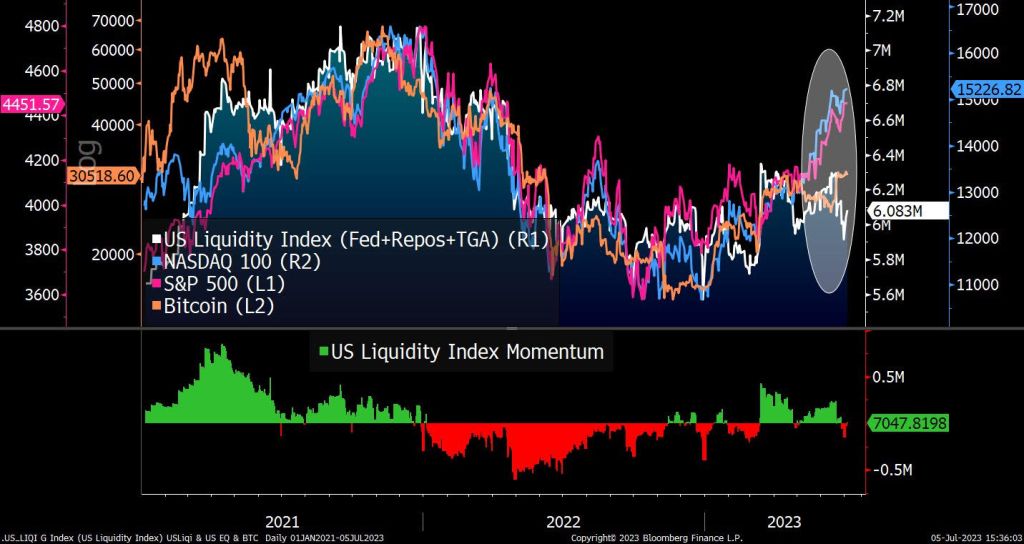
As liquidity dries up under Bidenomics. Or Yellenomics. Take your pick!
Seriously, can The Biden Administration get any more embarrassing? Or dangerous to American civil liberties?
Its the 4th of July, American Independence Day from England, but under Biden and The Federal Reserve, Americans are DEPENDENT on debt and Federal spending. In other words, Americans are addicted to gov.
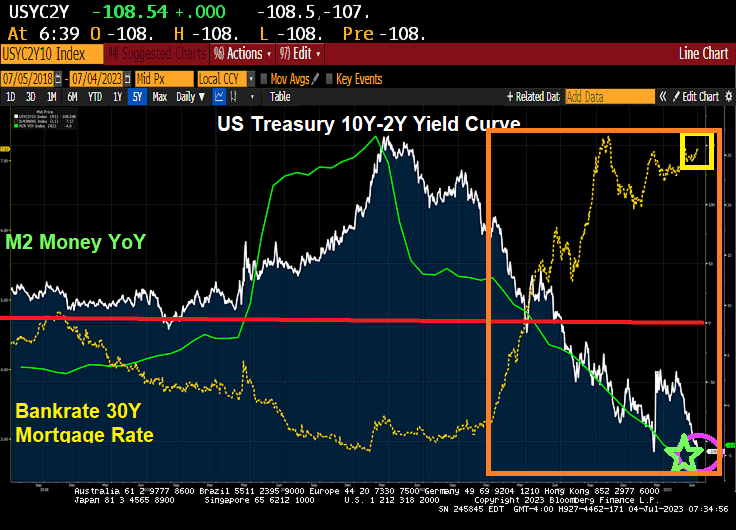
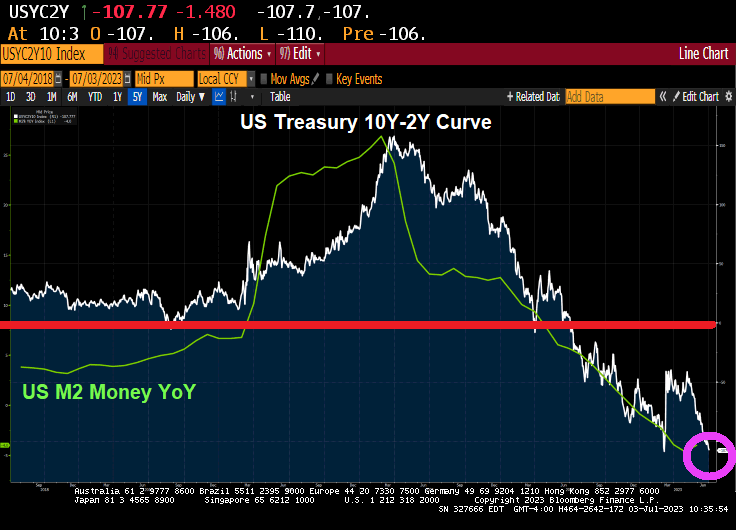
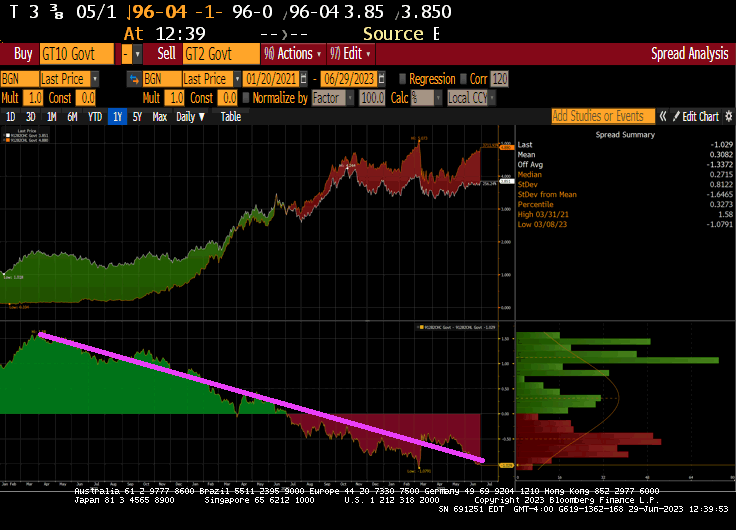
First, Bankrate’s 30-year mortgage rate index is up 150% under Biden. You can see the rapid rise in mortgage rates started with Biden (orange box). Meanwhile, the US Treasury yield curve (10Y-2Y) is the most inverted (negative slope) since 1981. Way to go, Joe!!
On the metals side, gold and silver are up slightly. (Go silver go!!)
On the crypto side, Polkadot is up 1.26% while Bitcoin is down -0.18%.
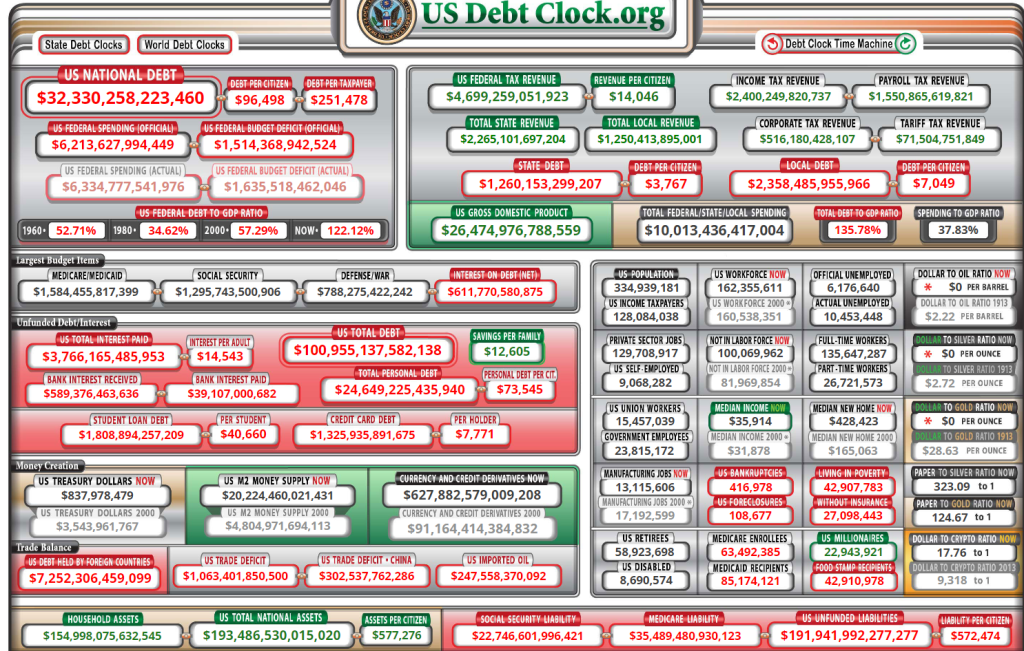
Memo To Fed: keep on printing! Why? US debt is currently $32.33 TRILLION with $192 TRILLION in unfunded Federal liabilties. That is 5 times the current level of debt!!
I was hoping that the week of July 4th would start off with fireworks, but we got bad news about the economy.
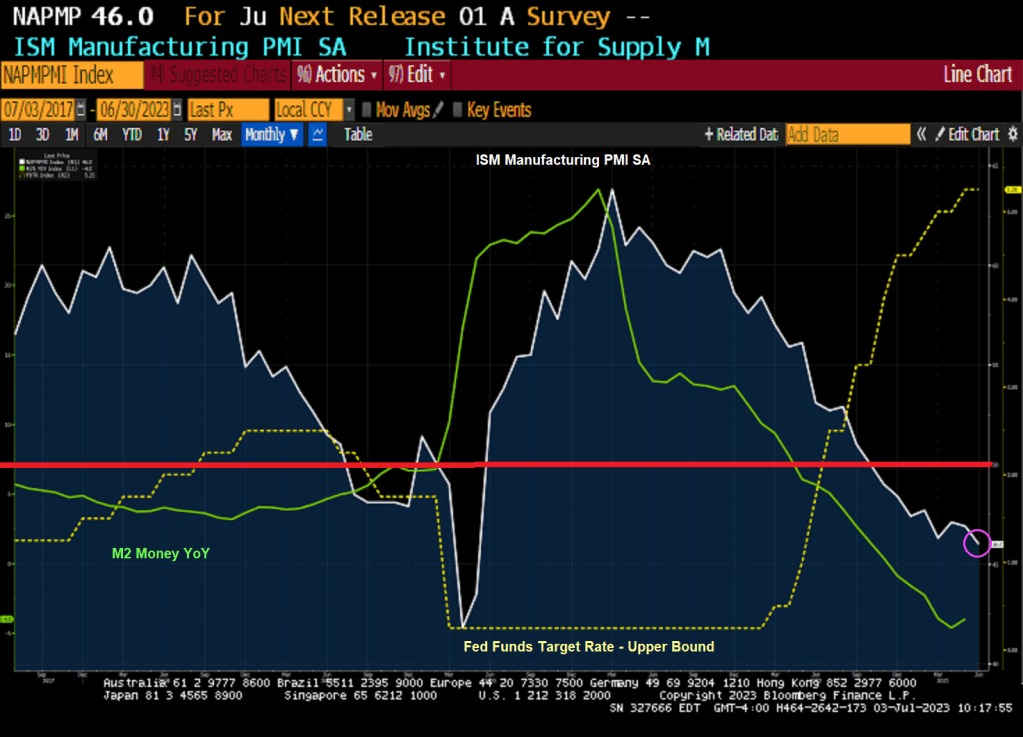
US factory activity contracted for an eighth month in June, slipping to the weakest level in more than three years as production, employment and input prices retreated.
The Institute for Supply Management’s manufacturing gauge fell to 46, the weakest since May 2020, from 46.9 a month earlier, according to data released Monday. The current stretch of readings below 50, which indicates shrinking activity, is the longest since 2008-2009.
The decline in the ISM production gauge, which also stands at the lowest level since May 2020, suggests demand for merchandise remains weak. The index of new orders contracted for the 10th straight month and order backlogs shrank, which may help explain a pullback in a measure of manufacturing employment.
The ISM gauge retreated to a three-month low and, at 48.1, indicates fewer producers adding to payrolls.
Many Americans continue to limit their spending on merchandise as they rotate to services and experiences. Others are simply tightening their belts as still-high inflation takes a toll on their incomes.
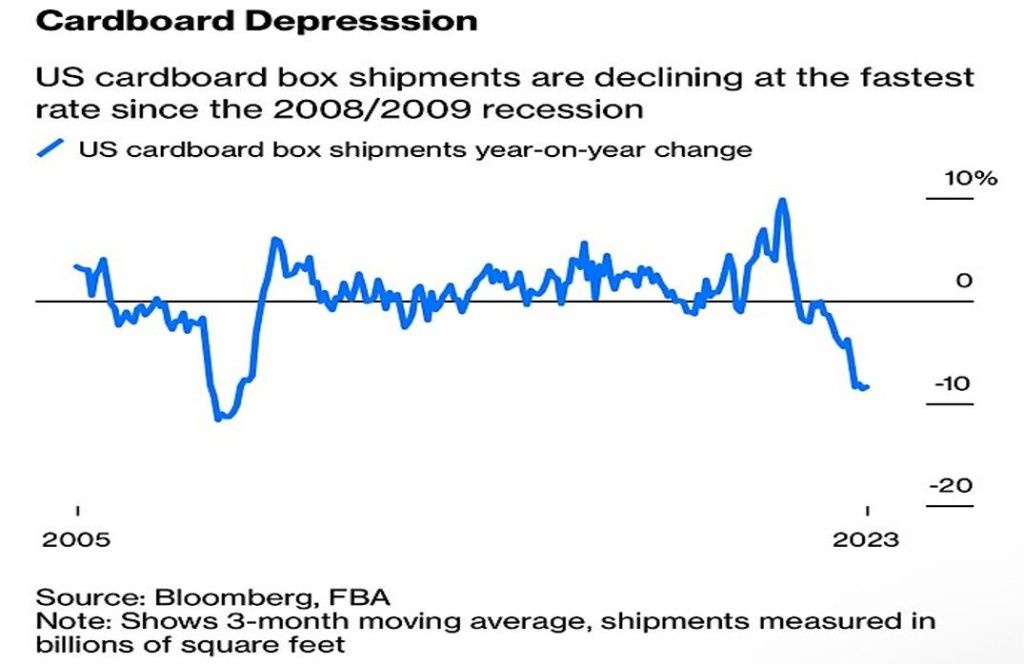
And then we have cardboard box shipments declining at fastest rate since 2008/2009.
At least Ethereum is up over 2% this morning.
And the US Treasury 10Y-2Y keeps on diving deeper into inversion.
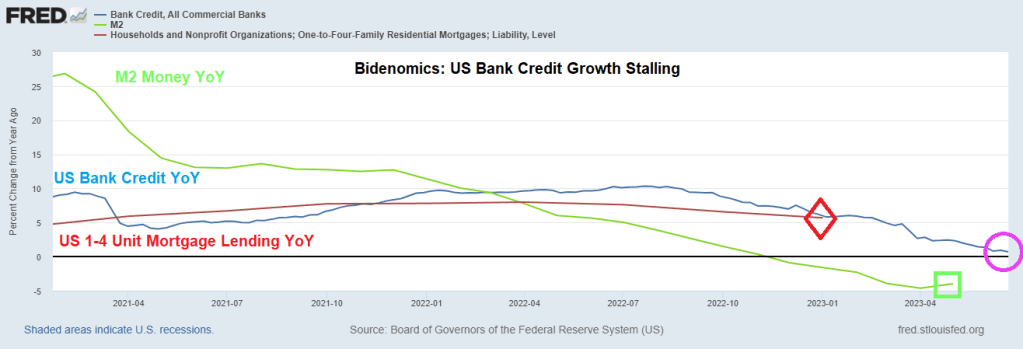
Bidenomics is based on massive Federal spending and massive Fed monetary stimulus. But like all stimulus, it wears off. Such is the case with bank lending as The Fed raises interest rates.
US bank credit year-over-year (YoY) has stalled to a lowly 0.7% rate as M2 Money growth YoY increases slightly to -4%.
Its figures. With the Socialist Federal Reserve manipulating interest rates and Biden/Congress spending like drunken sailors trying to manipuate economic growth, it makes sense that Biden wants to explore Bill Gate’s idiotic idea of blotting out the sun to prevent global warming.
Of course, Biden can hide at any of his 4 mansions and wear his Ray-ban Aviators to avoid the horror of his policies.
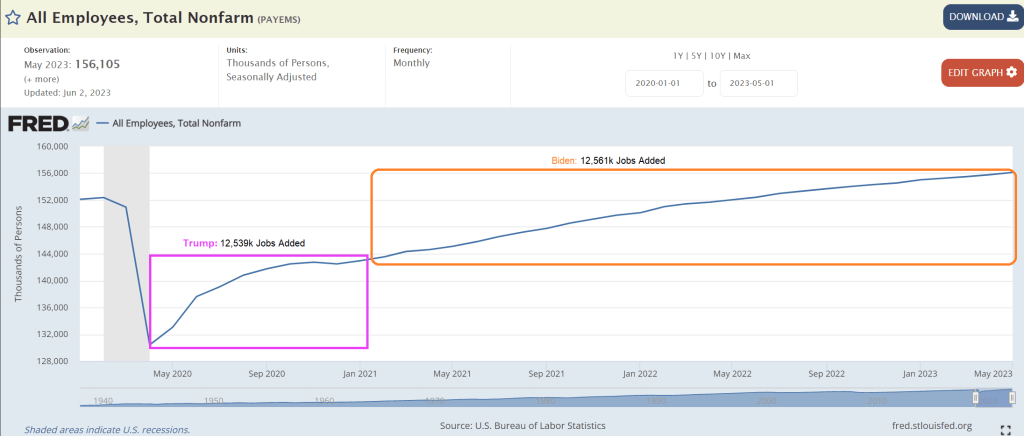
Yes, Resident Biden, our bumbling, corrupt “leader” said “We created more new jobs in two years than any president did in their entire term.” Of course, like almost everything that comes out of Biden’s mouth was a lie.
Actually, the US economy added 12.53 million jobs after April 2020 (Trump) while Bidenomics created took 2 1/2 years to add 12.56 million jobs. So, Biden took over twice as long to create jobs after Covid than it did under Trump. Simply opening the economy and schools produced that magical claim by Biden.
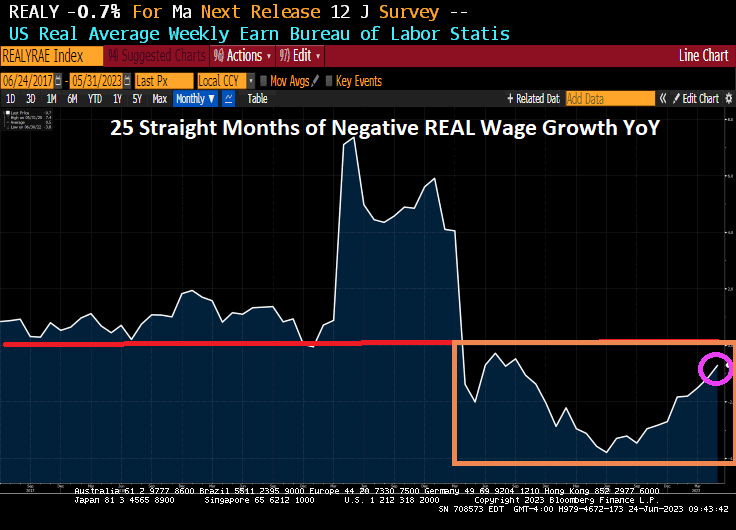
Then we have 25 consecutive months of negative REAL weekly earnings YoY.
And the 10Y-2Y Treasury yield curve is on a decidedly downward trend.
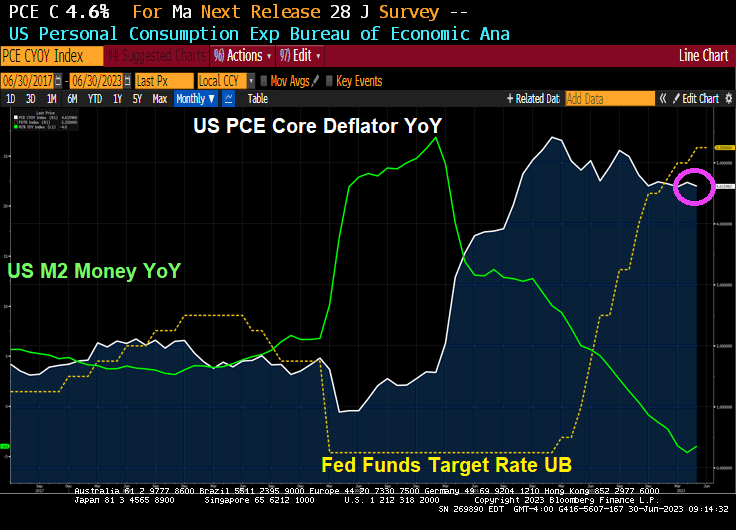
The film “The Core” was a silly film, but core inflation in the US is a serious problem for the middle class and low-wage workers. It remains elevated despite Treasury Secretary Janet “The Marxist Gnome” Yellen saying it was “transitory.” Looks pretty permanent to me!
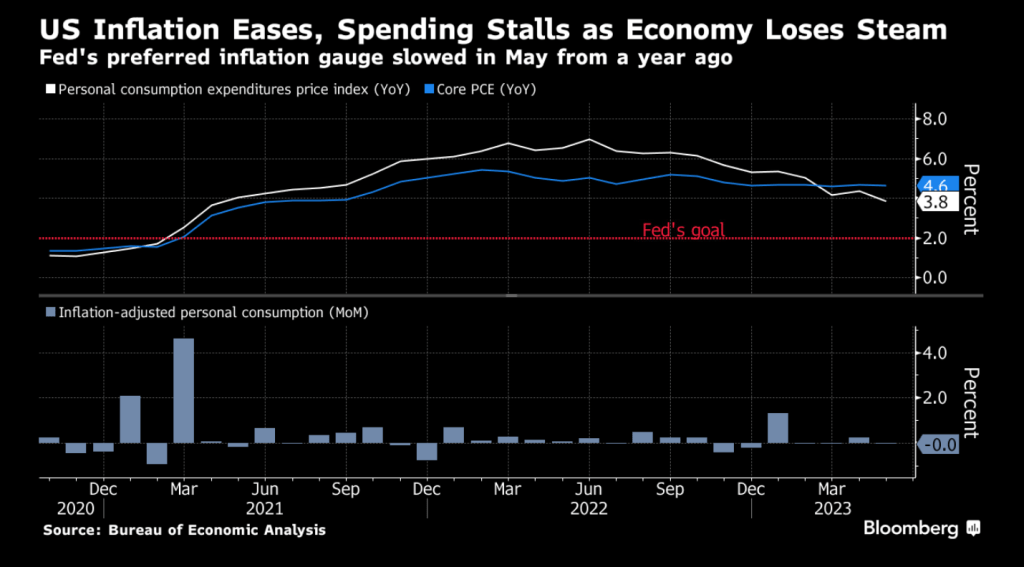
The Federal Reserve’s preferred measures of US inflation cooled (slightly) in May and consumer spending stagnated, suggesting the economy’s main engine is starting to lose some momentum.
The personal consumption expenditures price index rose 0.1% in May, Commerce Department figures showed Friday. From a year ago, the measure eased to the slowest pace in more than two years.
Consumer spending, adjusted for prices, was little changed after a downwardly revised 0.2% gain in April. From February through May, household spending has essentially stalled after an early-year surge. Spending on merchandise dropped, while outlays for services increased.
Excluding food and energy, the so-called core PCE price index increased 4.6% from May 2022. That’s in line with annual readings back to late 2022 and shows minimal relief from elevated price pressures. Economists consider this to be a better gauge of underlying inflation.
Indicator
Actual
Estimate
PCE price index (MoM)
+0.1%
+0.1%
Core PCE price index (MoM)
+0.3%
+0.3%
PCE price index (YoY)
+3.8%
+3.8%
Core PCE price index (YoY)
+4.6%
+4.7%
Real consumer spending (MoM)
0.0%
+0.1%
Under the hood of the government report, a key metric flagged by Fed Chair Jerome Powell showed a welcome slowdown. Services inflation excluding housing and energy services increased 0.2% in May from a month earlier, the smallest advance since July of last year, according to Bloomberg calculations. The figure was up 4.5% from a year ago.
The Taylor Rule now suggests a target rate of 10%. We are just halfway to target!
Meanwhile, Yellen Plans July China Trip, While US Preps Investment Curbs. Trying to convince China that the US won’t default on its $32 TRILLION and growing debt?
Bidenomics is a great marketing ploy where you have out of control Federal spending and magically decide to reopen the economy and school after Covid and focus only on jobs added after Biden was selected President and ignore the jobs added during Trump.
Real gross domestic income (GDI) is a measure of the incomes earned and the costs incurred in the production of gross domestic product. It’s another way of measuring U.S. economic activity. BEA also publishes the average of real GDP and real GDI.
REAL GDI dropped to -0.8% QoQ for Q1 2023. Kind of looks like Bidenomics is running out of gas.
On Biden’s claims that he created twice as many jobs as any other President, the US economy add 12.53 million jobs after April 2020 (Trump) while Bidenomics created took 2 1/2 years to add 12.56 million jobs.
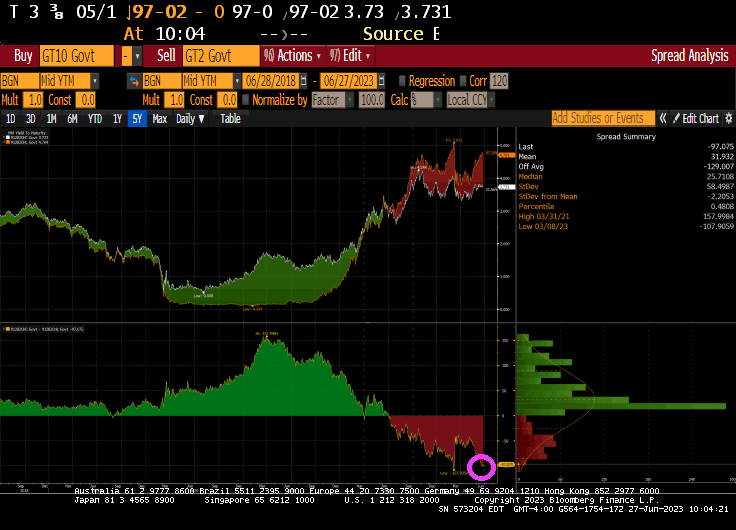
The US Treasury yield curve (10Y-2Y) is now inverted at -103 basis points.
As Fed stimulus wears out, so is the Treasury 10Y-2Y yield curve.
Jay Leno once quipped about the Obama meal. “Order anything you want and hand the bill to the person standing behind you.” Biden, like his boss Obama, is praciticing a similar strategy. Spend like a drunken sailor and just keep borrowing until the whole thing breaks.
The barrage of fresh Treasury bills poised to hit the market over the next few months is merely a prelude of what’s yet to come: a wave of longer-term debt sales that’s seen driving bond yields even higher.
Sales of government notes and bonds are set to begin rising in August, with net new issuance estimated to top $1 trillion in 2023 and nearly double next year to fund a widening deficit. The Treasury is already in the middle of an estimated $1 trillion bump in bills as it seeks to replenish its cash coffers in the wake of the debt-limit deal.
It’s an explosive mix for borrowing costs as debt sales are swelling and the Federal Reserve continues to reduce its balance sheet at a time when traditional buyers of Treasuries overseas are discouraged by currency hedging costs.
“A worsening fiscal profile, amid fairly modest spending cuts, suggests that the upcoming supply deluge will not be limited to T-bills,” wrote Anshul Pradhan, head of US rates strategy at Barclays Plc. “The Treasury will soon need to increase auction sizes meaningfully across the curve. We believe the rates market is too complacent.”
Barclays strategists predict the net rise in coupon-bearing debt from August to year-end will be nearly $600 billion. And that would only ramp up in 2024, they say, with an annual figure of $1.7 trillion. That would be nearly double this year’s expected debt issuance.
Pradhan says he doesn’t think the market appreciates the increase in issuance that’s going to be needed due to wide budget deficits and the fact the Treasury won’t want bills to become a substantial share of the total debt.
Total net new bill sales are set to bring their share of US debt to about 20%, according to JPMorgan Chase & Co. The issuance would hit a threshold seen by the Treasury Borrowing Advisory Committee as the upper limit for the US to fund deficits at the least possible cost to taxpayers.
Bank of America Corp. says the supply deluge could result in a “demand vacuum” for longer maturity bonds that could push yields higher and tighten financial conditions.
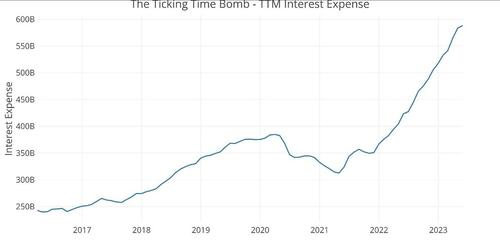
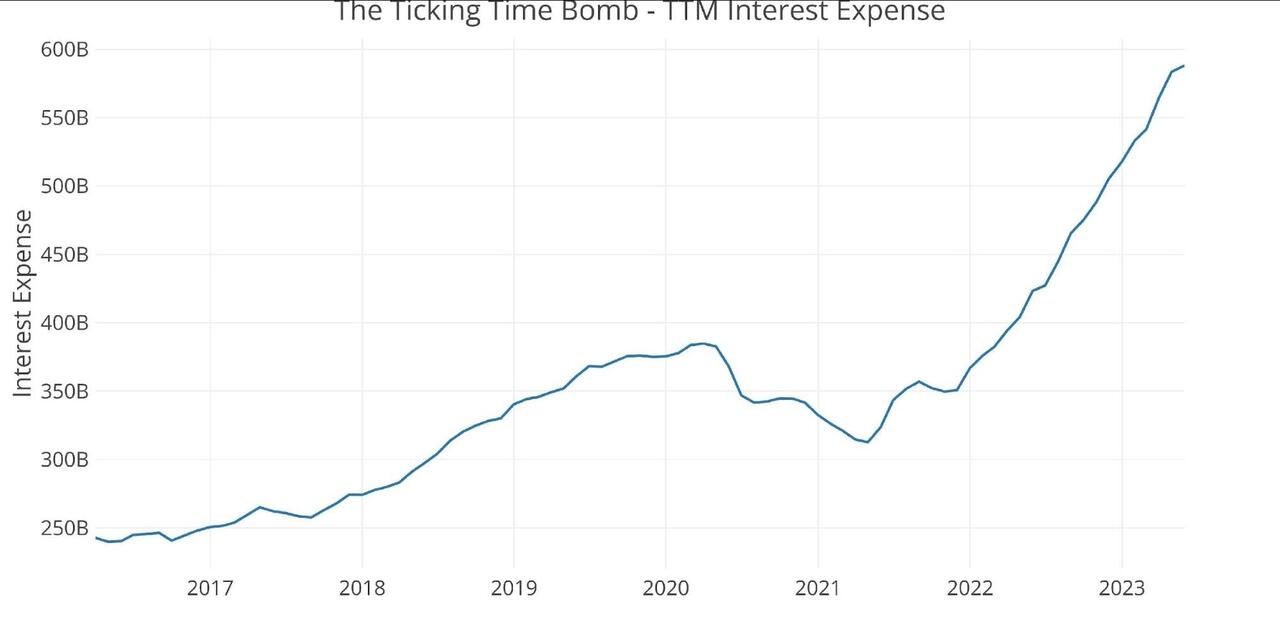
The problem isn’t purely a function of more debt. The bigger issue is that this new debt comes with a much steeper price tag. Interest on the national debt is rising at an alarming clip.
The trailing 12-month (TTM) interest on the debt clocked in at just under $600 billion in May. This was up from $350 billion at the start of 2022, less than 18 months ago. The government has added an extra $250 billion in expenses per year on just debt service.
This is just the beginning of an upward trend. Based on the current interest payments, the Treasury is paying less than 2% interest on the total debt. But a lot of the debt currently on the books was financed at very low rates before the Federal Reserve started its hiking cycle. Every month, some of that super-low-yielding paper matures and has to be replaced by bills, notes and bonds yielding much higher rates. That means interest payments will quickly climb much higher unless rates fall.
Looking at the Treasury sale on June 26 reveals the extent of the problem. The Treasury sold $162 billion in securities, with $120 billion in short-term Treasury bills with high yields.
$58 billion in six-month bills at an investment yield of 5.45%
$62 billion in three-month bills at an investment yield of 5.34%.
$42 billion in two-year notes at a high yield of 4.67%, amid very strong demand. Longer-term yields are still far below short-term yields.
With this flood of Treasury bills, the share of short-term paper underpinning the debt is approaching 20%. That’s considered the upper limit, meaning the Treasury will soon have to turn to issuing longer-term notes and bonds. That means the Treasury will be locking in higher interest rates for the long term.
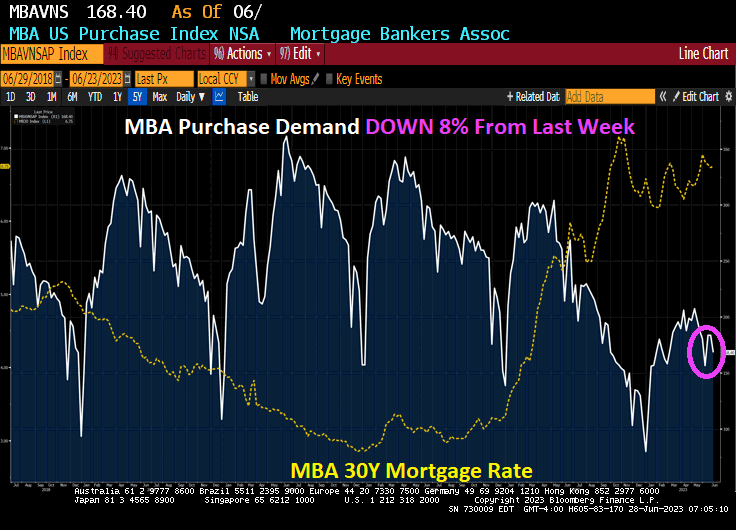
Eggs, bacon and toast. All more expensive under Biden’s economy. And mortgage purchase demand is down -45.3% since Biden was elected and mortgage refinancing demand is down -91% under Biden and mortgage rates are up 128% under Biden’s economy.
Mortgage applications increased 3.0 percent from one week earlier (using seasonally adjusted data), according to the Mortgage Bankers Association’s (MBA) Weekly Mortgage Applications Survey for the week ending June 23, 2023. This week’s results include an adjustment for Juneteenth holiday.
The Market Composite Index, a measure of mortgage loan application volume, increased 3.0 percent on a seasonally adjusted basis from one week earlier. On an unadjusted basis, the Index decreased 8 percent compared with the previous week. The seasonally adjusted Purchase Index increased 3 percent from one week earlier. The unadjusted Purchase Index decreased 8 percent compared with the previous week and was 21 percent lower than the same week one year ago.
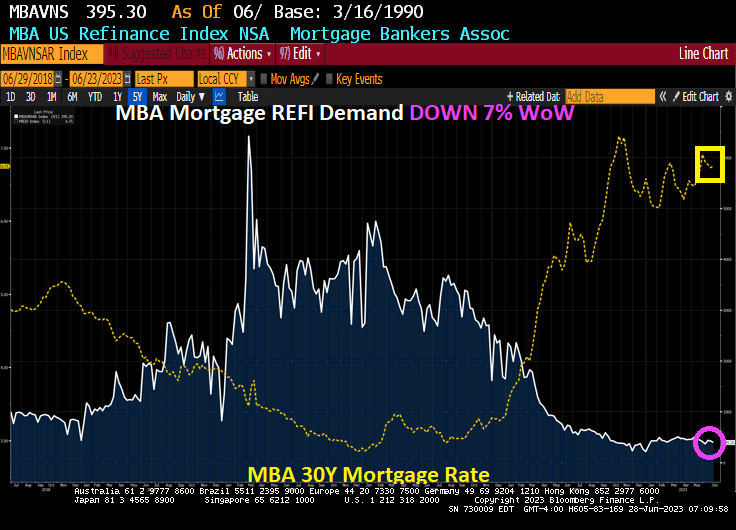
The Refinance Index increased 3 percent from the previous week and was 32 percent lower than the same week one year ago.
Now for the highly (self) touted Biden economy: Mortgage purchase demand is DOWN DOWN -45.3% under Biden, Refi demand is DOWN -91% under Bidenomics, and mortgage rates are UP 128% under Clueless Joe’s Reign of economic error.
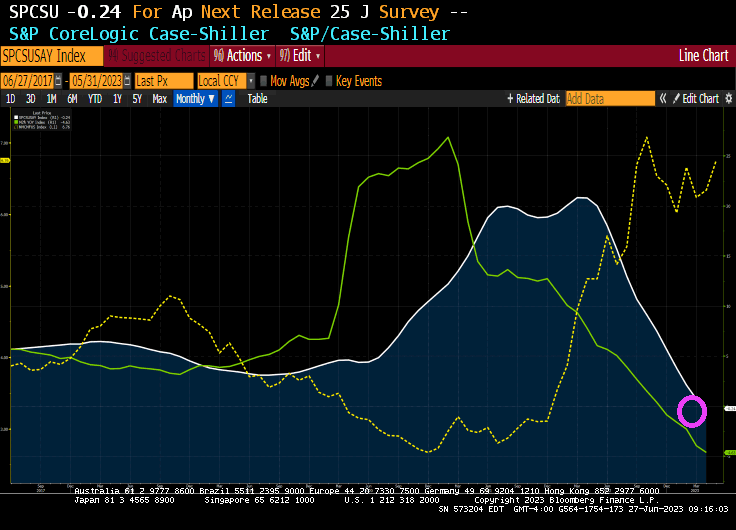
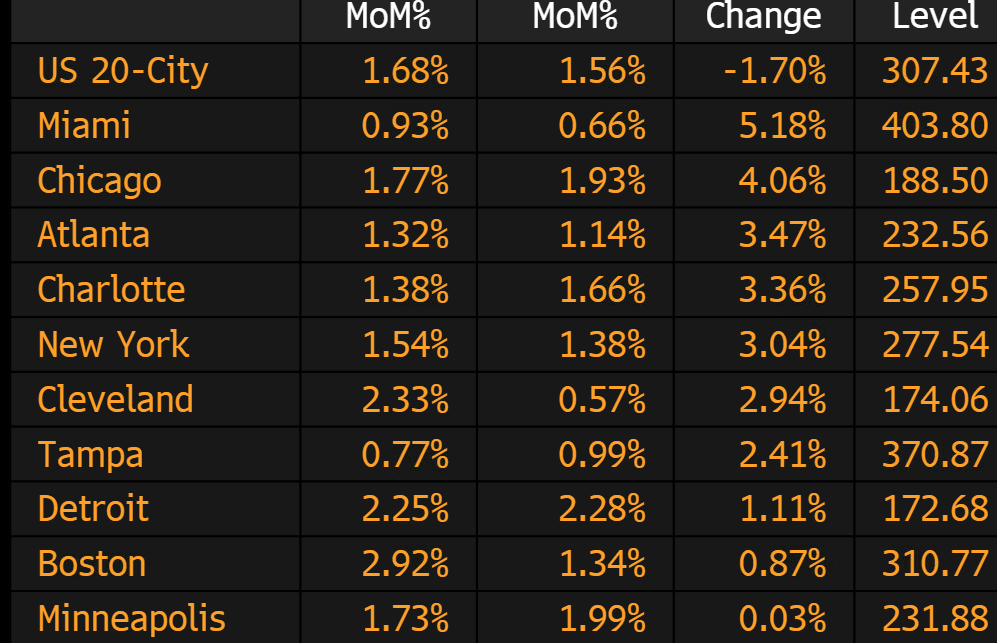
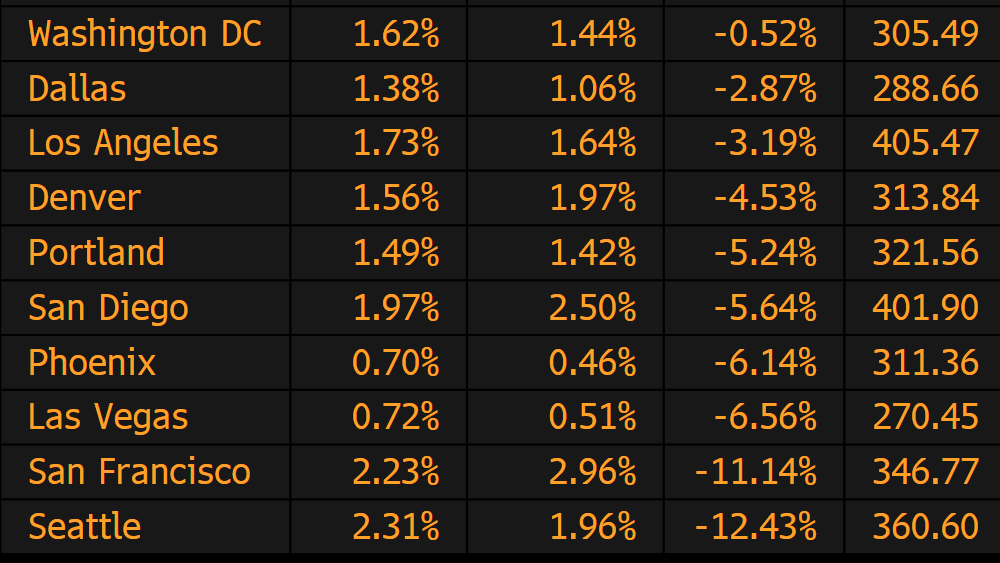
The S&P CoreLogic Case-Shiller U.S. National Home Price NSA Index, covering all nine U.S. census divisions, reported a -0.2% annual decrease in April, down from a gain of 0.7% in the previous month. The 10-City Composite showed a decrease of -1.2%, down from the -0.7% decrease in the previous month. The 20-City Composite posted a -1.7% year-over-year loss, down from -1.1% in the previous month.
The winners in April? Miami and … Chicago?
The biggest losers in April? Seattle and San Francisco both suffered YoY losses over -11%.
The US Treasury 10Y-2Y yield curve remains steeply inverted at -97 basis points.


You must be logged in to post a comment.