As The Federal Reserve is poised to continue it inflation-fighting crusade, the US economy is rapdily approaching DEFLATION. US Producer Price Index FINAL DEMAND fell to 0.1% YoY in June.
Bidenomics, the combination of insane monetary stimulus and insane directed Federal spending towards going green at all costs, is running out of steam. M2 Money growth was last measured to be -4% YoY and the US Dollar is down -8.2% since September 2022.
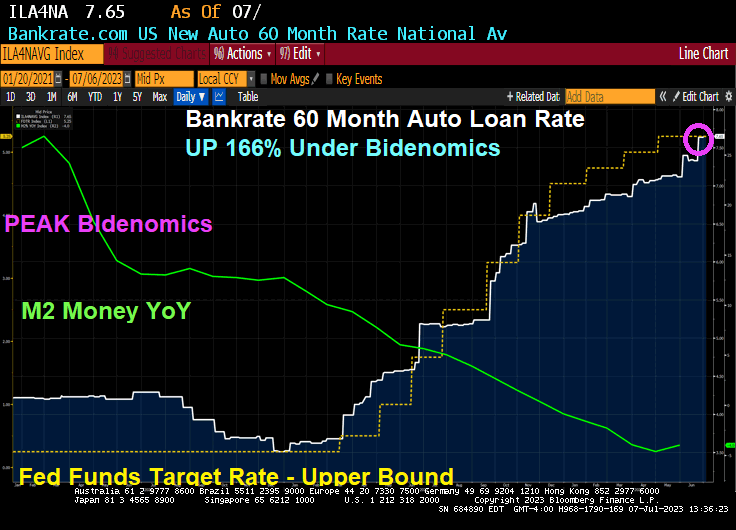
Auto loan rates are now up to 7.65%, a gut-wrenching 166% increase under Bidenomics.
Average monthly payments also reached a new record of $733. That compares with $730 in the first quarter and $678 in the second quarter of 2022. Buyers were financed with an average APR of around 7.1%, the highest since the fourth quarter of 2007.
2 out of every 3 consumers who agreed to a $1,000+ monthly payment in Q2 signed up for an average APR between 8.5% and 9.6%. (via Edmunds).
As for buyers who took on $1,000 monthly auto payments, about 65% of them had an average loan-term range of 67 months and 84 months, their average APR rate was between 8.5% and 9.6%.
Bidenomics. Crushing the soul of America’s middle class and low wage workers.
I love how the most secure building in Washington DC with cameras 24/7 EVERYWHERE and the Secret Service claims they don’t know who left the cocaine on a table. I will bet they pin the blame on VP Kamala Harris as an excuse to replace her word salads for the 2024 Presidential election.
Biden’s massive spending spree (aka, Build Back Better) has a new name: Build Back Bankrupt!
According to Epiq, Commercial Chapter 11 Filings Increased 68 Percent in the First Half of 2023.
NEW YORK – July 03, 2023— The 2,973 total commercial Chapter 11 bankruptcies filed during the first six months of 2023 represented a 68 percent increase over the 1,766 filed during the same period in 2022, according to data provided by Epiq Bankruptcy, the leading provider of U.S. bankruptcy filing data. Individual Chapter 13 filings increased by 23 percent during the same period.
Overall commercial filings registered 12,107 for the first half of 2023, representing an 18 percent increase from the commercial filing total of 10,258 for the first half of 2022. Small business filings, captured as Subchapter V elections within Chapter 11, totaled 814 in the first six months of 2023, a 55 percent increase from the 525 elections during the same period in 2022.
Overall commercial filings increased 12 percent in June 2023, as the 2,123 filings were up from the 1,891 commercial filings registered in June 2022. The 404 commercial Chapter 11 filings in June represented a 9 percent increase from the 371 filings in June 2022. Total Subchapter V elections within Chapter 11, experienced a 111 percent increase from 94 in June 2022 to 198 in June 2023.
“The increase in commercial and individual bankruptcy filings during the first half of 2023 underscores the economic challenges faced by businesses and individuals,” said Gregg Morin, Vice President of Business Development and Revenue at Epiq Bankruptcy. “Our objective is to provide bankruptcy professionals with timely and accurate data necessary for analyzing stakeholder volumes and trends for making informed business decisions.”
Total bankruptcy filings were 217,420 during the first six months of 2023, a 17 percent increase from the 185,352 total filings during the same period a year ago. Total individual filings also registered a 17 percent increase, as the 205,313 filings during the first half of 2023 were up from the 175,094 filings during the first six months of 2022. The 85,390 individual Chapter 13 filings in the first half of 2023 represent a 23 percent increase over the 69,367 filings during the same period in 2022.
All chapters increased in June 2023 compared to June 2022, with 37,700 total bankruptcy filings representing an increase of 17 percent from the 32,198 filed in 2022. Total commercial filings were up 12 percent from 1,891. Total Individuals were up 18 percent from 30,307.
While not the Epiq data, the Bloomberg Corp Bankruptcy Index shows the rise in bankruptcies as The Fed fights Bidenflation.
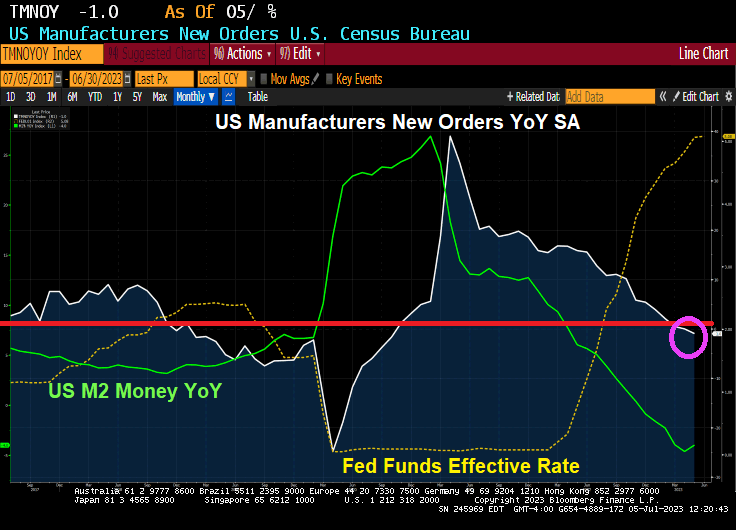
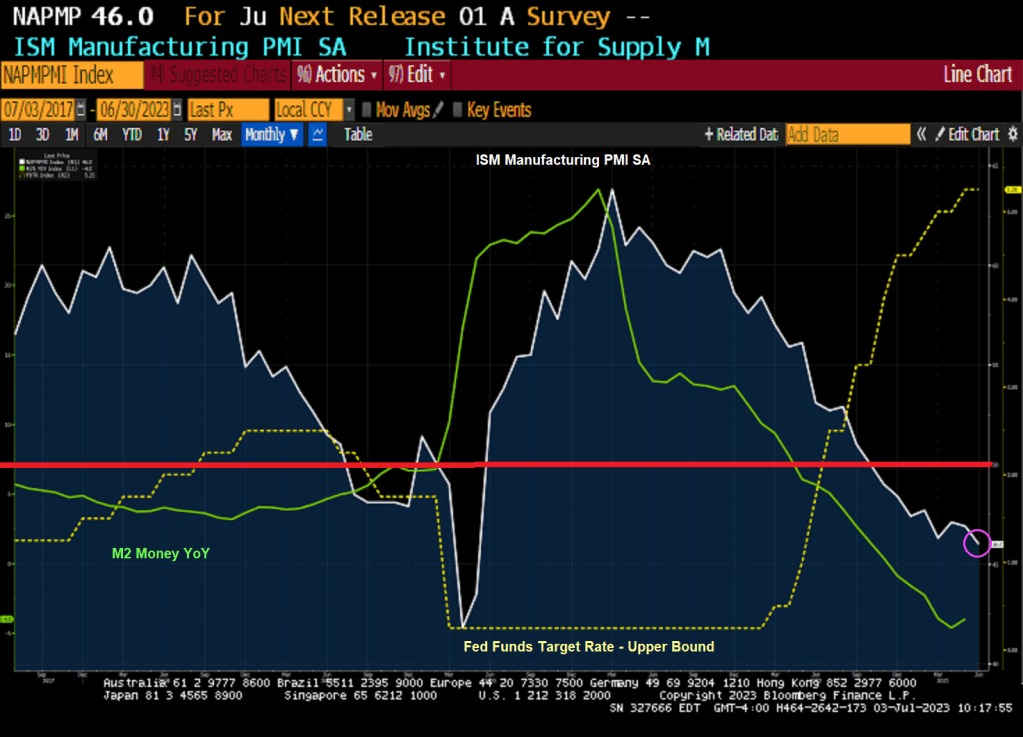
As Powell and The Gang raise interest rates, the more the economy is … slip slidin’ away. US Manufacturers New Orders YoY in May declined -1.0% for the first time since Covid.
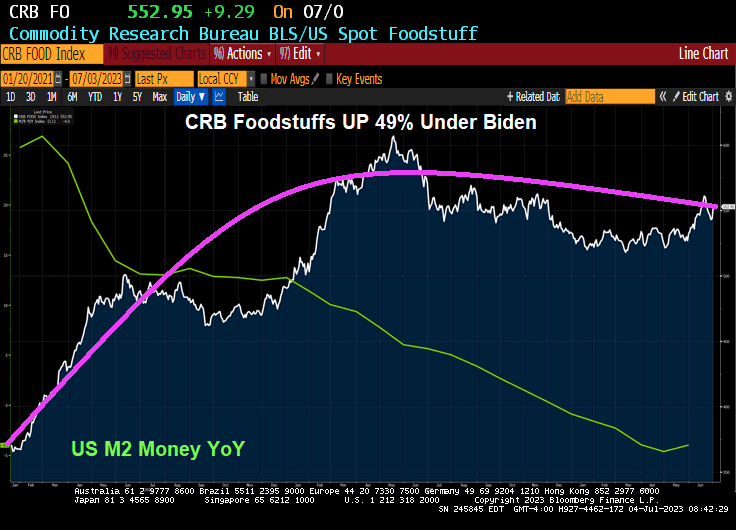
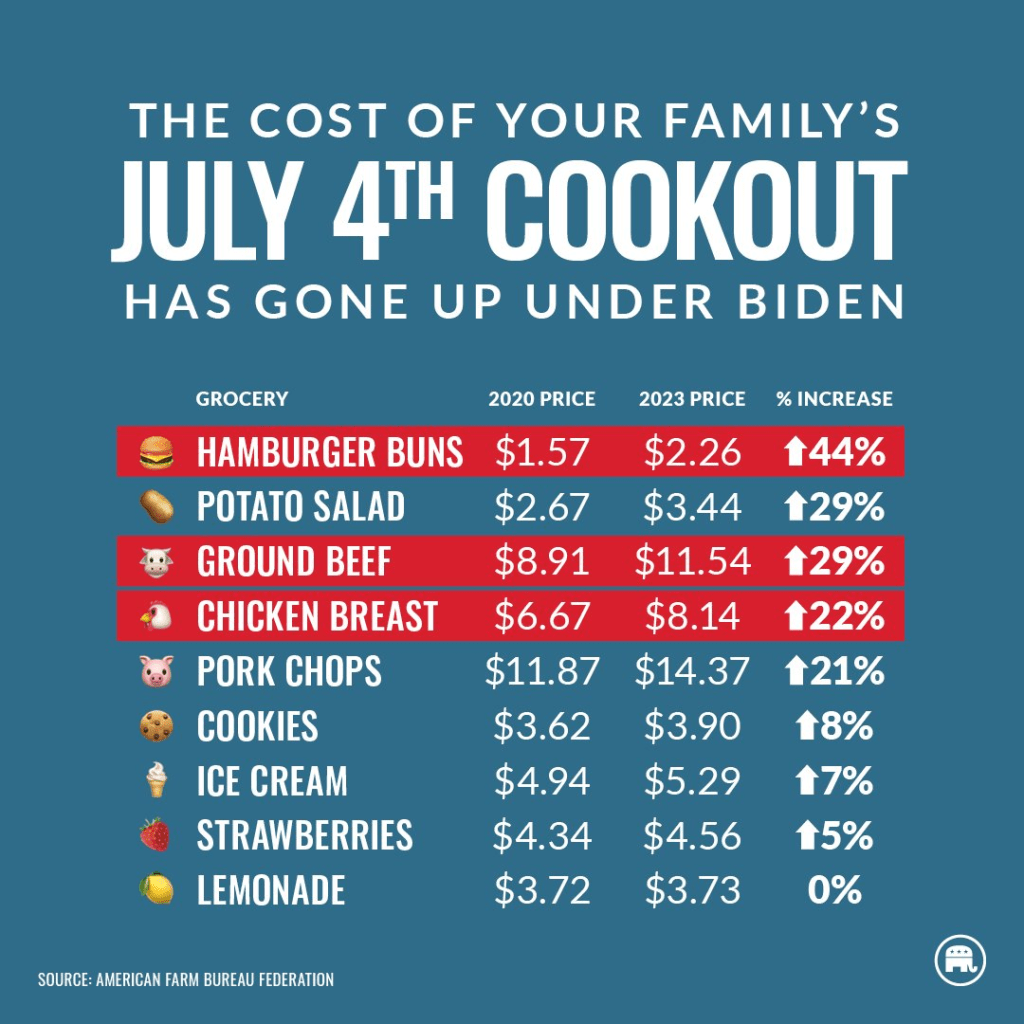
Happy 4th of July! Enjoy those burgers and hot dogs, at least until you consider that food prices have risen a staggering 49% under Biden’s Reign of Economic Error.
The only good news is that The Fed’s monetary stimulus growth is slowing. But don’t worry! Biden and Congress will keep introduce massive spending bills to avert a recession. Which will cause downline inflation.
I was hoping that the week of July 4th would start off with fireworks, but we got bad news about the economy.
US factory activity contracted for an eighth month in June, slipping to the weakest level in more than three years as production, employment and input prices retreated.
The Institute for Supply Management’s manufacturing gauge fell to 46, the weakest since May 2020, from 46.9 a month earlier, according to data released Monday. The current stretch of readings below 50, which indicates shrinking activity, is the longest since 2008-2009.
The decline in the ISM production gauge, which also stands at the lowest level since May 2020, suggests demand for merchandise remains weak. The index of new orders contracted for the 10th straight month and order backlogs shrank, which may help explain a pullback in a measure of manufacturing employment.
The ISM gauge retreated to a three-month low and, at 48.1, indicates fewer producers adding to payrolls.
Many Americans continue to limit their spending on merchandise as they rotate to services and experiences. Others are simply tightening their belts as still-high inflation takes a toll on their incomes.
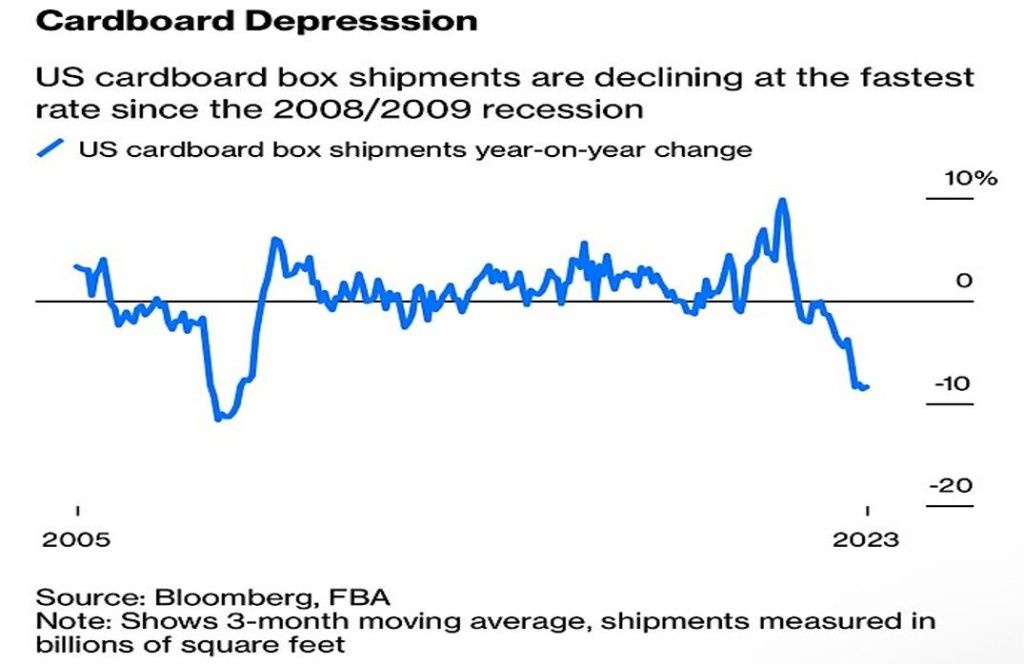
And then we have cardboard box shipments declining at fastest rate since 2008/2009.
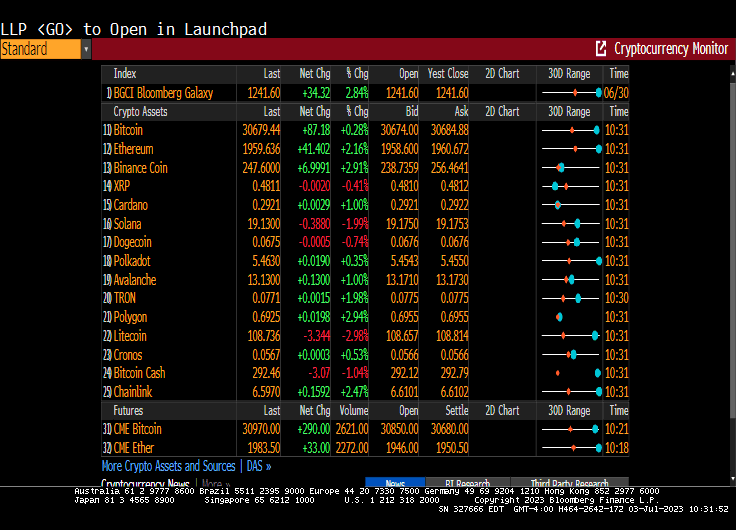
At least Ethereum is up over 2% this morning.
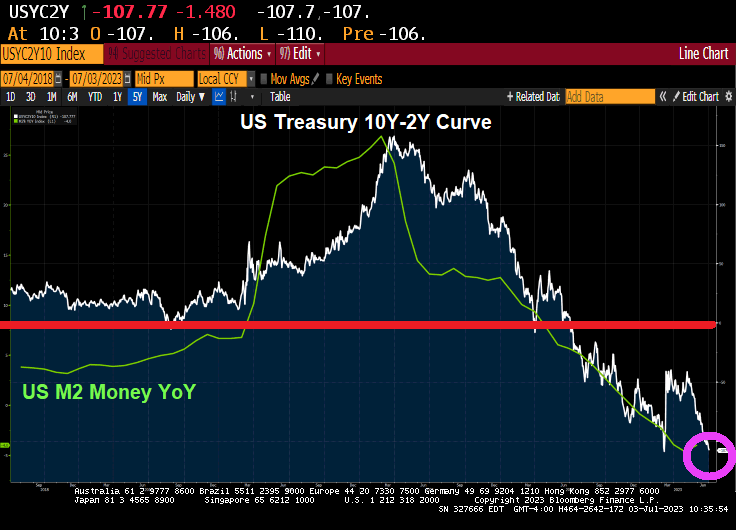
And the US Treasury 10Y-2Y keeps on diving deeper into inversion.
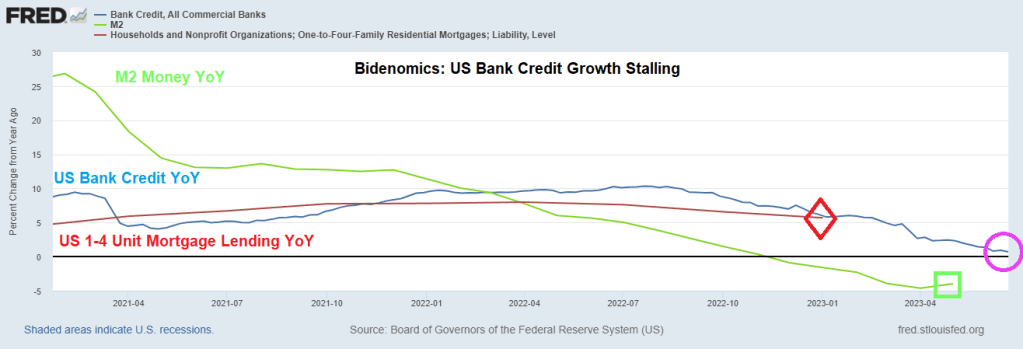
Bidenomics is based on massive Federal spending and massive Fed monetary stimulus. But like all stimulus, it wears off. Such is the case with bank lending as The Fed raises interest rates.
US bank credit year-over-year (YoY) has stalled to a lowly 0.7% rate as M2 Money growth YoY increases slightly to -4%.
Its figures. With the Socialist Federal Reserve manipulating interest rates and Biden/Congress spending like drunken sailors trying to manipuate economic growth, it makes sense that Biden wants to explore Bill Gate’s idiotic idea of blotting out the sun to prevent global warming.
Of course, Biden can hide at any of his 4 mansions and wear his Ray-ban Aviators to avoid the horror of his policies.
The University of Michigan consumer survey results are out and there is good news! Sort of.
The UMich Buying Conditions for Houses rose to 47 in July! That is the good news. The bad news? It was at 142 in the last month before Covid and the economic/school shutdowns.
That is -67% lower than under pre-Covid Trump.
Nothing has been the same since Covid (aka, the Wuhan China Lab virus) where our corrupt politicians and lame street media (aka, government cheerleaders) show no interest in finding out what really happened.
Bitcoin cash is up 21.5% today.
Gold and silver are up today. Too bad I can’t buy nickel coins.
The Walking Dead’s Megan. The honorary symbol of Bidenomics.
The film “The Core” was a silly film, but core inflation in the US is a serious problem for the middle class and low-wage workers. It remains elevated despite Treasury Secretary Janet “The Marxist Gnome” Yellen saying it was “transitory.” Looks pretty permanent to me!
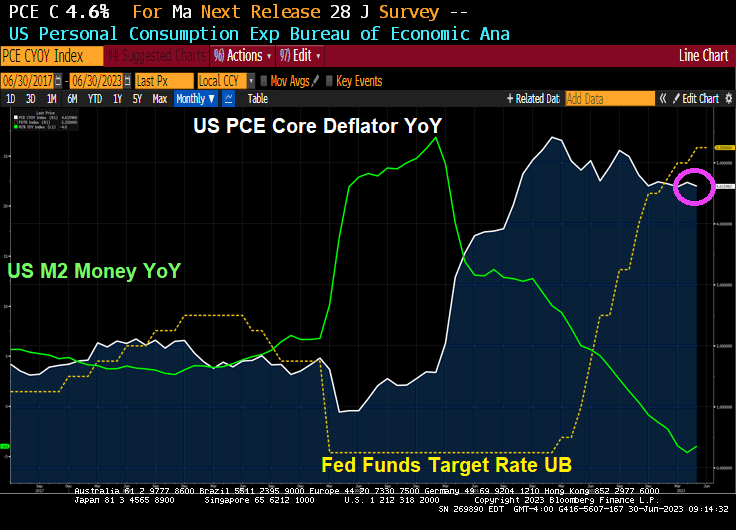
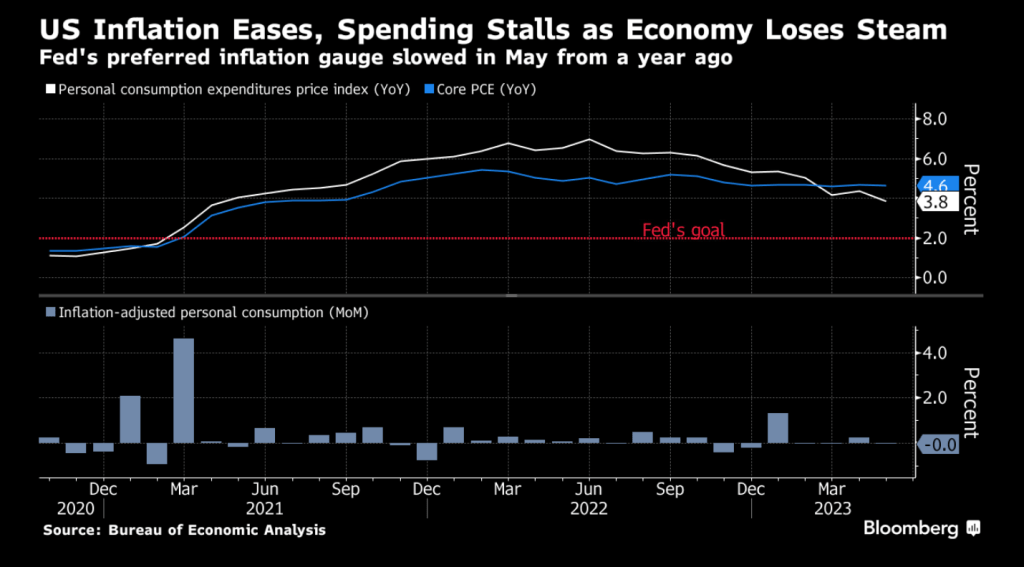
The Federal Reserve’s preferred measures of US inflation cooled (slightly) in May and consumer spending stagnated, suggesting the economy’s main engine is starting to lose some momentum.
The personal consumption expenditures price index rose 0.1% in May, Commerce Department figures showed Friday. From a year ago, the measure eased to the slowest pace in more than two years.
Consumer spending, adjusted for prices, was little changed after a downwardly revised 0.2% gain in April. From February through May, household spending has essentially stalled after an early-year surge. Spending on merchandise dropped, while outlays for services increased.
Excluding food and energy, the so-called core PCE price index increased 4.6% from May 2022. That’s in line with annual readings back to late 2022 and shows minimal relief from elevated price pressures. Economists consider this to be a better gauge of underlying inflation.
Indicator
Actual
Estimate
PCE price index (MoM)
+0.1%
+0.1%
Core PCE price index (MoM)
+0.3%
+0.3%
PCE price index (YoY)
+3.8%
+3.8%
Core PCE price index (YoY)
+4.6%
+4.7%
Real consumer spending (MoM)
0.0%
+0.1%
Under the hood of the government report, a key metric flagged by Fed Chair Jerome Powell showed a welcome slowdown. Services inflation excluding housing and energy services increased 0.2% in May from a month earlier, the smallest advance since July of last year, according to Bloomberg calculations. The figure was up 4.5% from a year ago.
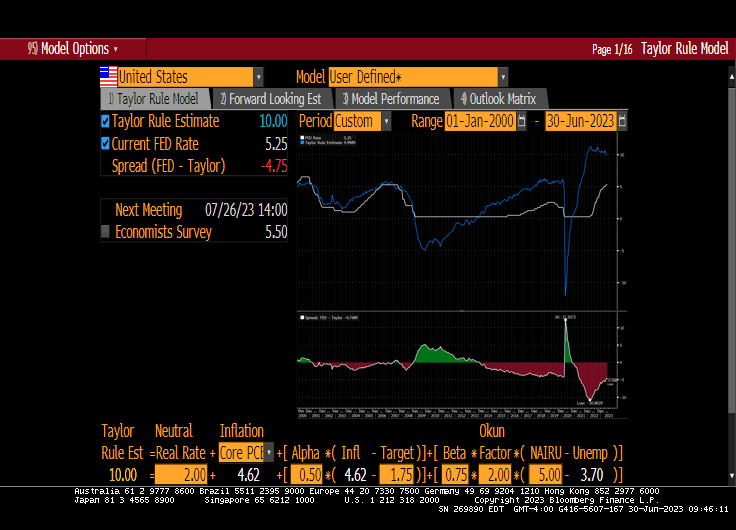
The Taylor Rule now suggests a target rate of 10%. We are just halfway to target!
Meanwhile, Yellen Plans July China Trip, While US Preps Investment Curbs. Trying to convince China that the US won’t default on its $32 TRILLION and growing debt?


You must be logged in to post a comment.