PPI Final Demand Prices Highest In History As 2Y Treasury Yield Declines, Mortgage Rates Steady At 5.14% (All Roads Lead To … Joe And Jay)

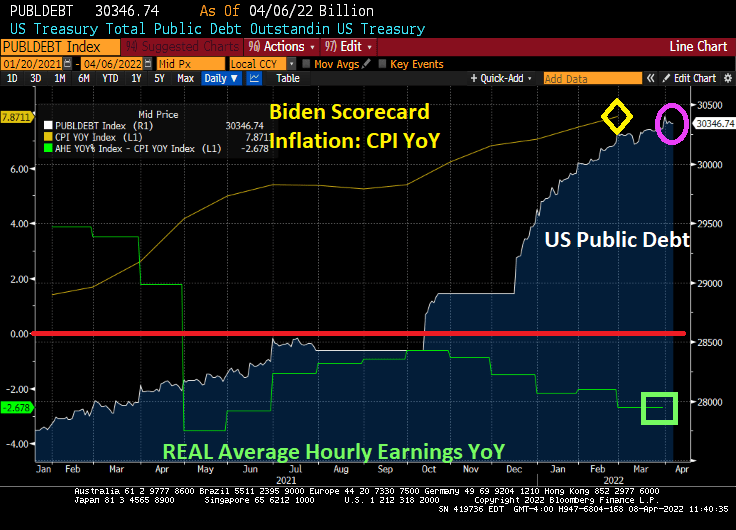
Harry Truman once uttered the phrase “The buck stops here.” Joe Biden’s catchphrase should be “It’s Russia’s fault!”

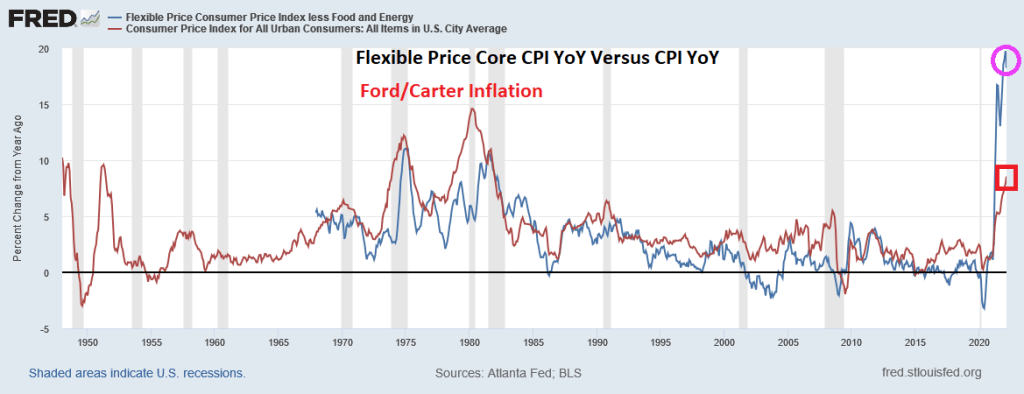
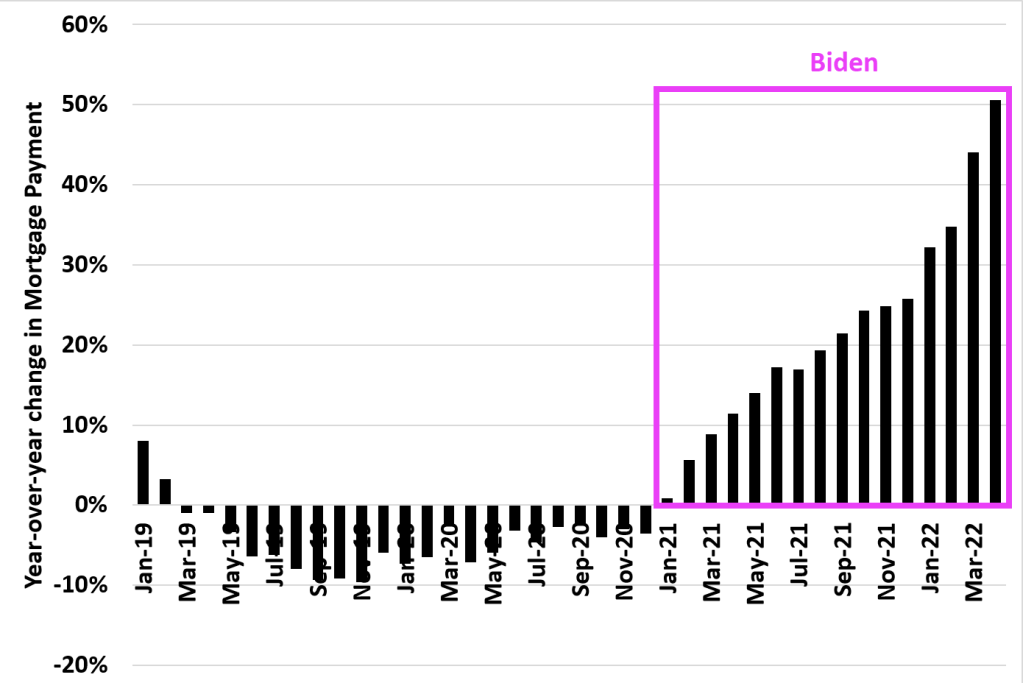
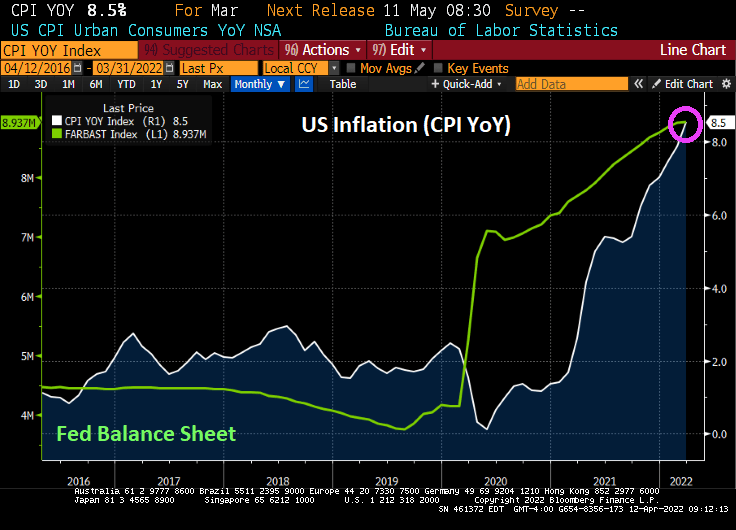
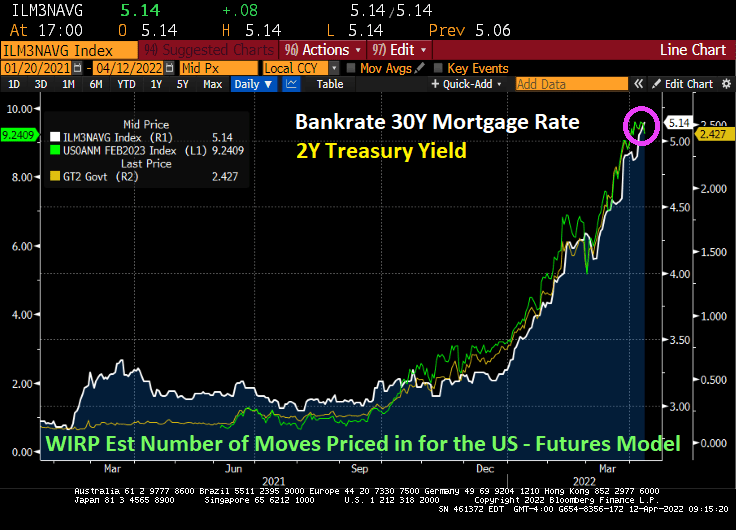
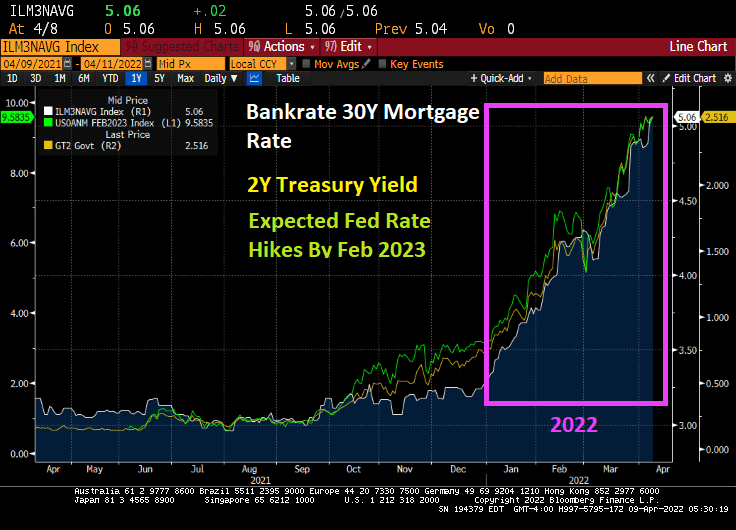
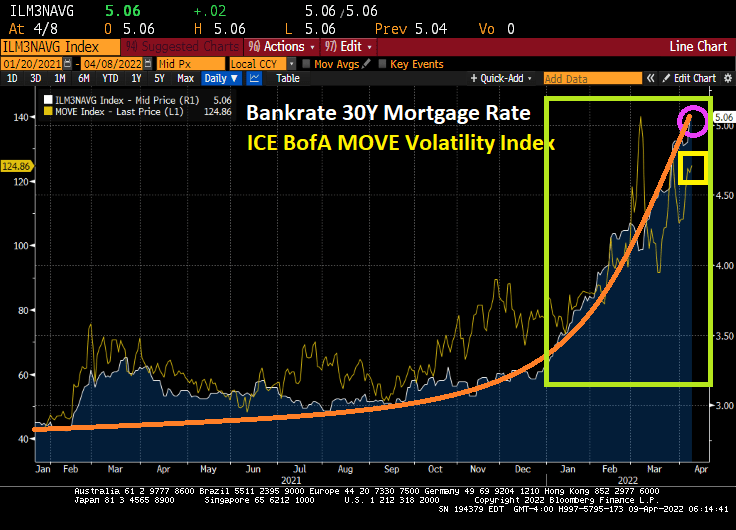
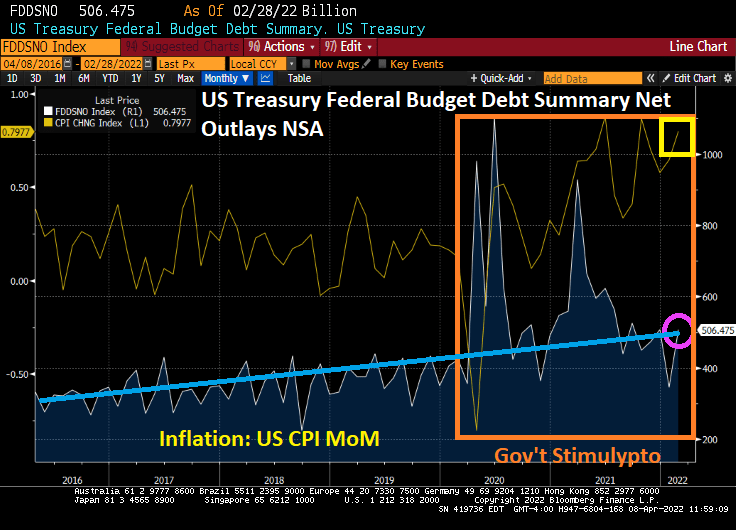
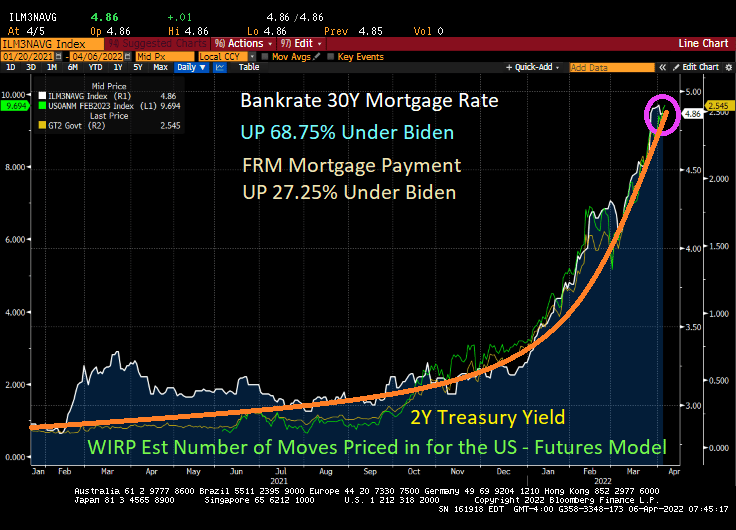
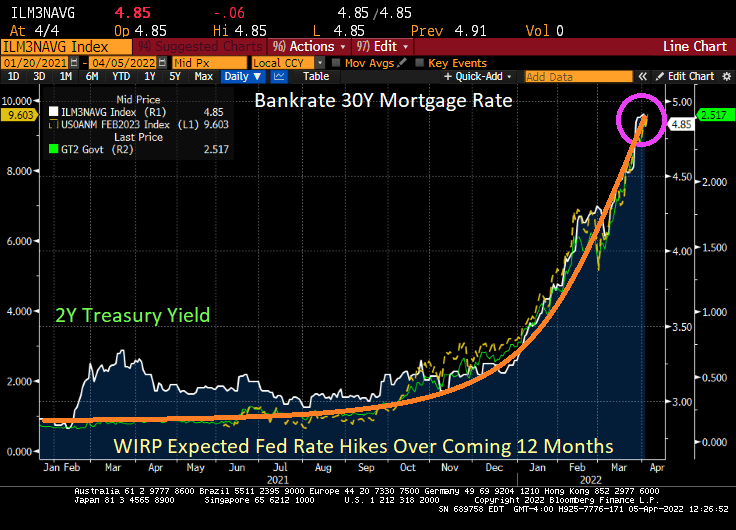
Well, all roads led to Joe and Jay. Here is a chart of Producer Price Index (Final Goods) prices YoY, now the highest in history. At least, gasoline prices are declining to $4.083 (they were $2.40 when Biden was installed as President). But inflation is out of control and the 30-year mortgage rate is now 5.14% (mortgage rates were 2.82% in February 2021 just after Biden took control).

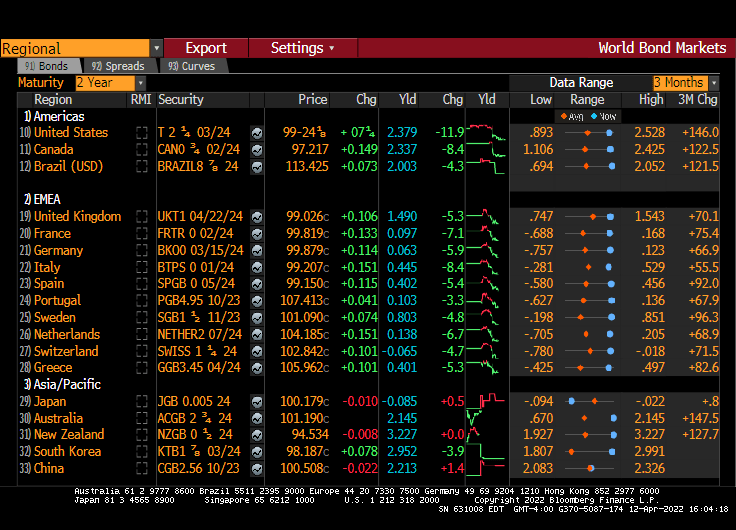
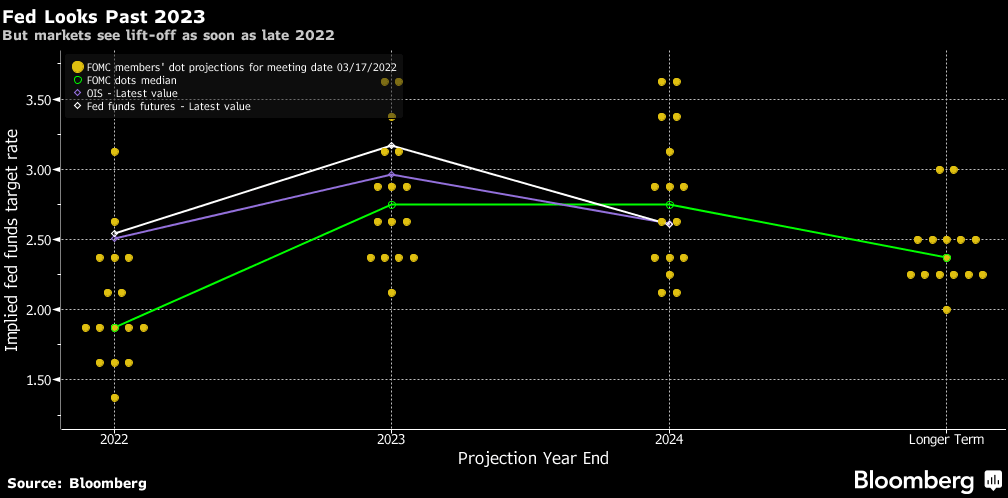
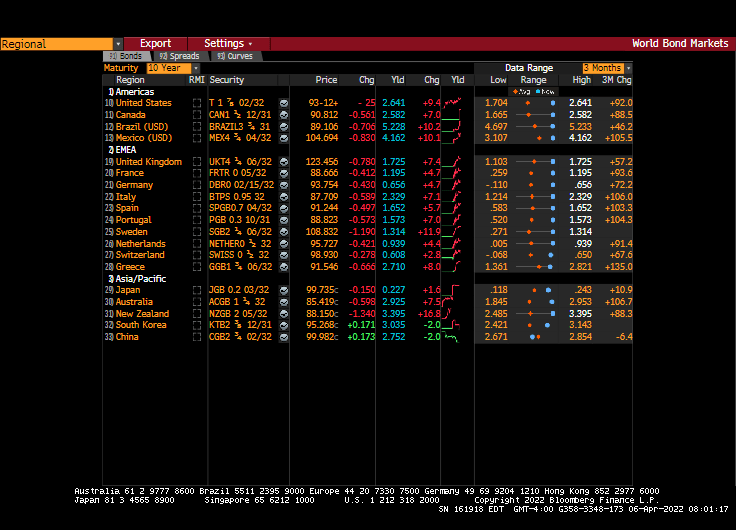
Just in case you wonder why I follow Fed Funds Futures data so closely.

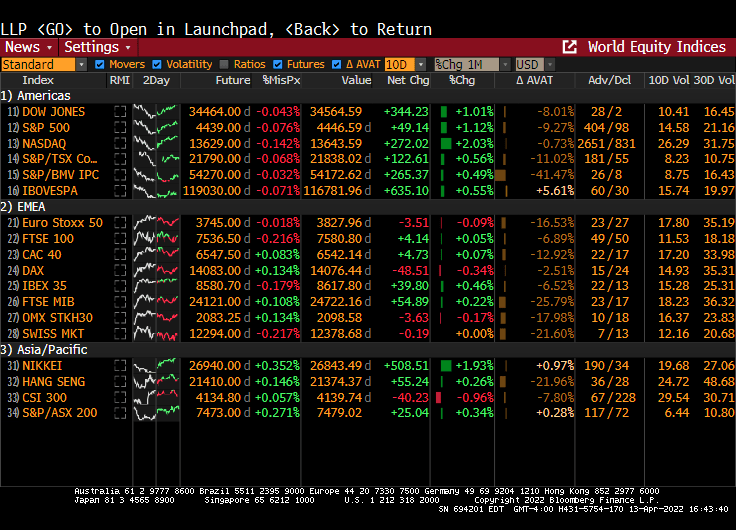
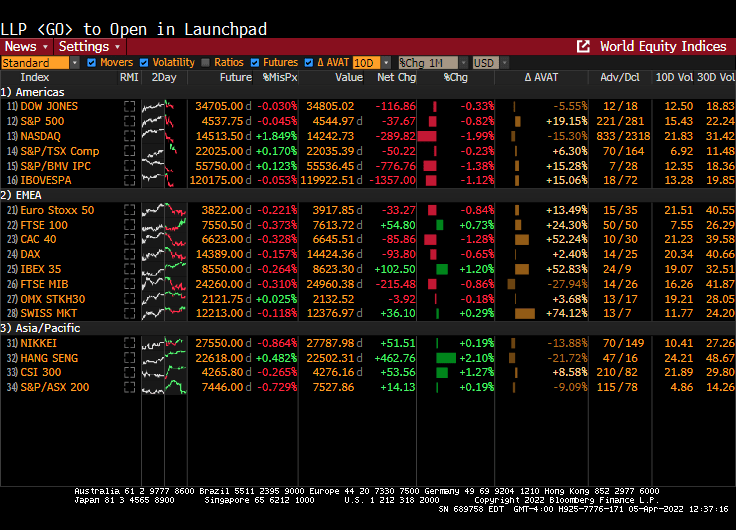
Equity markets are up strongly today as markets sense a weakening in resolve by The Federal Reserve (number of expected rate hikes dropped at 10AM EST).

It appears that we have a “Powell in the headlights” problem.

Fed’s Dual Mandate Derby! Misery Index Hits All-time High (Flexible Price Core Inflation Losses At 21.82% Overwhelming Employment Gains)

The Federal Reserve’s two goals of price stability and maximum sustainable employment are known collectively as the “dual mandate.” Unfortunately, inflation is running away (bad) from employment gains (good). Sort of like “The Good, The Bad and The Ugly.” But just the Good and The Ugly combine to create the Misery Index.

Here is the Atlanta Fed’s CORE flexible CPI YoY for March. The good news? Flexible Core CPI YoY was a little lower than the historic high reading in February. The bad news? We are still talking about 21.82%+ rise in prices (down from 23.56% in February).

If I use the Atlanta Fed’s flexible consumer price CORE index combined with the U-3 unemployment rate, we see that March’s inflation report plus U-3 unemployment is generating a misery index that was last seen in July 2008 during The Great Recession. Unless we consider the July 2021 reading of 31.3%, so we have seen two horrible misery index readings under Biden.

If we look at the Misery Index since 1967, we now have the GOAT (Greatest of All-time) Misery.

Now, inflation under Presidents Ford and Carter (red line) were higher than the flexible core price index (blue line) in the 1970s and 1980. But flexible core price CPI YoY is substantially higher than March’s CPI growth of 8.5%.

The bottom line is that inflation losses are far outweighing the employment gains, resulting in elevated misery.

Misery. We are all feeling it.

Inflation Nation! Real Average Weekly Earnings Growth Lowest Since 2007 (-3.6%) While Mortgage Payments UP 50% (US Treasury 2Y Yield Dumps 12 Basis Points)

Feeling hot, hot, hot! Inflation, that is.

US real average weekly earnings growth YoY is down to -3.60%. That is the lowest since 2007 and is worse than The Great Recession and financial crisis of 2008.

And look at this chart of mortgage payments under Biden. The US was actually experiencing DECLINING mortgage payments YoY in 2019 and 2020. But under Biden’s leadership, mortgage payments have increased by 50% making housing even MORE unaffordable for the middle class and lower-income households.

And now for something kind of scary. The US today suffered a 12 basis point decline in the 2-year Treasury yield, generally a bad sign for the economy. As if we needed more bad news for today.

Highest inflation in 40 years, worst wage growth since 2007 and rising mortgage payments. We will need all the luck we can get.

Bidenflation SOARS To 8.5%, Real Average Hourly Earnings Growth Falls To -3% YoY, Mortgage Rates Rise To 5.14% (The Four Horsemen Of The Inflation Apocalypse?)

The US inflation numbers were released this morning and they are grim. Inflation YoY grew to 8.5%.

With 8.5% YoY inflation, REAL average hourly earnings growth fell to -3% YoY.

And with The Fed intent on extinguishing their part of the inflation, Bankrate’s 30Y mortgage rate rose to 5.14%.

Energy is the biggest culprit (fuel oil up 70.1% YoY) thanks to the double whammy of 1) Russia’s invasion of Ukraine and 2) Biden’s restrictions on oil and natural gas production. Food at home is up 10% YoY.

Here is a colorful chart of MoM growth in prices.

The Taylor Rule model now says that The Fed Funds Target Rate should be 11.90%. Hence, Fed Stimulypto is still in place with the signal that rates will increase.

How about WTI Crude and Brent Crude soaring over 4% today?

Once again, the Four Horsemen of the Inflation Apocalypse (Biden, Powell, Pelosi, Schumer) overstimulated the economy and financial markets with excessive monetary stimulus (Powell) and excessive Federal spending (Biden, Pelosi, Schumer) where demand soared for products and supply naturally hasn’t caught up.

Weekend Update: 2022 A Tough Year For Bonds, Mortgages Tighten, Mortgage Demand Backs Off As Rates Surge (Bond Volatility On The Rise)

2022 has been a tough year for bond investors and the mortgage industry.

Doubleline’s Jeff Gundlach observed that the 2 Year Treasury yield is up 125 bp over the past month or so. I commented that the 2 Year Treasury Yield is up 179 bp since December 31, 2021 and the 30-year mortgage rate is also up 179 bp since the end of 2021. Yes, 2022 has been a dismal year for bonds and the mortgage market.

The ICE BofA MOVE index, a yield curve weighted index of the normalized implied volatility on 1-month Treasury options, has risen in 2022 along with the 30-year mortgage rate as the normally dormant Federal Reserve finally waking-up and trying to fight inflation.

Mortgage demand backs off due to anticipated Fed rate hikes.

The latest Fed Dots Plot reveals that Fed Open Market Committee members are expecting Fed Funds rate increases in 2023, but remaining the same in 2024 (FOMC median projection). Then falling in the longer term.

With home prices and rents soaring with Federal Reserve stimulus, let’s see how home prices and rents react to The Fed raising rates. My models forecast a slowdown in late summer 2022 to 6% home price growth YoY as The Fed actually implements their quantitative tightening.

Inflation? CPI YoY is the highest in 40 years and FLEXIBLE Core CPI is 20% and the highest since … Lyndon B. Johnson was President (the flexible price index only goes back to 1968). Actually, Flexible Price inflation is even higher than it was under LBJ. Perhaps this is one of those accomplishments that Biden staffer are complaining never gets discussed.

On a side note, Sheila Bair has stepped down as CEO of government mortgage giant Fannie Mae.

The Financial House is a Rockin’ … but not in a good way.

Can The Fed ACTUALLY Tighten Monetary Policy? Or Is This ANOTHER Fed Policy Error? We’ve Got A BAD Case Of Unaffordable Housing

Can The Federal Reserve ACTUALLY tighten monetary policy? Let’s look at the facts.

Under Biden, we have seen inflation rise from 1.4% to 7.9% (the latest inflation numbers will be out Monday). And we have seen Treasury public debt rise from $27.8 trillion to $30.346 trillion (actually, $30.371 trillion in real-time). Meanwhile, REAL average hourly earnings are declining. Well done, Washington DC! You deserve the Washington Redskins Commanders.

With real GDP growth less than 1%, a war raging in Ukraine, and 20% flexible price growth, the US economy is in a shambles, relying on The Federal government and The Federal Reserve to continues its insane level of spending and stimulus.

I am going against the box on this one and think The Fed will back off by summer when they realize that they have made another in a long line of policy errors.

Doctor, doctor (Yellen, US Treasury Secretary), we’ve got a bad case of UNAFFORDABLE HOUSING thanks to BAD government policies.

Biden’s Fastest Economic Recovery In History? Or Recession? Flexible Inflation Rate Hits 20% And Q1 GDP Stalled At <1% (Real Average Hourly Earnings Dive To -2.72% YoY) As Fed Drive Rates Up

Government response to COVID in the form of business shutdowns resulted in massive job losses, then as governments opened the economy up again, job gains were incredible. The Hill had an article discussing the whipsaw in jobs entitled “Biden is delivering the fastest economic recovery in history. Why hasn’t anyone noticed?”

Well, the US have gone from “fastest economic recovery in history” to real GDP growth of less than 1% (Atlanta Fed GDPNow for Q1). In addition, the flexible price CPI less food and energy is a whopping 20%.

You can see “The Biden Miracle!” in the following chart. Hires (red line) dropped with Covid shutdowns, then spiked when governments opened economies again. Throw in the trillions of Federal government Covid stimulus and trillions in Fed monetary support, the Biden Miracle sees less like a miracle and more like an extremely expensive way to add jobs. But the interesting problem facing the Administration is the massive spike in job openings relative to hires (again, governments opening-up plus Federal Stimulypto).

Now for a real downer of a chart. Inflation is so toxic that REAL average hourly earnings YoY is down -2.72%. Hardly the best economic growth in history.

Now we have Jerome Powell and The Blackhearts threatening quantitative tightening starting in May. Here is The Fed’s theme song “We love printing money.”

But The Fed is already slowing the growth of monetary base, although this Fed Stimulypto is still growing much faster than pre-Covid.

At least the 10Y-2Y Treasury curve is back above 0 bps as the Atlanta Fed’s GDPNow Q1 forecast falls to under 1%.

Remember, The Fed is planning on shrinking the balance sheet by $95 billion. The Fed’s balance sheet is just shy of $9 trillion. Which is around 1% per month.

With rising expectations of Fed quantitative tightening (QT), residential mortgage rates keep climbing.

Despite a slowing economy teetering on recession and a war raging in Europe, The Fed is tightening monetary policy. Allegedly to fight red-hot inflation.

Alarm! Treasury 10Y Term Premium Remains Deeply Negative As Fed Plans Its Attack On Mortgage Rates And Treasury Yields (3M TBill/OIS Spread Crashes As 30Y Mortgage Rate Is -3%) Venezuela 2Y Yield At … 436.77%

Alarm!

The 10-year Treasury term premium, the amount by which the yield on a long-term bond is greater than the yield on shorter-term bonds, remains steeply negative (white line) as The Federal Reserve steps up its attack (aka, monetary tightening). Meanwhile, the 10Y-2Y curve actually rose into positive territory.

Historically, the 10-year Treasury Term Premium declines before a recession.

Meanwhile, 3 month Treasury bill to Overnight Indexed Swaps spread is crashing to the lowest level since 2017.

But with inflation raging at the fastest pace in 40 years, the REAL 10-year Treasury yield remains negative at -5.236% while the REAL 30-year mortgage rate is -3.01%. Both were in positive territory when Biden was installed as President.

Speaking of interest rates, the infamous PIGS (Portugal, Italy, Greece, Spain) are all seeing surges in their 10-year sovereign yields. Sweden, while not a PIG has the largest spike today at 13.8 BPS.

Actually, the biggest spike in sovereign yields occurred in Ukraine where their 2-year yield popped +205.8 BPS. But Lebanon has the highest 2-year yield at 162.29%. Turkey is in third place in the sovereign demolition derby at 23.52%. Sadly, Poland’s 2-year yield is up 16 bps today.

But the winner of the sovereign debt demolition derby is …. drumroll … VENEZUELA! At 436.77%.

I am really surprised that Biden hasn’t adopted Maduro’s fashion sense.

Going Down! Mortgage Rates Keep Rising, UP 68.75% Under Biden While Mortgage Payments UP 27.25% As Mortgage Applications Decline 6.3% From One Week Earlier

Mortgage applications are going down as expectations of monetary tightening send mortgage rates soaring.

Mortgage applications decreased 6.3 percent from one week earlier, according to data from the Mortgage Bankers Association’s (MBA) Weekly Mortgage Applications Survey for the week ending April 1, 2022.

The Refinance Index decreased 10 percent from the previous week and was 62 percent lower than the same week one year ago.

The seasonally adjusted Purchase Index decreased 3 percent from one week earlier. The unadjusted Purchase Index decreased 3 percent compared with the previous week and was 9 percent lower than the same week one year ago.

Bankrate’s 30-year mortgage rate rose only slightly today to 4.86%, but the 30-year mortgage rate has risen 68.75% and a fixed-rate mortgage payment has risen 27.25% under Biden.

The rest of the story? The adjustable rate mortgages (ARMs) remain at only 6.8% of loan origination volume despite being almost 150 basis points lower in rate (4.90 FRM versus 3.38% 5/1 ARM).

Meanwhile, US Treasury yields rose again with the 10-year yield rising almost 10 basis points … again.

And President Obama spoke at The White House defending his healthcare initiative, The Affordable Care Act. It seems that Nancy Pelosi, Amy Klobuchar, Jame Clyburn and the others were thrilled to see Obama back in The White House. So much so that Biden was abandoned on stage and left to wander aimlessly around.

When Fed Gov Brainard Talks, Markets Listen! Brainard Says Fed Will Shrink The Balance Sheet At A Rapid Rate (10Y Treasury Yield Rises 16 BPS As Nasdaq Falls 300 PTS) Mortgage Rates Will SOAR!!

When Federal Reserve Governor Lael Brainard speaks, markets listen

Federal Reserve Governor Lael Brainard said the U.S. central bank will continue to tighten policy methodically and shrink its balance sheet at a rapid pace as soon as May. 

Brainard’s hawkish remarks sent bond prices crashing and 10Y bond yields up over 16 bps.

While Bankrate’s 30Y mortgage rate is down slightly today, the surge in the 10Y and 2Y Treasury yields could push mortgage rates above 5% by tomorrow,

Even Europe is feeling Brainard’s wrath. Italian 10Y sovereign yields are up almost 20 bps.

The NASDAQ index is down 300 points on Brainard’s utterance.

Gee thanks Lael from all us wanting to finance the purchase of a house.

Brainless and Brainard.