Bidenomics, which is also Yellenomics (the former Fed Chair and current Treasury Secretary) has The Good, The Bad and The Ugly to say for it.
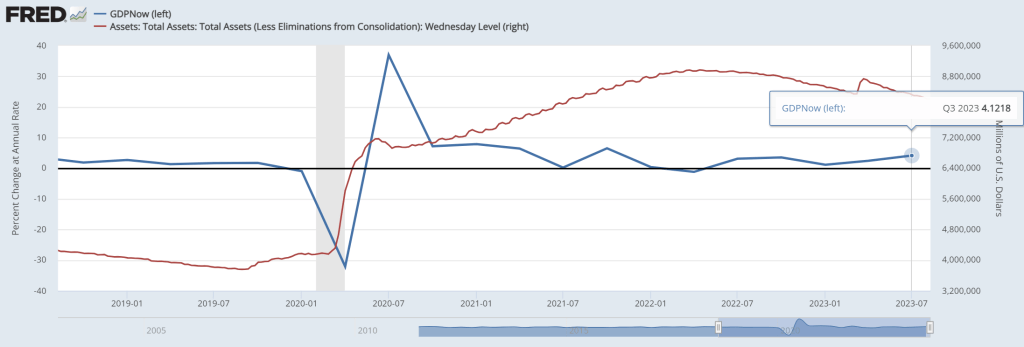
First, The Good! The Atlanta Fed’s GDP Now real time GDP tracker has Q3 GDP at … 4.12%. Pretty good, but bear in mind that there is still more than $8 trillion in Fed Monetary Stimulus outstanding (aka, Yellenomics).
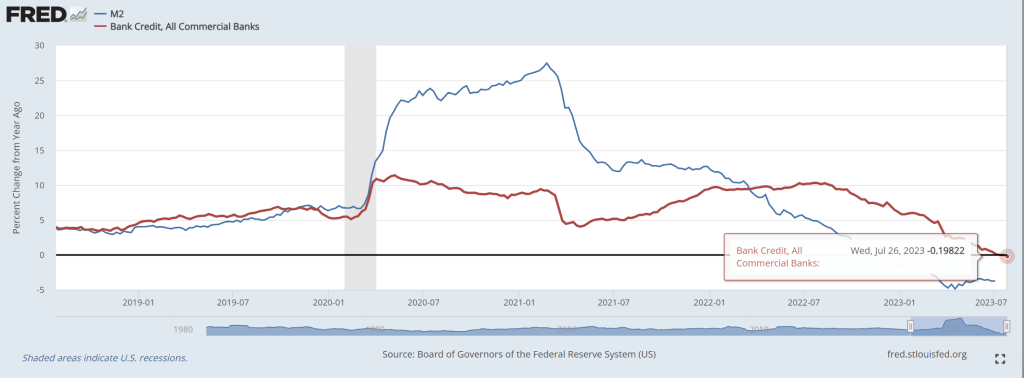
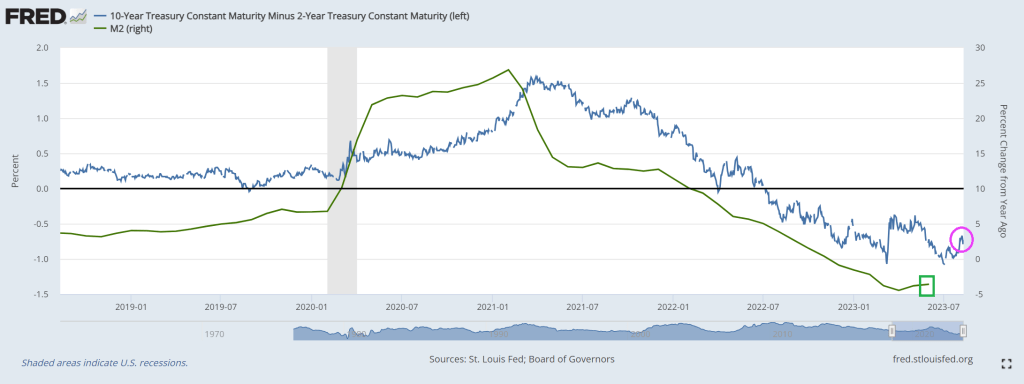
Second, The Bad. Bank credit growth is now negative.
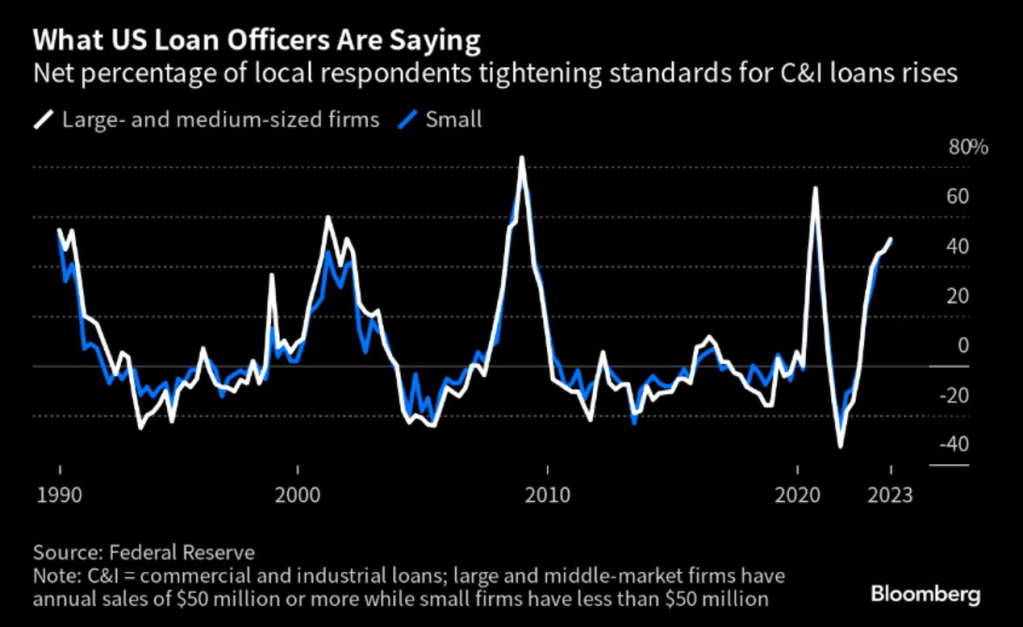
As lenders are tightening credit standards for commercial and industrial loans.
The ugly? There are several candidates for this dishonor.
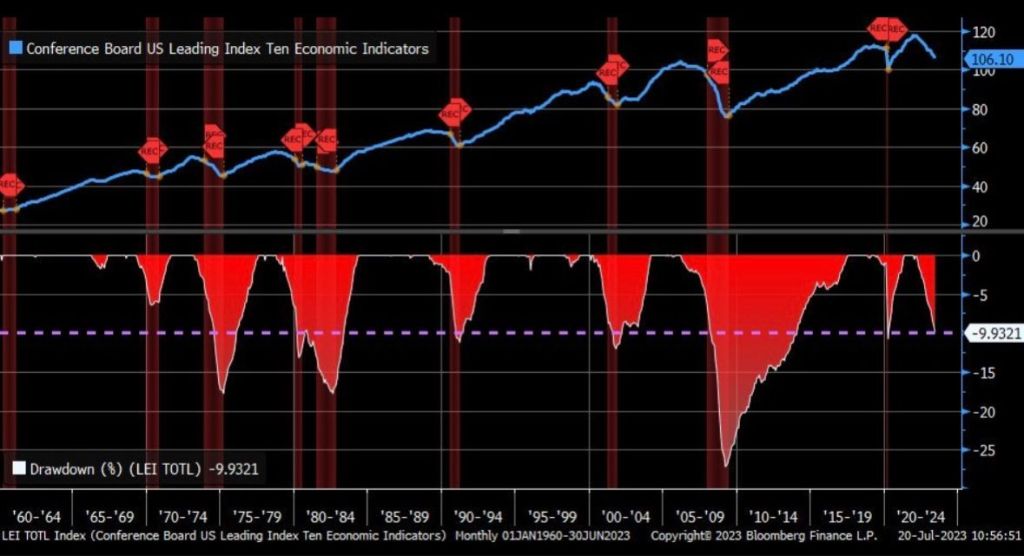
One, The Conference Board’s leading economic indicators is down -10.
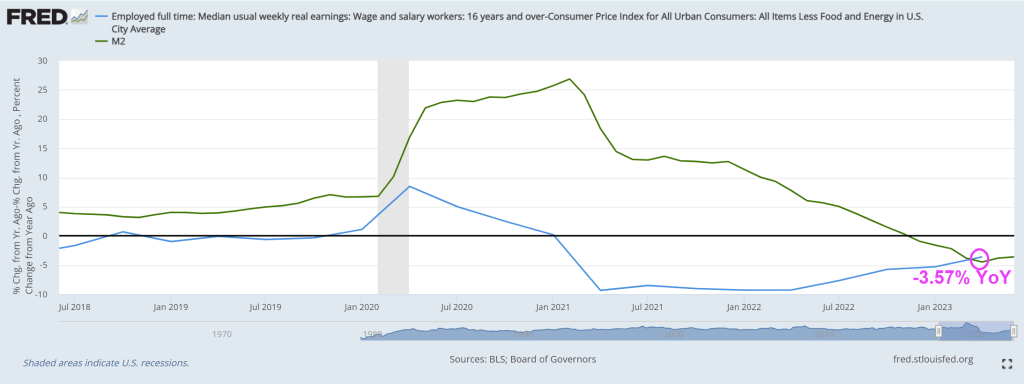
Two, REAL median weekly earnings growth remains negative at -3.57% YoY.
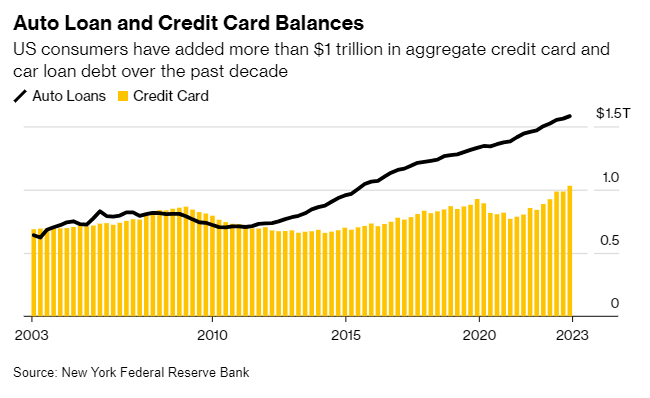
Third, auto loan and credit card balances are at $1.5 TRILLION making further consumer credit more difficult to finance GDP growth.
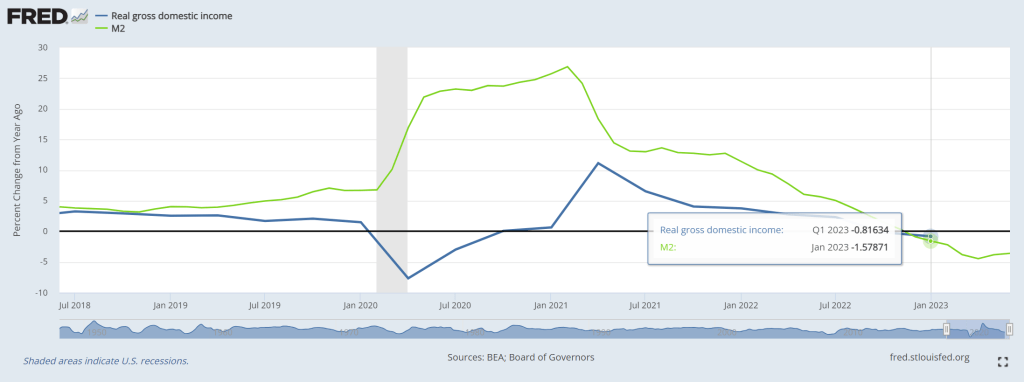
Fourth, Real Gross Domestic Income growth was negative in Q1 2023.
I could go on and on about the negatives of Bidenomics (e.g., massive distortion of Federal spending towards green energy and big donors). Isn’t the earth moving closer to the Sun in its elliptical orbit?? HOW is spending trillions on green energy work as we move closer to the Sun??
During the COVID-19 pandemic the occurrence of remote work jumped, out of sheer necessity. The technology was already available, but the pandemic accelerated its adoption and bypassed the hesitation of employers to allow people working from home. In many cases, remote work has been successful and therefore seems to have become a permanent feature, often in hybrid form. For employers, it has become an employee benefit to attract people in a tight labor market and it saves on office space costs. The flipside of the latter is that demand for office space has seen a structural downward shift. It is estimated that the underlying value of office space in New York City has permanently declined by 39%. This suggests that at current prices, there is a bubble in commercial real estate. In this special we are particularly interested in the implications for financial stability and the economic outlook. First we take a look at the development of commercial real estate prices and commercial real estate lending. Then we discuss the Fed’s recent stress test on large banks that included a large decline in commercial real estate prices. In contrast to the Fed’s exercise, we show that distinguishing between large and small banks provides a sharper picture of the vulnerabilities in the US economy. In particular, the connection between commercial real estate and small banks, through commercial real estate lending, could pose a threat to financial stability and make a recession worse.
Commercial real estate heading south
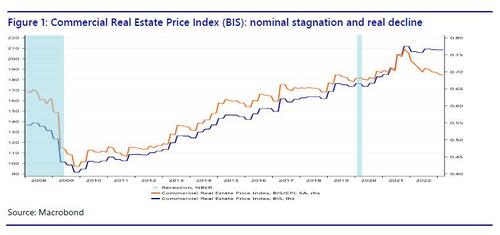
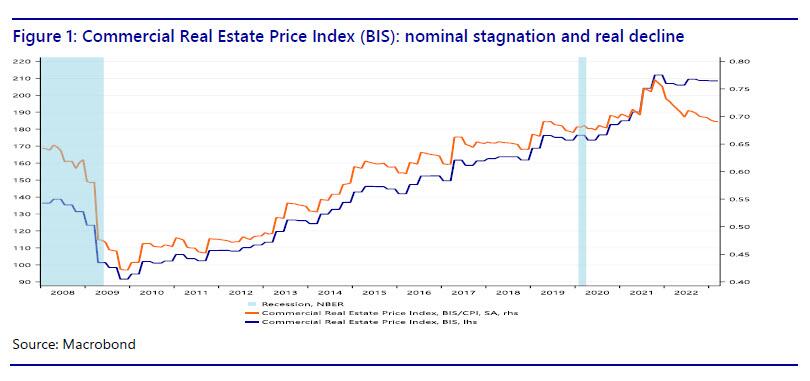
If we plot the BIS commercial real estate price index, it is clear that since the Great Recession, commercial real estate (CRE) prices have more than doubled in nominal terms (the blue line in Figure 1), but have moved sideways since 2021. This suggests that prices have reached a plateau. However, in recent years inflation has obscured the movement of CRE prices in real terms (the orange line), which shows a peak in 2021, but since then there has been a decline, almost to the level during the COVID-19 pandemic. In other words, CRE prices are already failing to keep up with inflation. Is this an indication that the CRE bubble is already deflating? With nominal CRE prices remaining elevated, most of the nominal price correction is likely still to come. If the 39% estimate by Gupta et al. for New York City is representative for the entire United States, we are heading for a major decline in CRE prices.
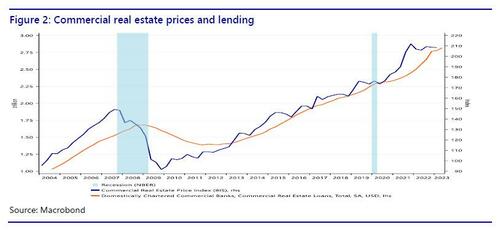
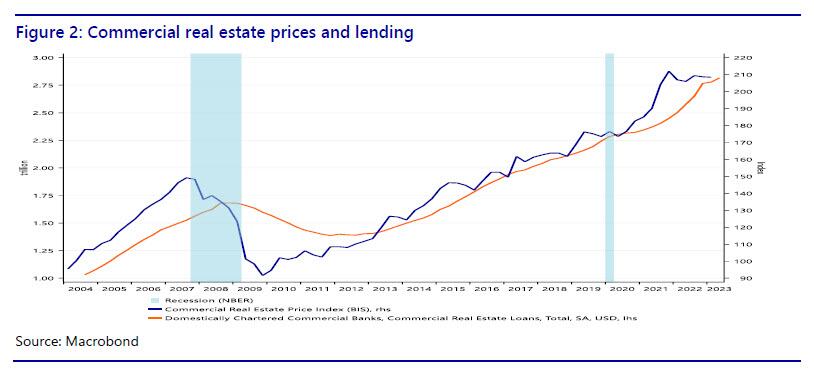
We can also plot the BIS index against CRE lending to show3 that rising prices for commercial real estate sparked a credit boom in commercial real estate (Figure 2). Given the academic literature linking financial crises to credit booms and busts, this should be cause for concern. Moreover, Minsky (1986) notes that an emphasis by bankers on the collateral value and the expected values of assets (instead of cashflows) is conducive to the emergence of a fragile (as opposed to a robust) financial structure.
If excess demand for office space pushed up commercial real estate prices, and if that increased CRE lending by banks, what does a structural downward shift in demand for office space mean? If CRE prices are deflating, what does that mean for the indebted CRE sector? Is this going to lead to defaults? And what does that mean for the banks that did the CRE lending? Is the deflation of the CRE bubble a threat to financial stability? Also note that due to the steep hiking cycle by the Fed, some companies in the CRE sector may find it difficult to refinance their loans at substantially higher rates.
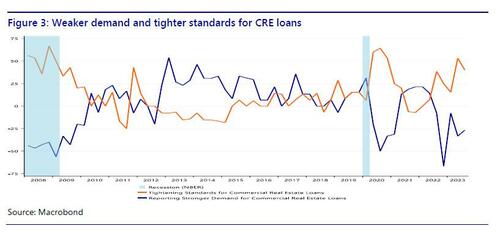
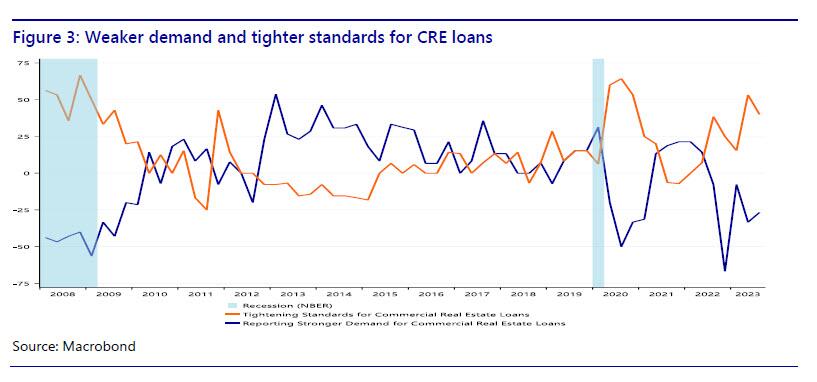
We can dig deeper by looking at the demand and supply developments in CRE lending. If we look at the Fed’s SLOOS data (figure 3), it is clear that demand for CRE loans strengthened especially between 2012 and 2017. Lending standards loosened between 2012 and 2015. This era coincides with a strong rise in the CRE price index, which may have motivated banks to expand CRE lending. Demand for CRE loans weakened during the pandemic, then bounced back as the economy reopened, but headed south again in 2022. Loan standards tightened during the pandemic, then loosened again when the economy rebounded, but have tightened since 2021. In other words, there seems to be a correlation between CRE prices and demand and supply developments in CRE lending. Currently, both are heading south, if we look at CRE prices in real terms and CRE lending in terms of net demand. It seems that rising CRE prices sparked a credit boom in CRE and now that the CRE price bubble is deflating, the CRE sector has less appetite to borrow and banks are tightening their lending standards.
The Fed’s incomplete stress test
CRE prices are falling in real terms and credit for the CRE loans is tightening. Does this pose a problem to the economy? Not if we believe the Fed’s June 28 press release that accompanied the annual bank stress test. The stress test looked at “a severe global recession with a 40 percent decline in commercial real estate prices, a substantial increase in office vacancies, and a 38 percent decline in house prices. The unemployment rate rises by 6.4 percentage points to a peak of 10 percent and economic output declines commensurately.” However, according to the Fed “all 23 banks tested remained above their minimum capital requirements during the hypothetical recession.” Therefore, the central bank concluded that “large banks are well positioned to weather a severe recession and continue to lend to households and businesses even during a severe recession.” However, one line in the press release reveals the main problem with the Fed’s stress test: “The banks in this year’s test hold roughly 20 percent of the office and downtown commercial real estate loans held by banks.” So where is the remaining 80%? If the stress test considers a huge decline in commercial real estate prices, it might be relevant to know how this affects the banks that hold 80% of the CRE loans made by banks. Therefore we take a closer look at CRE lending by large and small banks in the next section.
Bank lending: large vs small banks
We already saw in figure 2 that the rise in CRE prices until 2022 was accompanied by an increase in CRE lending. However, there is more to this story of we take a closer look at who has been doing the lending. So far we looked at aggregate bank lending to the CRE sector, without distinguishing between different types of banks. However, a closer look at the banking sector reveals a disturbing vulnerability that could be a threat to financial stability.
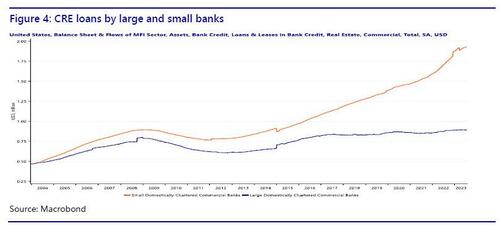
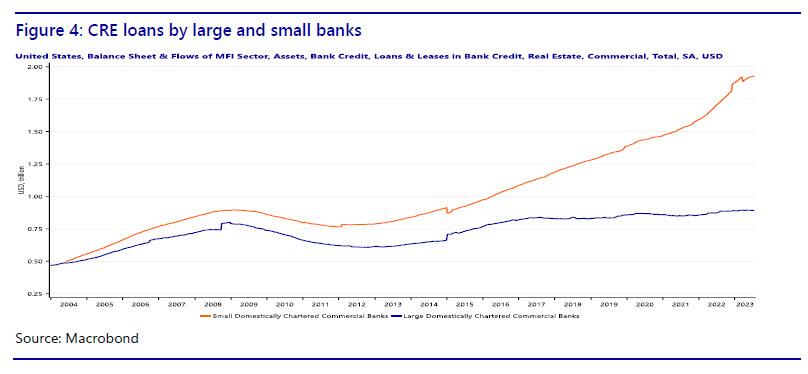
The Fed data on commercial banks distinguish between large and small banks. Large domestically chartered commercial banks are defined as the top 25 domestically chartered commercial banks ranked by size. Small domestically chartered commercial banks are defined as all domestically chartered banks outside of the top 25. Note that according to this definition a bank of say $80 billion would still be considered ‘small.’ In figure 4 we show how CRE lending has evolved, distinguishing between large and small banks.
It turns out that CRE lending by large banks has hardly increased in the last 15 years, while at the same time CRE lending by small banks has more than doubled. In other words, the growth in loans to commercial real estate has come from small banks. In fact, small banks have taken over the role of main provider of commercial real estate loans. Therefore, the Fed’s stress test omits the most relevant part of the banking sector for commercial real estate. While commercial real estate lending by large banks has remained stable since 2006, commercial real estate lending by small banks has increased rapidly. We could even talk of a credit boom in commercial real estate loans provided by small banks.
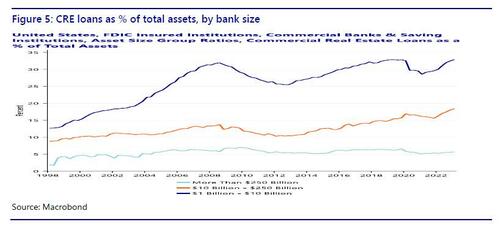
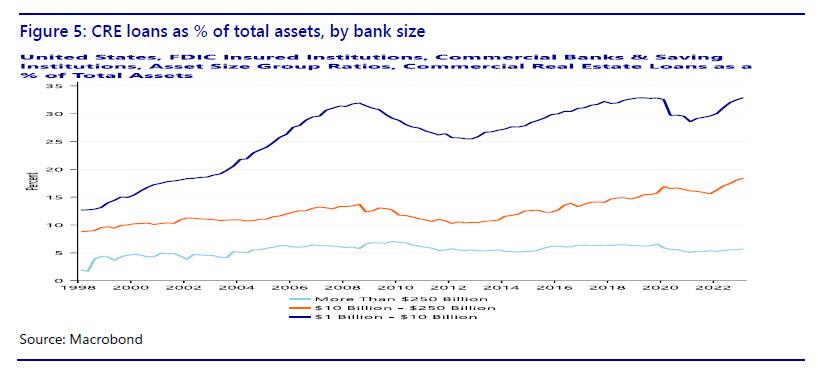
Whether the increased share of CRE lending by small banks is a problem also depends on the relative importance of CRE loans for small banks (Figure 5). FDIC data (Quarterly Banking Profile) distinguish at least three classes of asset size: more than $250 billion, $10-250 billion, and $1-10 billion. The first class contains only large banks as defined by the Fed stress test, the second class is a mix of large and small banks, the third class only contains small banks. While for the largest banks, CRE loans were only 5.7% of total assets in the first quarter of 2023, for the smallest banks this is 32.9%! For the intermediate-size banks the CRE loans are 18.4% of assets. So not only is 80% of the CRE bank loans made by small banks, these loans also make up a much larger fraction of the balance sheet of small banks.
Finally, it is important to note that small banks are regional banks. In fact, the US has so many small banks because for much of its history it was difficult for banks to open a branch in another state. This legislation has been abolished, and the amount of banks in the US has fallen, but there are still many small banks with predominantly regional clients. This means that CRE risk in small banks is also regionally concentrated. Instead of a diversified nationwide CRE loan portfolio, a small bank tends to make loans to local borrowers. Consequently, if commercial real estate in a region turns sour, the small banks in the area will be highly exposed. Bubble or not, any adverse development in the CRE sector is going to hit small banks harder than large banks.
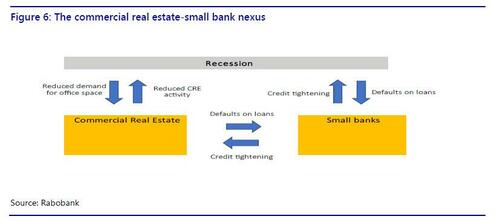
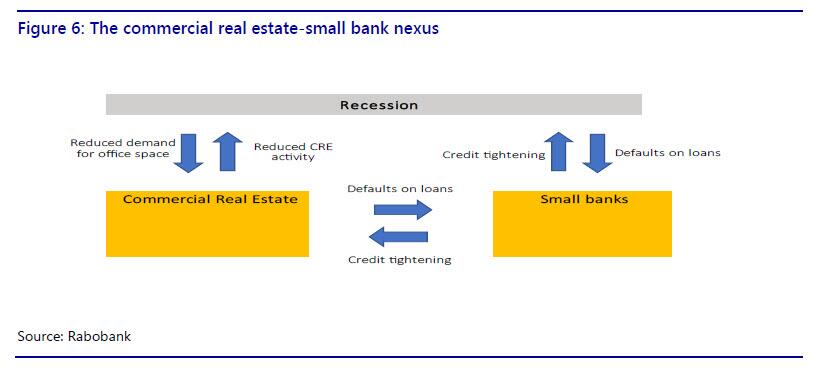
The commercial real estate-small bank nexus brings together two vulnerable sectors that could rapidly deteriorate in a self-reinforcing loop. Small banks have already shown vulnerable to higher interest rates and deposit outflows in March and commercial real estate is high on the list of financial stability concerns of US regulators. We have shown that the two sectors are critically connected and in the next section we speculate on the feedback mechanisms that could arise and make things worse.
Roads to ruin: feedback mechanisms
The commercial real estate-small bank nexus allows for several scenarios in which both sectors could be destabilized. In the first two scenarios, a crisis occurs in one sector, causing problems in the other sector. Tighter credit and reduced activity in the CRE sector could push the economy into a mild recession. In the third scenario, a mild recession causes problems in both sectors, which could then reinforce each other and make the recession worse.
In scenario 1, a small banking crisis leads to problems in CRE. Given that the majority of CRE loans have been made by small banks, continued problems for small banks, caused by or leading to deposit flight, could force them to tighten lending to the CRE sector. This would reduce the supply of credit to CRE, causing additional problems for the CRE sector, on top of office vacancies and stagnating prices.
In scenario 2, a CRE crisis causes small banks to collapse. Even if small banks stabilize in the near future from the recent deposit flight problems, they could subsequently be dragged down by a crisis in the CRE sector. Defaults in CRE will asymmetrically hurt small banks rather than large banks, because of the concentration of CRE risks at small banks. This could lead to a new round of deposit flight from small banks to large banks and money market funds. The losses on loans and loss of funding could be lethal to small banks.
In scenario 3, a mild recession could cause a small banking crisis and a CRE crisis. In turn, this could lead to a more severe recession. A mild recession, for example caused by the Fed’s hiking cycle, will hurt the banking sector and the CRE sector at the same time. In particular, a recession would further reduce demand for office space. This will add to the problems in the CRE sector. Increased CRE defaults will hurt banks, especially the smaller ones with relatively more exposure to CRE. Losses on CRE loans will force banks to tighten credit, including for the CRE sector. The self-reinforcing problems in the two sectors could further drag down the overall economy, making the initially mild recession more severe. Specifically, tighter credit and reduced activity in the CRE sector will drag down GDP growth further.
We summarize the specific feedback mechanisms in the commercial real estate-small bank nexus in figure 6.
More broadly, we already saw in March how problems at small banks had an immediate adverse impact on financial markets. In combination with a faltering CRE sector this could severely undermine confidence among investors, consumers and businesses. This would have a broad-based negative impact on GDP growth.
Conclusion
COVID-19 appears to have a lasting negative impact on demand for commercial real estate. The federal regulators are aware of the risks in commercial real estate, but the Fed’s stress test provides a false sense of security. The finding that large banks are able to absorb losses on CRE loans in case of a CRE crisis is encouraging, but the bulk of CRE bank loans has been provided by small banks. In fact, while CRE lending by large banks has been stable, there has been a credit boom in CRE loans provided by small banks, more than doubling the amount since 2006. What’s more, small banks are more vulnerable to the CRE sector in terms of exposure and have already been hit by deposit outflows earlier this year. The commercial real estate-small bank nexus exposes the US economy to a vulnerability that could threaten financial stability and either cause a recession or make a recession more severe.
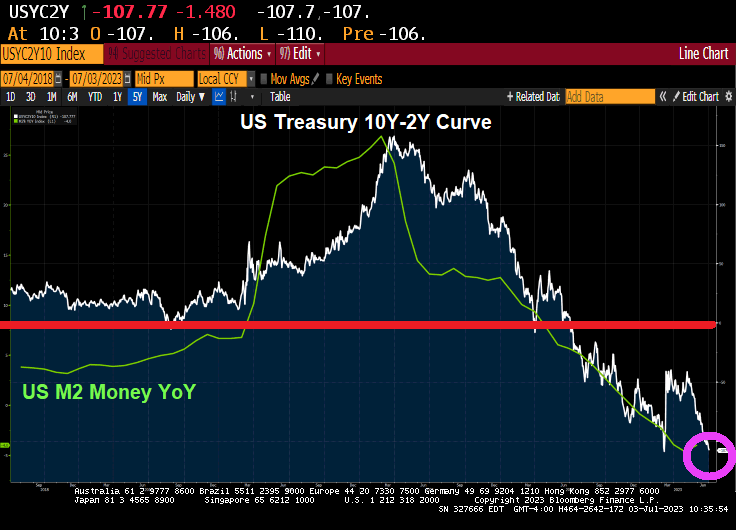
And another day, another inverted 10Y-2Y yield curve!
This chart goes along with negative bank credit growth.
Lastly, we have the Conference Board’s leading index plunging to -10!
Thanks in part to Cap’n Crunch, Fed Chair Jerome Powell!
“It is with profound disappointment that Yellow announces that it is closing after nearly 100 years in business,” said Yellow CEO Darren Hawkins in a statement Sunday.
Hawkins continued, “Today, it is not common for someone to work at one company for 20, 30, or even 40 years, yet many at Yellow did. For generations, Yellow provided hundreds of thousands of Americans with solid, good-paying jobs and fulfilling careers.”
Yellow’s bankruptcy marks the largest filing in US trucking history. The firm was responsible for roughly 15% of major corporations’ less than truckload. It has struggled with a sizeable debt load and changing consumer habits in a post-Covid environment. Yellow has $1 billion in debt due in 2024 alone and has struggled to find common ground with the Teamsters Union.
Hawkins blamed the union for the company’s failure:
“We faced nine months of union intransigence, bullying and deliberately destructive tactics.”
Yellow asked the Delaware court for permission to make payments, including employee wages and benefits, taxes, and certain vendors essential to its businesses.
Much of Yellow’s business halted weeks ago when it stopped making pickups. It axed most non-union employees and closed its yards at the end of July.
Stifel research director Bruce Chan said the demise of Yellow has been “two decades in the making,” blaming poor management and strategic decisions from the early 2000s.
For the overall trucking industry, Amit Mehrotra with Deutsche Bank said the collapse of Yellow is “clearly very positive for the companies that remain open for business.” He listed Old Dominion, Saia, CSX, and FedEx among other top picks in the industry.
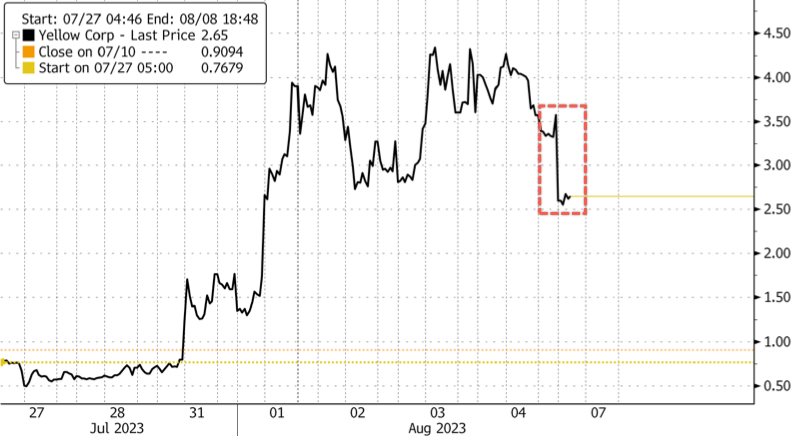
Yellow shares trading in New York plunged more than 26% on the news. This followed a 781% surge from about 50 cents on July 27 to a high of $4.34 last Thursday.
Bidenomics = missing free markets replaced by the massive Federal foot of idiotic policies.
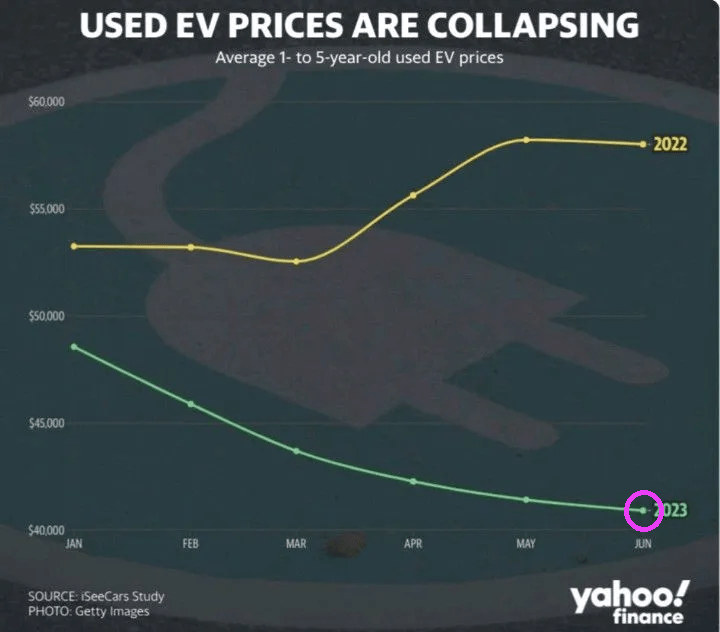
Yes, one of the cornerstones of Bidenomics is the massive expansion of (impractical) electric vehicles (or EVs). You know, those mondo expensive cars that run out of power after a couple of hundred miles requiring a lengthy recharge (kind of makes long distance trips the domain of Internal Combustion Engine (ICE) cars.
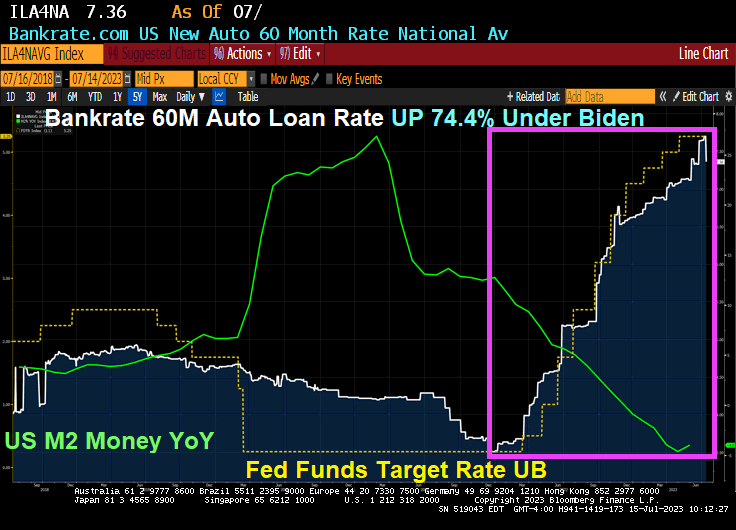
But as Biden/Congress spent trillions on green energy (massive subsidies for anything green), we noticed that 1) inflation hit 40 year highs and 2) The Fed intervened to raise rates. So, now we see that 60-month auto loan rates are now around 7.36%, up 74.4% under “Middle Class Joe.”
And we see used EV prices collapsing like a week-old soufflé.
Speaking of green energy fraud, here is the leader of the green energy fraud movement, John F’ing Kerry. Aka, Heinz Planes Grifter.
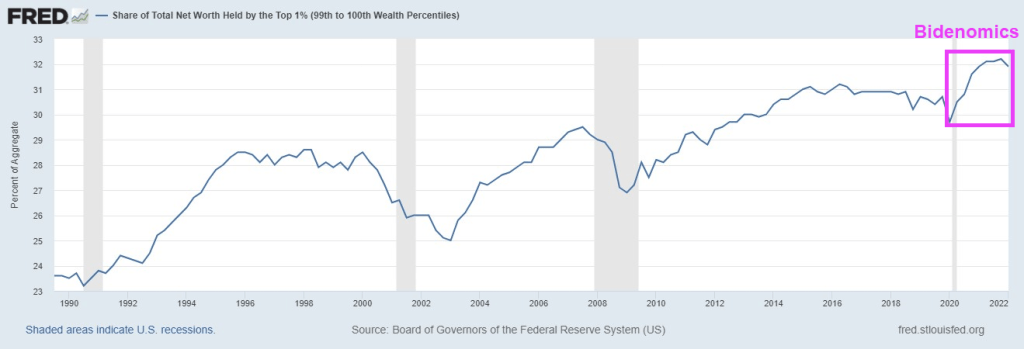
Bidenomics, which Bumbling Biden can’t explain, and his Press Secretary Karine Jean Pierre only utters “top down was a failure, we are trying the opposite!” Sorry Karine, Bidenomics personifies top down economic (mis)management where DC picks winners and losers as opposed to the free market. Under Biden’s corrupt administation, it is more like an economic FLEA market. Where the fleas get crumbs and the 1% get all the steaks and champagne.
Bidenomics is a confluence of insane levels of Federal spending and horrid Fed monetary policy, particularly in reaction to Covid.
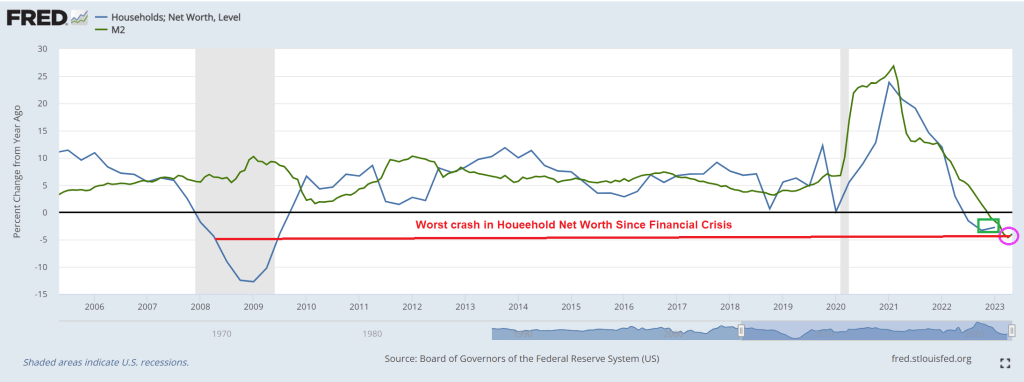
Then we have 3 consecutive quarters of declining household net worth. Meanwhile, the Obamas and Biden (and {Pelosi) get wealthier by the day.
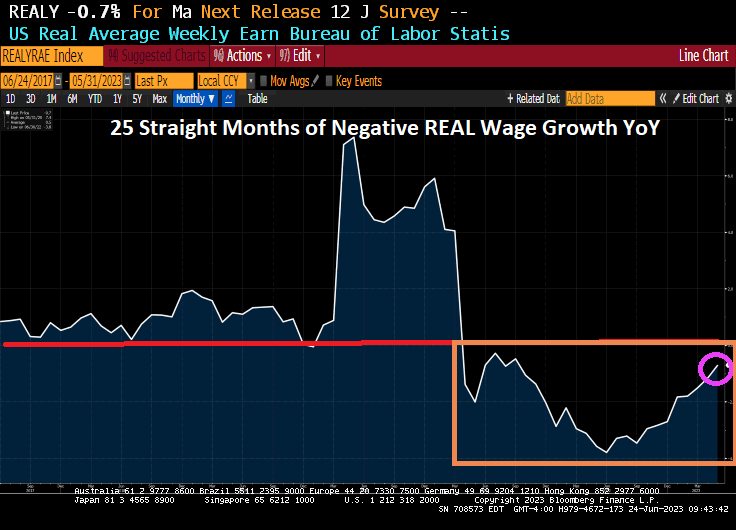
Finally, we have 25 straight months of NEGATIVE REAL weekly wage growth.
When Biden incoherently explains Bidenomics, he is really saying that he hates tax cuts to generate economic growth. After all, Biden and the DC bureaucracy think your money belongs to them.
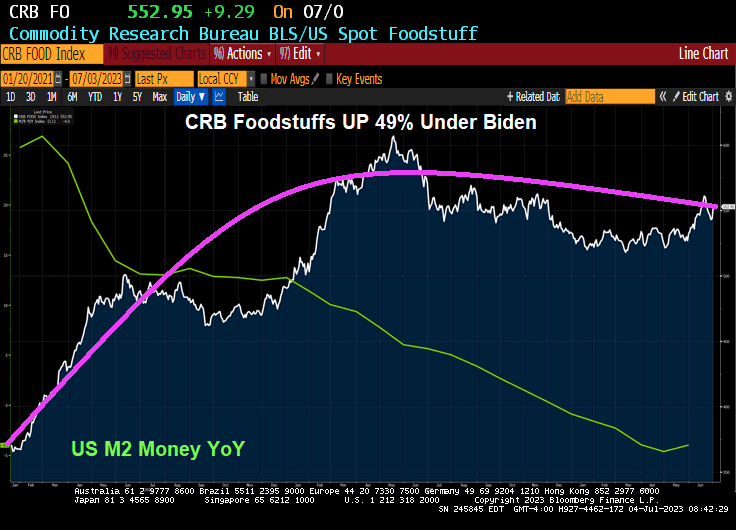
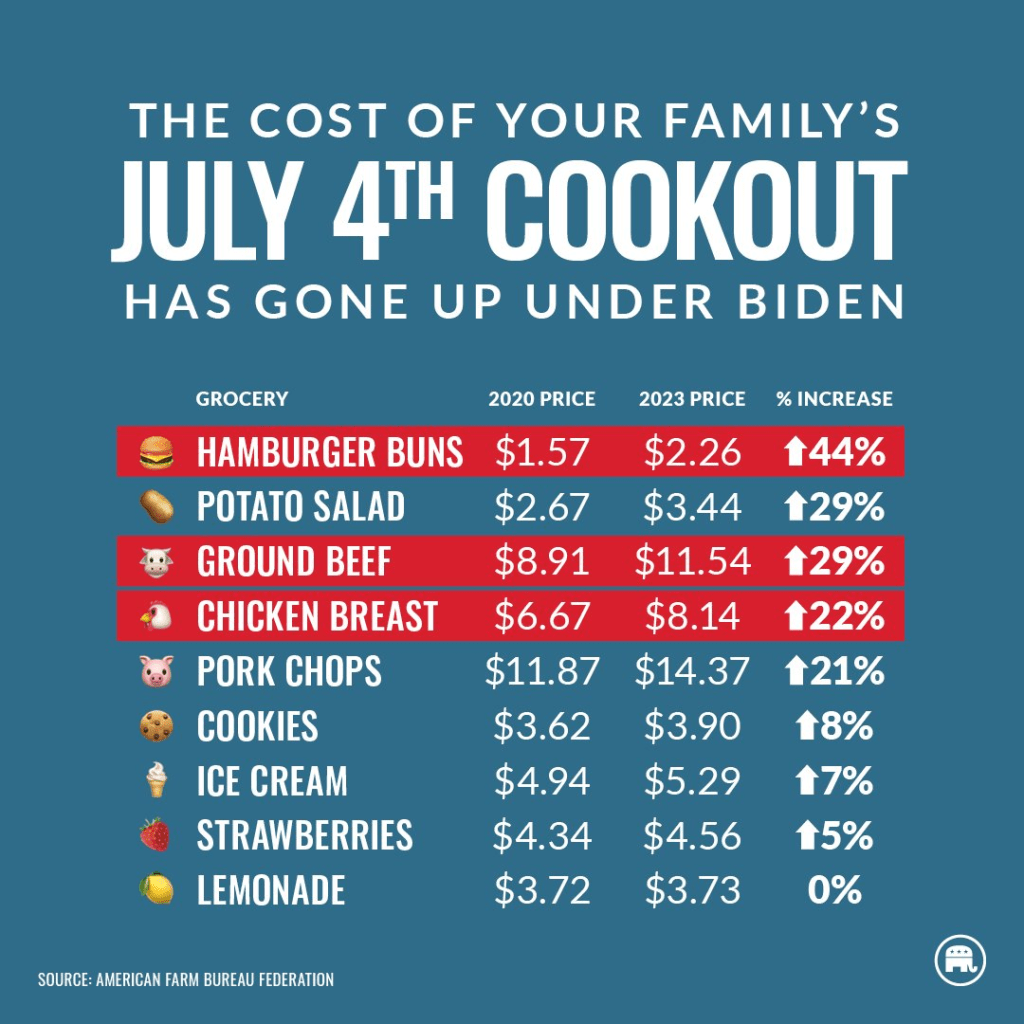
Happy 4th of July! Enjoy those burgers and hot dogs, at least until you consider that food prices have risen a staggering 49% under Biden’s Reign of Economic Error.
The only good news is that The Fed’s monetary stimulus growth is slowing. But don’t worry! Biden and Congress will keep introduce massive spending bills to avert a recession. Which will cause downline inflation.
Its the 4th of July, American Independence Day from England, but under Biden and The Federal Reserve, Americans are DEPENDENT on debt and Federal spending. In other words, Americans are addicted to gov.
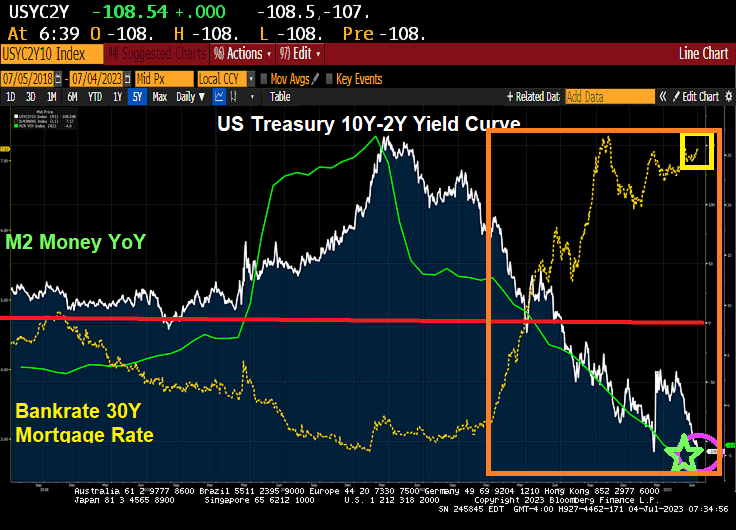
First, Bankrate’s 30-year mortgage rate index is up 150% under Biden. You can see the rapid rise in mortgage rates started with Biden (orange box). Meanwhile, the US Treasury yield curve (10Y-2Y) is the most inverted (negative slope) since 1981. Way to go, Joe!!
On the metals side, gold and silver are up slightly. (Go silver go!!)
On the crypto side, Polkadot is up 1.26% while Bitcoin is down -0.18%.
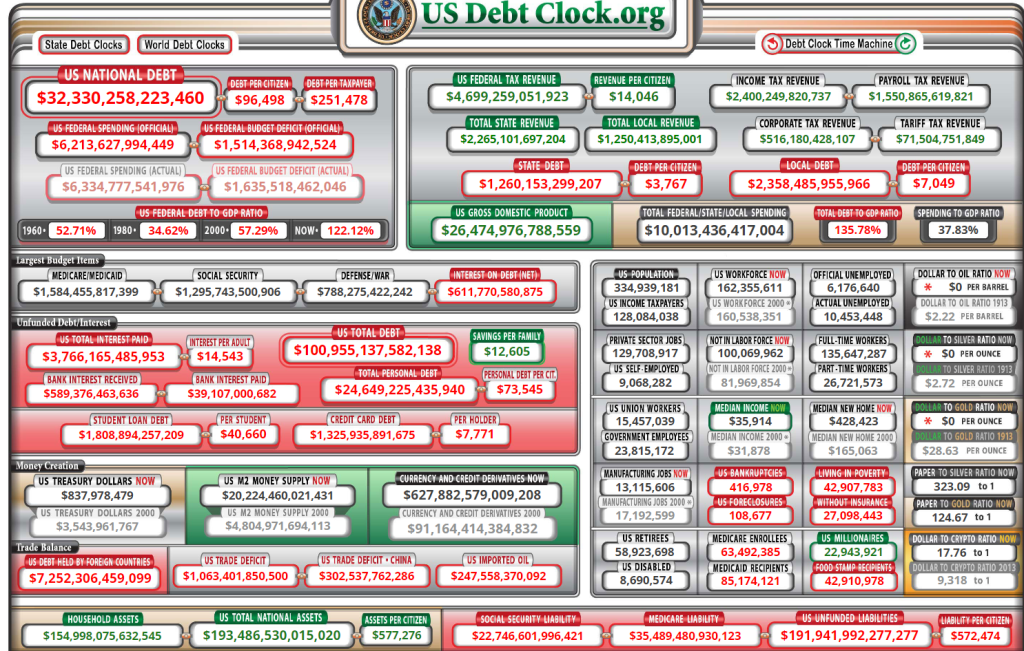
Memo To Fed: keep on printing! Why? US debt is currently $32.33 TRILLION with $192 TRILLION in unfunded Federal liabilties. That is 5 times the current level of debt!!
I was hoping that the week of July 4th would start off with fireworks, but we got bad news about the economy.
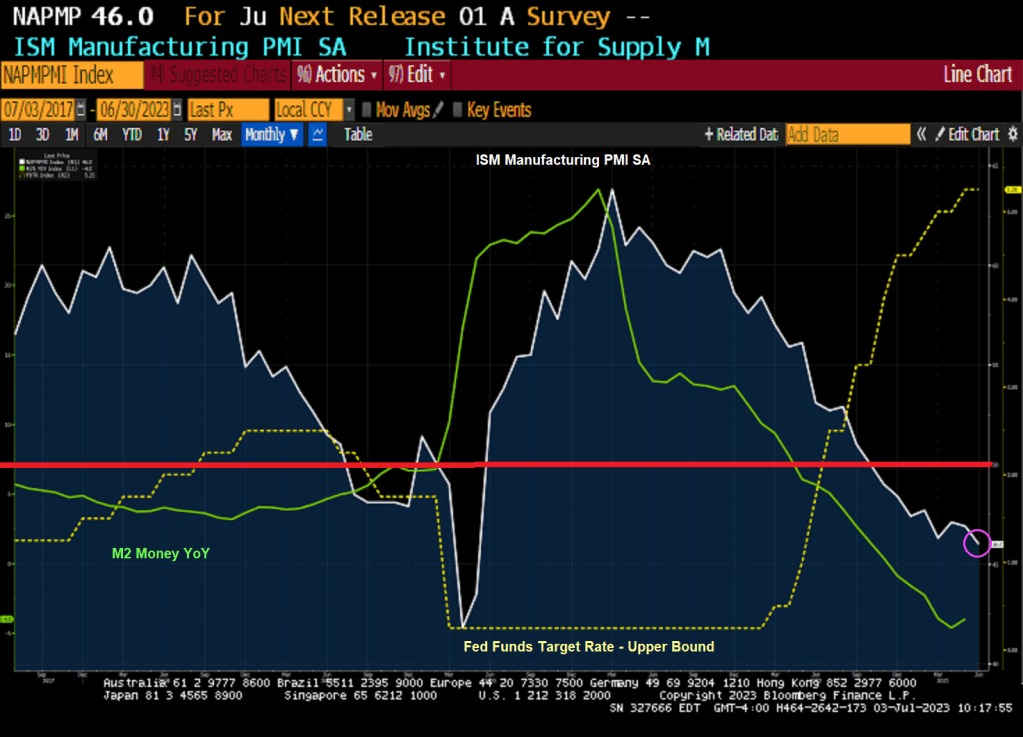
US factory activity contracted for an eighth month in June, slipping to the weakest level in more than three years as production, employment and input prices retreated.
The Institute for Supply Management’s manufacturing gauge fell to 46, the weakest since May 2020, from 46.9 a month earlier, according to data released Monday. The current stretch of readings below 50, which indicates shrinking activity, is the longest since 2008-2009.
The decline in the ISM production gauge, which also stands at the lowest level since May 2020, suggests demand for merchandise remains weak. The index of new orders contracted for the 10th straight month and order backlogs shrank, which may help explain a pullback in a measure of manufacturing employment.
The ISM gauge retreated to a three-month low and, at 48.1, indicates fewer producers adding to payrolls.
Many Americans continue to limit their spending on merchandise as they rotate to services and experiences. Others are simply tightening their belts as still-high inflation takes a toll on their incomes.
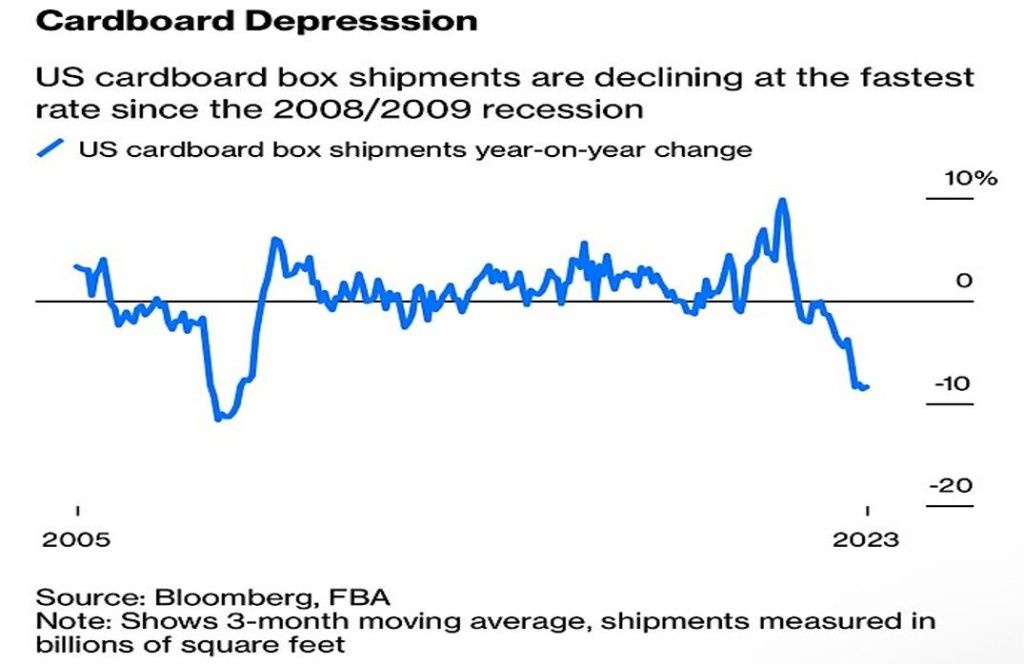
And then we have cardboard box shipments declining at fastest rate since 2008/2009.
At least Ethereum is up over 2% this morning.
And the US Treasury 10Y-2Y keeps on diving deeper into inversion.
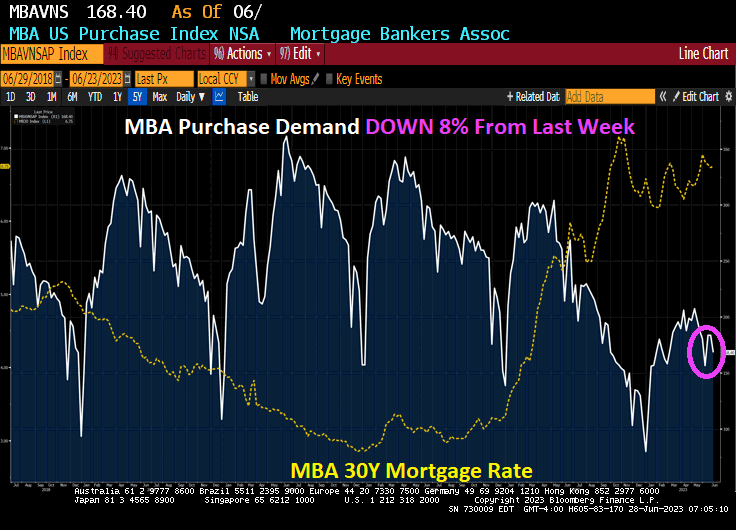
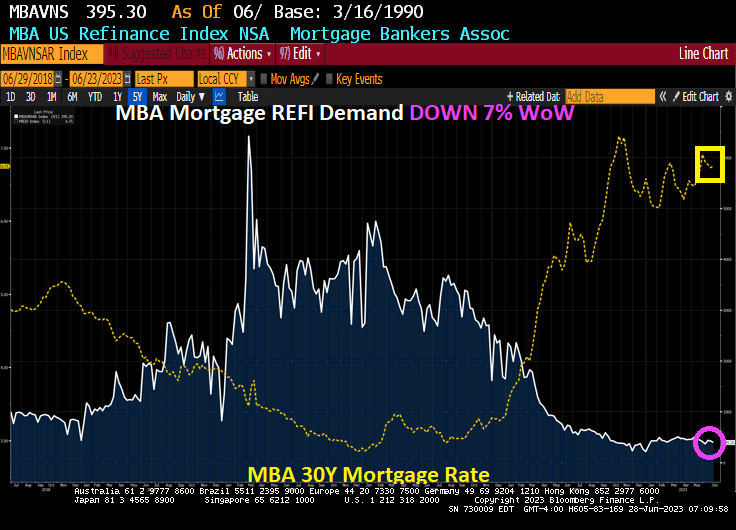
Eggs, bacon and toast. All more expensive under Biden’s economy. And mortgage purchase demand is down -45.3% since Biden was elected and mortgage refinancing demand is down -91% under Biden and mortgage rates are up 128% under Biden’s economy.
Mortgage applications increased 3.0 percent from one week earlier (using seasonally adjusted data), according to the Mortgage Bankers Association’s (MBA) Weekly Mortgage Applications Survey for the week ending June 23, 2023. This week’s results include an adjustment for Juneteenth holiday.
The Market Composite Index, a measure of mortgage loan application volume, increased 3.0 percent on a seasonally adjusted basis from one week earlier. On an unadjusted basis, the Index decreased 8 percent compared with the previous week. The seasonally adjusted Purchase Index increased 3 percent from one week earlier. The unadjusted Purchase Index decreased 8 percent compared with the previous week and was 21 percent lower than the same week one year ago.
The Refinance Index increased 3 percent from the previous week and was 32 percent lower than the same week one year ago.
Now for the highly (self) touted Biden economy: Mortgage purchase demand is DOWN DOWN -45.3% under Biden, Refi demand is DOWN -91% under Bidenomics, and mortgage rates are UP 128% under Clueless Joe’s Reign of economic error.
I could have used 3 shades of Joe, but 50 shades of Joe sounds better!
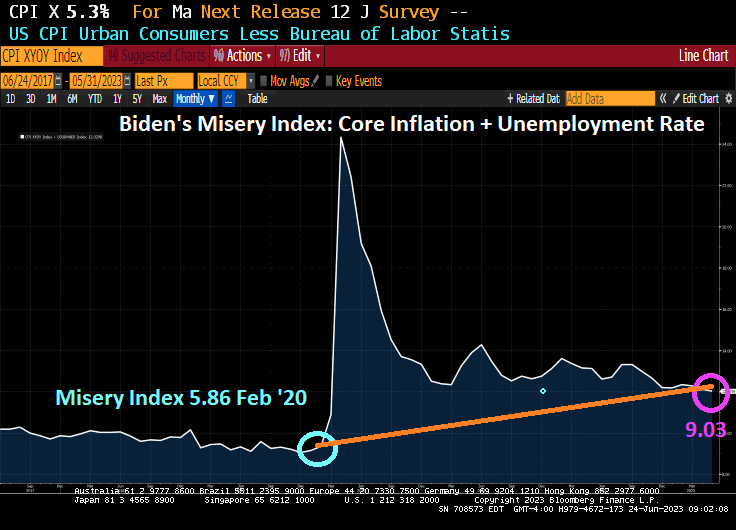
But the fact remains that Americans are far more miserable under Biden than they were under Trump before the Chinese Wuhan Covid virus was unleashed. 9.03 today (Core CPI YoY + U-3 Unemployment) than it was in February 2020 under Trump (5.86). While not twice as bad, inflation is continues to cause serious problems for America’s middle class and low-wage workers.
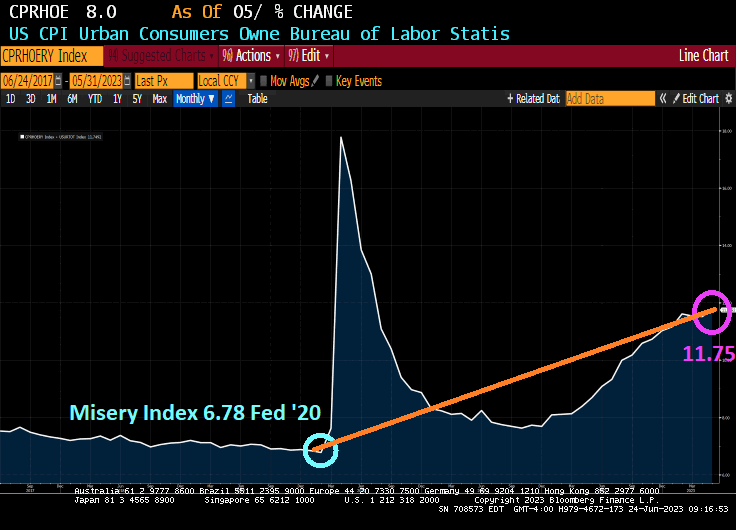
Speaking of the middle class and low wage workers, let’s look at the Renter’s Misery index (CPI Owner’s equivalent rent YoY + Unemployment rate). It was 6.78% in February 2020 under Trump and before Covid struck and is now 11.75% under Inflation Joe.
Speaking of misery, how 25 straight months of negative REAL wage growth? Real weekly wage growth went negative in April 2021, just a few months after Biden was installed as President.
Now, there was winners under Biden. Green energy donors, the big banks, big pharma, big tech, but media … essentially any big donors from big entities got massive payoffs. The middle class and low-wage workers? As Jerry Reid once sang, “They got the coal mine and we got the shaft.”


You must be logged in to post a comment.