The Commercial Real Estate/Small Bank Boogie! CRE Crisis Could Cause Small Banks To Collapse (Bank Credit Growth Now Negative As 10Y-2Y Yield Curve Remains Inverted)

We are back in the USSR! And the economy taking commands from Washington DC!

Introduction

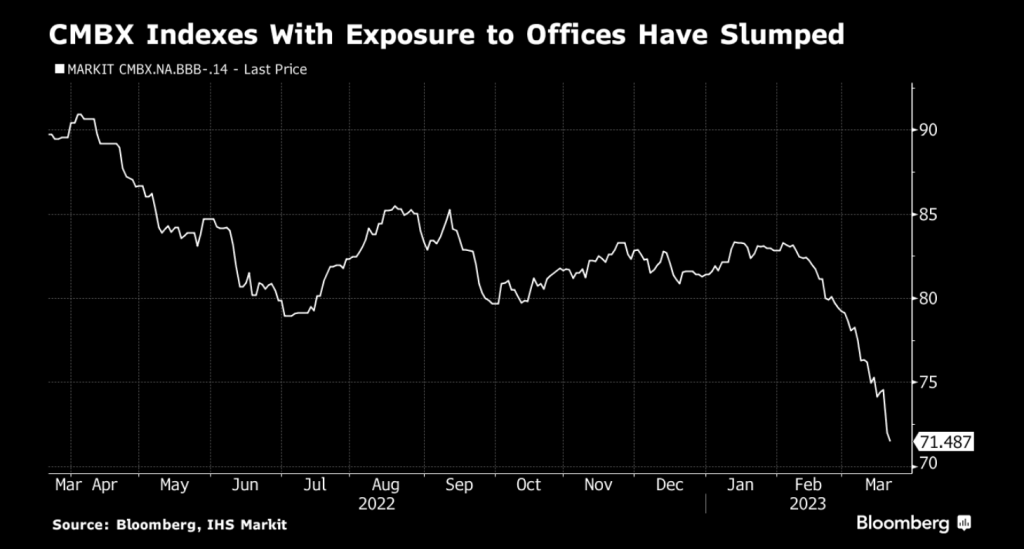
During the COVID-19 pandemic the occurrence of remote work jumped, out of sheer necessity. The technology was already available, but the pandemic accelerated its adoption and bypassed the hesitation of employers to allow people working from home. In many cases, remote work has been successful and therefore seems to have become a permanent feature, often in hybrid form. For employers, it has become an employee benefit to attract people in a tight labor market and it saves on office space costs. The flipside of the latter is that demand for office space has seen a structural downward shift. It is estimated that the underlying value of office space in New York City has permanently declined by 39%. This suggests that at current prices, there is a bubble in commercial real estate. In this special we are particularly interested in the implications for financial stability and the economic outlook. First we take a look at the development of commercial real estate prices and commercial real estate lending. Then we discuss the Fed’s recent stress test on large banks that included a large decline in commercial real estate prices. In contrast to the Fed’s exercise, we show that distinguishing between large and small banks provides a sharper picture of the vulnerabilities in the US economy. In particular, the connection between commercial real estate and small banks, through commercial real estate lending, could pose a threat to financial stability and make a recession worse.

Commercial real estate heading south

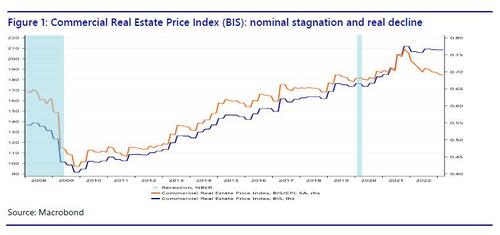
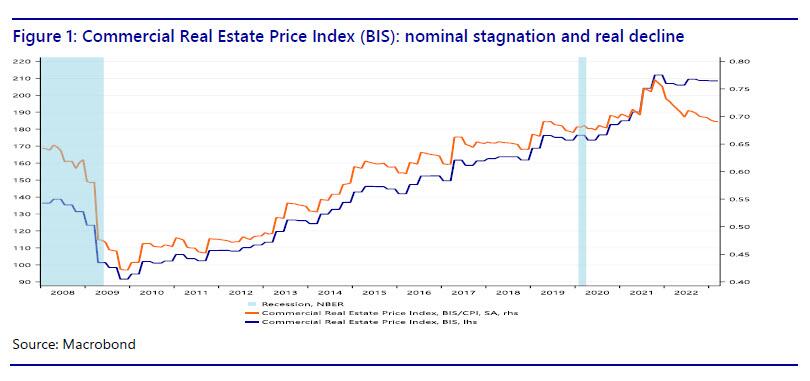
If we plot the BIS commercial real estate price index, it is clear that since the Great Recession, commercial real estate (CRE) prices have more than doubled in nominal terms (the blue line in Figure 1), but have moved sideways since 2021. This suggests that prices have reached a plateau. However, in recent years inflation has obscured the movement of CRE prices in real terms (the orange line), which shows a peak in 2021, but since then there has been a decline, almost to the level during the COVID-19 pandemic. In other words, CRE prices are already failing to keep up with inflation. Is this an indication that the CRE bubble is already deflating? With nominal CRE prices remaining elevated, most of the nominal price correction is likely still to come. If the 39% estimate by Gupta et al. for New York City is representative for the entire United States, we are heading for a major decline in CRE prices.

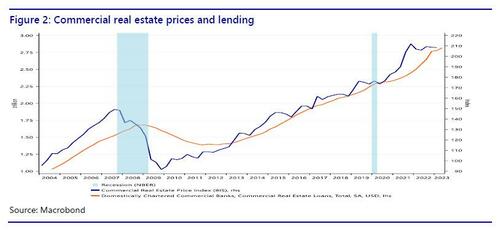
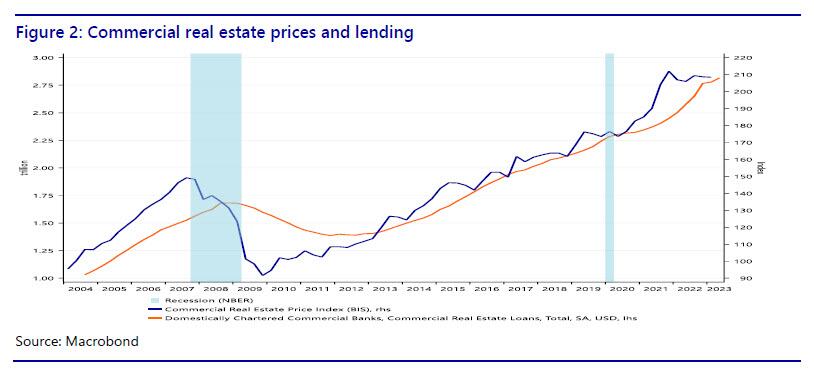
We can also plot the BIS index against CRE lending to show3 that rising prices for commercial real estate sparked a credit boom in commercial real estate (Figure 2). Given the academic literature linking financial crises to credit booms and busts, this should be cause for concern. Moreover, Minsky (1986) notes that an emphasis by bankers on the collateral value and the expected values of assets (instead of cashflows) is conducive to the emergence of a fragile (as opposed to a robust) financial structure.

If excess demand for office space pushed up commercial real estate prices, and if that increased CRE lending by banks, what does a structural downward shift in demand for office space mean? If CRE prices are deflating, what does that mean for the indebted CRE sector? Is this going to lead to defaults? And what does that mean for the banks that did the CRE lending? Is the deflation of the CRE bubble a threat to financial stability? Also note that due to the steep hiking cycle by the Fed, some companies in the CRE sector may find it difficult to refinance their loans at substantially higher rates.

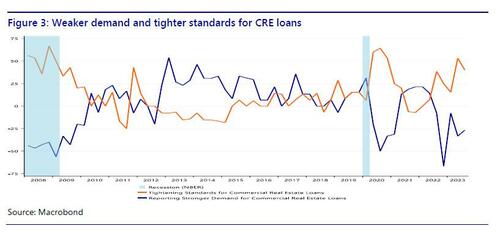
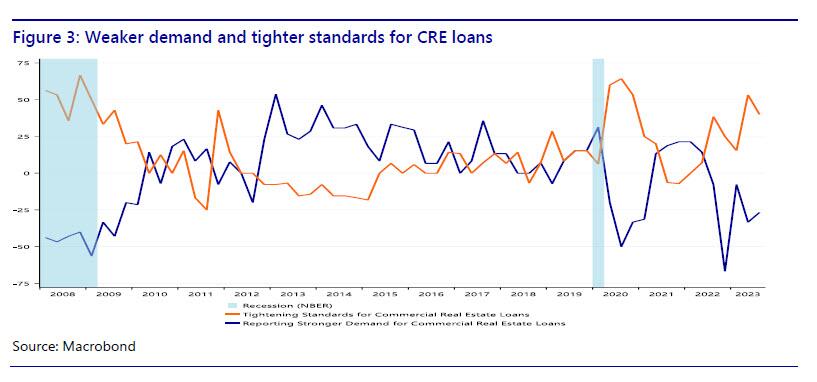
We can dig deeper by looking at the demand and supply developments in CRE lending. If we look at the Fed’s SLOOS data (figure 3), it is clear that demand for CRE loans strengthened especially between 2012 and 2017. Lending standards loosened between 2012 and 2015. This era coincides with a strong rise in the CRE price index, which may have motivated banks to expand CRE lending. Demand for CRE loans weakened during the pandemic, then bounced back as the economy reopened, but headed south again in 2022. Loan standards tightened during the pandemic, then loosened again when the economy rebounded, but have tightened since 2021. In other words, there seems to be a correlation between CRE prices and demand and supply developments in CRE lending. Currently, both are heading south, if we look at CRE prices in real terms and CRE lending in terms of net demand. It seems that rising CRE prices sparked a credit boom in CRE and now that the CRE price bubble is deflating, the CRE sector has less appetite to borrow and banks are tightening their lending standards.

The Fed’s incomplete stress test

CRE prices are falling in real terms and credit for the CRE loans is tightening. Does this pose a problem to the economy? Not if we believe the Fed’s June 28 press release that accompanied the annual bank stress test. The stress test looked at “a severe global recession with a 40 percent decline in commercial real estate prices, a substantial increase in office vacancies, and a 38 percent decline in house prices. The unemployment rate rises by 6.4 percentage points to a peak of 10 percent and economic output declines commensurately.” However, according to the Fed “all 23 banks tested remained above their minimum capital requirements during the hypothetical recession.” Therefore, the central bank concluded that “large banks are well positioned to weather a severe recession and continue to lend to households and businesses even during a severe recession.” However, one line in the press release reveals the main problem with the Fed’s stress test: “The banks in this year’s test hold roughly 20 percent of the office and downtown commercial real estate loans held by banks.” So where is the remaining 80%? If the stress test considers a huge decline in commercial real estate prices, it might be relevant to know how this affects the banks that hold 80% of the CRE loans made by banks. Therefore we take a closer look at CRE lending by large and small banks in the next section.

Bank lending: large vs small banks

We already saw in figure 2 that the rise in CRE prices until 2022 was accompanied by an increase in CRE lending. However, there is more to this story of we take a closer look at who has been doing the lending. So far we looked at aggregate bank lending to the CRE sector, without distinguishing between different types of banks. However, a closer look at the banking sector reveals a disturbing vulnerability that could be a threat to financial stability.

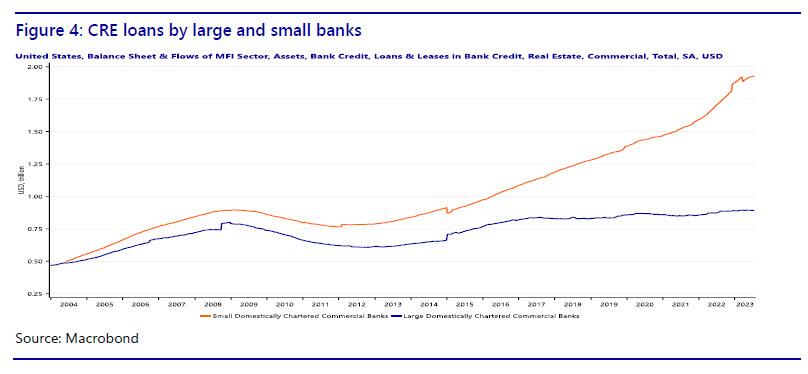
The Fed data on commercial banks distinguish between large and small banks. Large domestically chartered commercial banks are defined as the top 25 domestically chartered commercial banks ranked by size. Small domestically chartered commercial banks are defined as all domestically chartered banks outside of the top 25. Note that according to this definition a bank of say $80 billion would still be considered ‘small.’ In figure 4 we show how CRE lending has evolved, distinguishing between large and small banks.

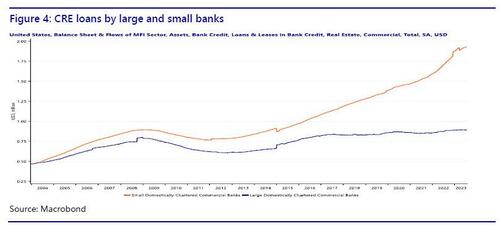
It turns out that CRE lending by large banks has hardly increased in the last 15 years, while at the same time CRE lending by small banks has more than doubled. In other words, the growth in loans to commercial real estate has come from small banks. In fact, small banks have taken over the role of main provider of commercial real estate loans. Therefore, the Fed’s stress test omits the most relevant part of the banking sector for commercial real estate. While commercial real estate lending by large banks has remained stable since 2006, commercial real estate lending by small banks has increased rapidly. We could even talk of a credit boom in commercial real estate loans provided by small banks.

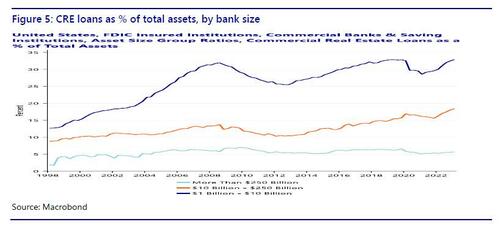
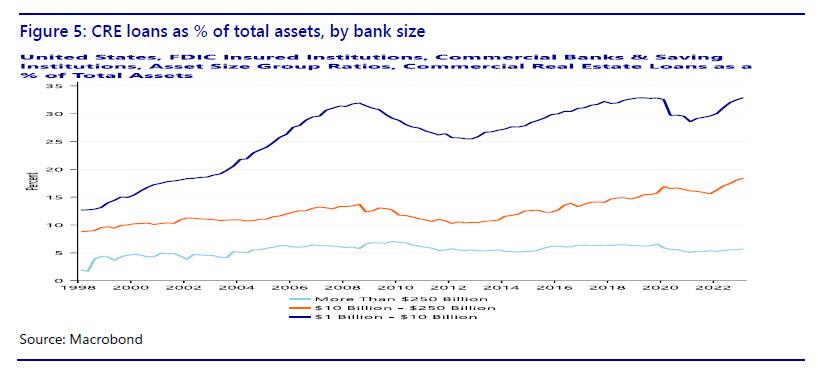
Whether the increased share of CRE lending by small banks is a problem also depends on the relative importance of CRE loans for small banks (Figure 5). FDIC data (Quarterly Banking Profile) distinguish at least three classes of asset size: more than $250 billion, $10-250 billion, and $1-10 billion. The first class contains only large banks as defined by the Fed stress test, the second class is a mix of large and small banks, the third class only contains small banks. While for the largest banks, CRE loans were only 5.7% of total assets in the first quarter of 2023, for the smallest banks this is 32.9%! For the intermediate-size banks the CRE loans are 18.4% of assets. So not only is 80% of the CRE bank loans made by small banks, these loans also make up a much larger fraction of the balance sheet of small banks.

Finally, it is important to note that small banks are regional banks. In fact, the US has so many small banks because for much of its history it was difficult for banks to open a branch in another state. This legislation has been abolished, and the amount of banks in the US has fallen, but there are still many small banks with predominantly regional clients. This means that CRE risk in small banks is also regionally concentrated. Instead of a diversified nationwide CRE loan portfolio, a small bank tends to make loans to local borrowers. Consequently, if commercial real estate in a region turns sour, the small banks in the area will be highly exposed. Bubble or not, any adverse development in the CRE sector is going to hit small banks harder than large banks.

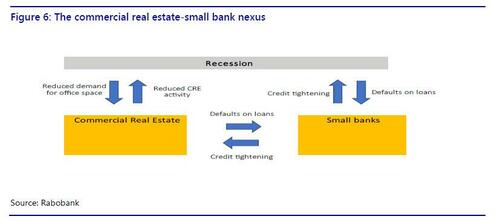
The commercial real estate-small bank nexus brings together two vulnerable sectors that could rapidly deteriorate in a self-reinforcing loop. Small banks have already shown vulnerable to higher interest rates and deposit outflows in March and commercial real estate is high on the list of financial stability concerns of US regulators. We have shown that the two sectors are critically connected and in the next section we speculate on the feedback mechanisms that could arise and make things worse.

Roads to ruin: feedback mechanisms

The commercial real estate-small bank nexus allows for several scenarios in which both sectors could be destabilized. In the first two scenarios, a crisis occurs in one sector, causing problems in the other sector. Tighter credit and reduced activity in the CRE sector could push the economy into a mild recession. In the third scenario, a mild recession causes problems in both sectors, which could then reinforce each other and make the recession worse.

  • In scenario 1, a small banking crisis leads to problems in CRE. Given that the majority of CRE loans have been made by small banks, continued problems for small banks, caused by or leading to deposit flight, could force them to tighten lending to the CRE sector. This would reduce the supply of credit to CRE, causing additional problems for the CRE sector, on top of office vacancies and stagnating prices.
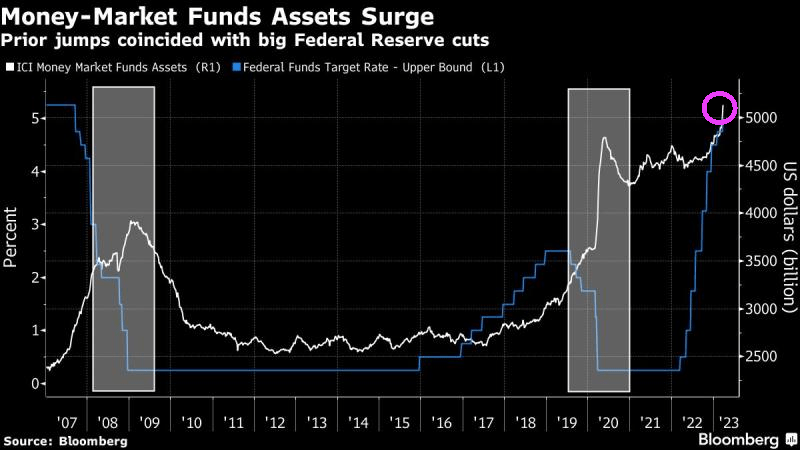
  • In scenario 2, a CRE crisis causes small banks to collapse. Even if small banks stabilize in the near future from the recent deposit flight problems, they could subsequently be dragged down by a crisis in the CRE sector. Defaults in CRE will asymmetrically hurt small banks rather than large banks, because of the concentration of CRE risks at small banks. This could lead to a new round of deposit flight from small banks to large banks and money market funds. The losses on loans and loss of funding could be lethal to small banks.
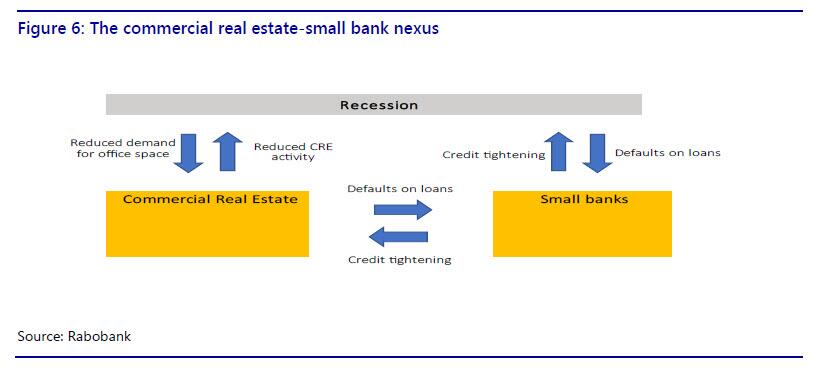
  • In scenario 3, a mild recession could cause a small banking crisis and a CRE crisis. In turn, this could lead to a more severe recession. A mild recession, for example caused by the Fed’s hiking cycle, will hurt the banking sector and the CRE sector at the same time. In particular, a recession would further reduce demand for office space. This will add to the problems in the CRE sector. Increased CRE defaults will hurt banks, especially the smaller ones with relatively more exposure to CRE. Losses on CRE loans will force banks to tighten credit, including for the CRE sector. The self-reinforcing problems in the two sectors could further drag down the overall economy, making the initially mild recession more severe. Specifically, tighter credit and reduced activity in the CRE sector will drag down GDP growth further.

We summarize the specific feedback mechanisms in the commercial real estate-small bank nexus in figure 6.

More broadly, we already saw in March how problems at small banks had an immediate adverse impact on financial markets. In combination with a faltering CRE sector this could severely undermine confidence among investors, consumers and businesses. This would have a broad-based negative impact on GDP growth.

Conclusion

COVID-19 appears to have a lasting negative impact on demand for commercial real estate. The federal regulators are aware of the risks in commercial real estate, but the Fed’s stress test provides a false sense of security. The finding that large banks are able to absorb losses on CRE loans in case of a CRE crisis is encouraging, but the bulk of CRE bank loans has been provided by small banks. In fact, while CRE lending by large banks has been stable, there has been a credit boom in CRE loans provided by small banks, more than doubling the amount since 2006. What’s more, small banks are more vulnerable to the CRE sector in terms of exposure and have already been hit by deposit outflows earlier this year. The commercial real estate-small bank nexus exposes the US economy to a vulnerability that could threaten financial stability and either cause a recession or make a recession more severe.

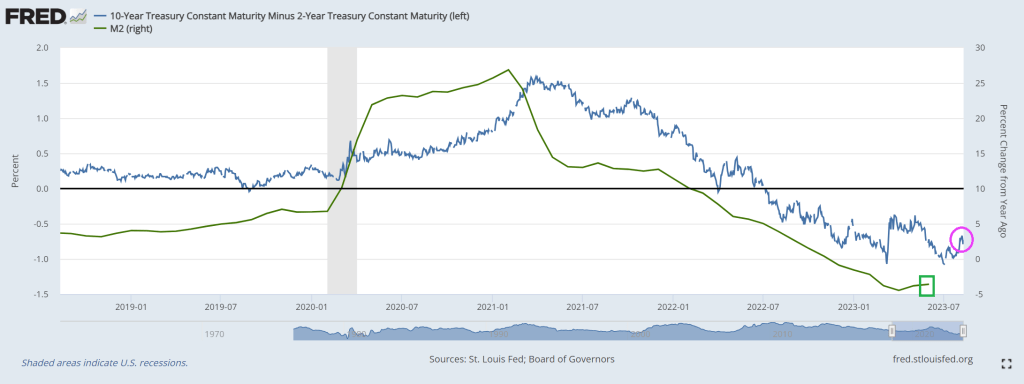
And another day, another inverted 10Y-2Y yield curve!

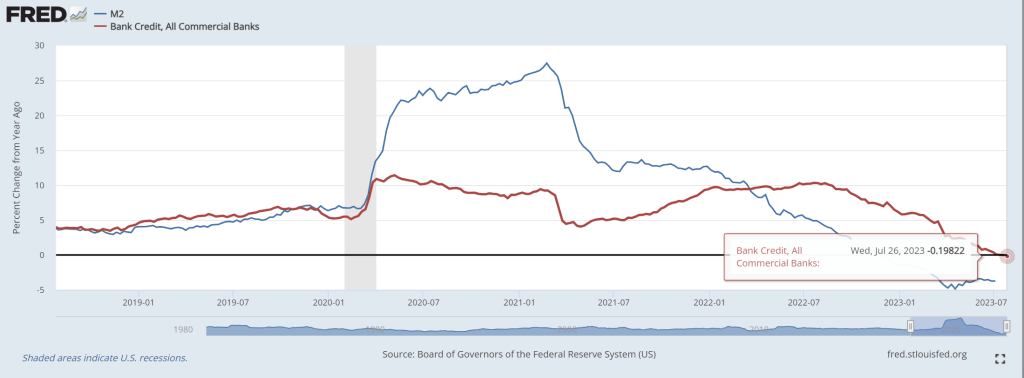
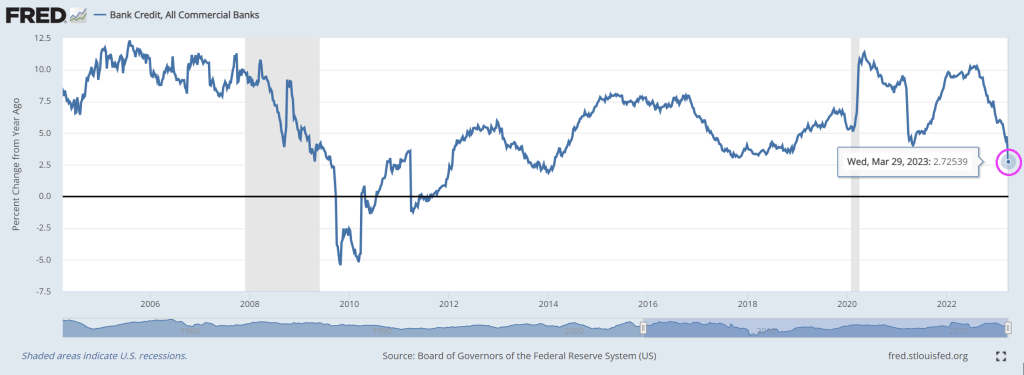
This chart goes along with negative bank credit growth.

Lastly, we have the Conference Board’s leading index plunging to -10!

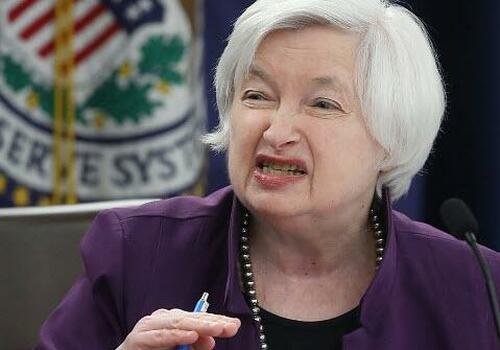
Thanks in part to Cap’n Crunch, Fed Chair Jerome Powell!

Biden’s Build Back Better Now Build Back Bankrupt! Commercial Chapter 11 Filings Increased 68 Percent in the First Half of 2023 (Rising Rates Thanks To Bidenflation)

Biden’s massive spending spree (aka, Build Back Better) has a new name: Build Back Bankrupt!

According to Epiq, Commercial Chapter 11 Filings Increased 68 Percent in the First Half of 2023.

NEW YORK – July 03, 2023  The 2,973 total commercial Chapter 11 bankruptcies filed during the first six months of 2023 represented a 68 percent increase over the 1,766 filed during the same period in 2022, according to data provided by Epiq Bankruptcy, the leading provider of U.S. bankruptcy filing data. Individual Chapter 13 filings increased by 23 percent during the same period.

Overall commercial filings registered 12,107 for the first half of 2023, representing an 18 percent increase from the commercial filing total of 10,258 for the first half of 2022. Small business filings, captured as Subchapter V elections within Chapter 11, totaled 814 in the first six months of 2023, a 55 percent increase from the 525 elections during the same period in 2022.

Overall commercial filings increased 12 percent in June 2023, as the 2,123 filings were up from the 1,891 commercial filings registered in June 2022. The 404 commercial Chapter 11 filings in June represented a 9 percent increase from the 371 filings in June 2022. Total Subchapter V elections within Chapter 11, experienced a 111 percent increase from 94 in June 2022 to 198 in June 2023.

“The increase in commercial and individual bankruptcy filings during the first half of 2023 underscores the economic challenges faced by businesses and individuals,” said Gregg Morin, Vice President of Business Development and Revenue at Epiq Bankruptcy. “Our objective is to provide bankruptcy professionals with timely and accurate data necessary for analyzing stakeholder volumes and trends for making informed business decisions.”

Total bankruptcy filings were 217,420 during the first six months of 2023, a 17 percent increase from the 185,352 total filings during the same period a year ago. Total individual filings also registered a 17 percent increase, as the 205,313 filings during the first half of 2023 were up from the 175,094 filings during the first six months of 2022. The 85,390 individual Chapter 13 filings in the first half of 2023 represent a 23 percent increase over the 69,367 filings during the same period in 2022.

All chapters increased in June 2023 compared to June 2022, with 37,700 total bankruptcy filings representing an increase of 17 percent from the 32,198 filed in 2022. Total commercial filings were up 12 percent from 1,891. Total Individuals were up 18 percent from 30,307.

While not the Epiq data, the Bloomberg Corp Bankruptcy Index shows the rise in bankruptcies as The Fed fights Bidenflation.

The Core! US PCE Core Deflator Remains High At 4.6%, Spending Slows (Taylor Rule Suggests Fed Funds Target Rate Of 10%, Halfway To Target!!)

The film “The Core” was a silly film, but core inflation in the US is a serious problem for the middle class and low-wage workers. It remains elevated despite Treasury Secretary Janet “The Marxist Gnome” Yellen saying it was “transitory.” Looks pretty permanent to me!

The Federal Reserve’s preferred measures of US inflation cooled (slightly) in May and consumer spending stagnated, suggesting the economy’s main engine is starting to lose some momentum. 

The personal consumption expenditures price index rose 0.1% in May, Commerce Department figures showed Friday. From a year ago, the measure eased to the slowest pace in more than two years.

Consumer spending, adjusted for prices, was little changed after a downwardly revised 0.2% gain in April. From February through May, household spending has essentially stalled after an early-year surge. Spending on merchandise dropped, while outlays for services increased.

Excluding food and energy, the so-called core PCE price index increased 4.6% from May 2022. That’s in line with annual readings back to late 2022 and shows minimal relief from elevated price pressures. Economists consider this to be a better gauge of underlying inflation.

IndicatorActualEstimate
PCE price index (MoM)+0.1%+0.1%
Core PCE price index (MoM)+0.3%+0.3%
PCE price index (YoY)+3.8%+3.8%
Core PCE price index (YoY)+4.6%+4.7%
Real consumer spending (MoM)0.0%+0.1%

Under the hood of the government report, a key metric flagged by Fed Chair Jerome Powell showed a welcome slowdown. Services inflation excluding housing and energy services increased 0.2% in May from a month earlier, the smallest advance since July of last year, according to Bloomberg calculations. The figure was up 4.5% from a year ago. 

The Taylor Rule now suggests a target rate of 10%. We are just halfway to target!

Meanwhile, Yellen Plans July China Trip, While US Preps Investment Curbs. Trying to convince China that the US won’t default on its $32 TRILLION and growing debt?

Dallas After (Economic) Midnight! Texas Manufacturing Survey Disappoints For 5th Straight Month Amid “Political Incompetence”(And Massive Corruption)

Dallas after (economic) midnight! Particularly after 5 consecutive months of negative readings.

For the fifth straight month, the Dallas Fed’s Texas Manufacturing Outlook survey disappointed expectations, printing -23.2 vs -21.8 exp) and is negative for a fifth straight month.

Source: Bloomberg

Texas factory activity declined in June, according to business executives responding to the Texas Manufacturing Outlook Survey. The production index, a key measure of state manufacturing conditions, fell three points to -4.2, a reading indicative of a slight contraction in output.

Labor market measures suggest weaker employment growth and declining work hours. Price pressures evaporated, while wage pressures remained elevated

Yes, the Biden Administration may be the most incompetent administration in US history with Congress a close second. And did I mention CORRUPT??

Biden’s Mortgage Market! Mortgage Demand Down -35% Under Biden, Refi Demand Down -90%, Mortgage Rates Up 128% (Renter’s Misery Index Now 11.75% Versus 6.78 Pre-Covid Under Trump)

The good news? Mortgage purchase demand fell only -0.05% from last week. The bad news? Mortgage purchase demand is down -35% since Resident Biden was sworn in. And mortgage refinancing demand is down a whopping -90%. Reason? Mortgage rates are up 128% under Clueless Joe.

Mortgage applications increased 0.5 percent from one week earlier, according to data from the Mortgage Bankers Association’s (MBA) Weekly Mortgage Applications Survey for the week ending June 16, 2023.

The Market Composite Index, a measure of mortgage loan application volume, increased 0.5 percent on a seasonally adjusted basis from one week earlier. On an unadjusted basis, the Index decreased 1 percent compared with the previous week. The Refinance Index decreased 2 percent from the previous week and was 40 percent lower than the same week one year ago. The seasonally adjusted Purchase Index increased 2 percent from one week earlier. The unadjusted Purchase Index decreased 0.1 percent compared with the previous week and was 32 percent lower than the same week one year ago.

And as Paul Harvey used to say, here is the rest of the story.

And the renter’s misery index, CPI for owner’s equivalent rent YoY + U-3 unemployment rate, is now a staggering 11.75% verus 6.78% in February 2020, the last month before the Chinese Wuhan virus led to economic and school shutdowns. And we have Donald Trump as President instead of this corrupt clown.

What is the difference between baseball legend Shoeless Joe Jackson and Clueless Joe Biden? While both sold out their teams for personal wealth, at least Shoeless Joe was good at baseball. Clueless Joe is a corrupt bully. Shoeless Joe was allegedly stupid, but so is Clueless Joe.

Wasting Away Again In Bidenville! Core Inflation Rate UP 244% Under Biden, Food UP 46%, Gasoline Prices UP 60%, Rental Growth UP 268% As Biden/McCarthy Negotiate

The US middle class is wasting away in Bidenville. While Climate Envoy John Kerry threatens to seize farms in the name of … climate change? The moral hazard problems associated with farm seizures boggle the mind.

So, everyone keeps talking about the debt ceiling and the fact that America is about to run out of money. How did we just find $375 million dollars AGAIN to ship on over to Zelenskyy?

Biden and McCarthy met on the debt ceiling and nothing has been resolved. They both represent the BIG donor class and big Pharma, big defense, big tech, big media, big tech, anything that is big runs Congress and the Administration. So of course they will finally agree to raise the debt ceiling and continue their insane spending on the donor class.

As of right now, there is no deal to raise the debt limit. Biden wants to raise the already insane and irresponsible Federal budget. McCarthy wants no new taxes. Who will cave in this game of chicken? My guess is that McCarthy will cave. Biden may whip out the 14th Amendment to bypass McCarthy and Congress, but this makes Biden a dictator (which would suit him fine, but would be a horrible precedent).

Core Inflation Rate UP 244% under Biden, Food UP 46%, Gasoline Prices UP 60%, Rental Growth UP 268%. What a disaster under Biden’s Reign of Error.

But at least the Biden family are getting wealthy beyond comprehension. Isn’t that Ashley Biden in the blue?

Alarm! US M2 Money Growth Crashes To -3.128% YoY As Fed Depthcharges US Economy To Fight Inflation (Fed Funds Rate Expected To Rise Twice, Then Depthcharge Like Das Boot)

Alarm!

America’s mega bank, The Federal Reserve, is slowing M2 Money growth so rapidly that it looks like it is depthcharging the US economy.

Inflation in the US has been booming since 1) Biden attacked fossil fuels, 2) The Fed’s overresponse to Covid (+27.48% YoY on February 22, 2021 near the beginning of Biden’s Reign of Error). and 3) out of control Federal spending under Biden, Pelosi and Schumer.

Fed Funds Futures point to two more Fed rate hikes before The Fed drop rates like a depthcharge. This depthcharge will help create a rekindling of asset bubbles.

The Taylor Rule suggets a Fed Funds Target rate of 11.77 while the current target rate is only 5%. This is called “leading from behind.”

Here is The Fed monitoring the US economy in order to decide on firing more financial torpedos!

Is Biden Actually Captain Crunch? Inflation Drives Fed Tightening = Crashing US Bank Credit YoY (Now Only 2.73%)

Inflation started with Biden’s misguided war on US energy, then Biden/Congress helped inflation with an epic spending splurge. The Federal Reserve counterattacked with Fed rate hikes.

Over the past year, The Fed Funds Effective rate has risen and US bank credit has crashed to 2.73% year-over-year.

Do I detect a trend?

Since 2005, the crash in US bank credit is looking like 2008/2009 all over again.

Whether Biden is Cap’n Crunch or Jerome Powell or Janet Yellen, they are all crunching the US economy.

Inflation Slows A Little (Core PCE Price Growth 4.6% YoY) In February, But Remains High Despite Fed Withdrawal (Is US A Failed State?)

Inflation is slowing just a little. But my feeling about The Fed (that partly caused the problem in the first place by keeping rates too low for too long (TLTL) under Yellen is all I can do is laugh.

The US Core Deflator (Personal Consumption Expenditure CORE PRICE Index YoY fell only slightly in February to a still-high 4.6% in February despite The Fed jacking up interest rates and slowing M2 Money growth.

I thought Biden and Congress passed the inflation reduction act??

I forgot. Under Obama/Biden, the US is now a failed state. Or a banana republic without bananas. Way to go Joe!

Short Sellers Step Up Bets Against Office Owners on Bank Turmoil (Small Banks Hold 70% Of Commercial RE Loans As Fed Continues Its Fight Against Inflation)

The Federal Reserve raised their target rate just once under President Obama until Donald Trump was elected. Then raised their target rate 8 times AFTER Trump was elected. In other words, Bernanke/Yellen kept the target rate near 0% for too long. When you throw the insane level of spending by Biden and Congress on top of the massive Fed stimulus. Now The Fed is trying to remove the excessive monetary stimulus by raising rates which is crushing banks.

Small bank reserces are low.

In any case, rate hikes are causing turmoil at small banks (as witnessed by the failures of SVB, Silvergate, First Republic and Signature Banks. Even worse, small banks hold 70% of commercial real estate loans.

Money managers have stepped up their bearish bets against office landlords, wagering that the US regional banking crisis will slash the availability of credit to property owners that were already suffering from the pandemic and rising interest rates.

Hedge funds are using credit derivatives and equities to bet against the companies and their debt. Almost 40% of shares in the iShares US Real Estate ETF are sold short, the highest proportion since June, according to data from analytics firm S3 Partners.

At Hudson Pacific Properties Inc., short interest reached a record 7.4% earlier this week before dropping to about 5% of shares outstanding, according to data compiled by IHS Markit Ltd. That’s almost double the level a month ago. For Vornado Realty LP, short interest is the highest since January.

Three regional banks have failed in the US, raising concerns about the implications for commercial real estate finance. Many lenders are losing deposits, which might cut into their ability to finance real estate in the future. Regional banks account for about 80% of bank lending to commercial properties, according to economists at Goldman Sachs Group Inc. 

“What’s changed in the last few weeks is the credit markets,” said Rich Hill, chief of real estate strategy research at Cohen & Steers Capital Management Inc. “It went from a story of work-from-home and the impact on occupancy and the lack of rent growth to also the compounding of tighter financial conditions given everything happening with banks.”

Fears of tighter credit are adding to risks for offices that have been building for some time, Green Street analysts wrote in a Tuesday report. Hedge fund manager Jim Chanos, Marathon Asset Management and Polpo Capital Management founder Daniel McNamara are among those who have been betting for months that landlords will struggle to lure staff back to workplaces. 

“This regional banking crisis is just throwing fuel on the fire,” McNamara said in a telephone interview. “I just don’t see a way out of this without a lot of pain in the office sector.” 

Vulnerable Landlords

Real estate was already the most shorted industry across global equities, according to a March 17 report by S&P Global Inc. It was the third most-shorted sector in the US.

That’s in part because interest rates have been climbing for the last year, which pressures real estate owners. Defaults remain low for now. But office assets are the collateral for about $100 billion of the $400 billion of US commercial real estate debt maturing this year, according to MSCI Real Assets. 

Workplaces worth nearly $40 billion face a higher probability of distress, more than apartments, hotels, malls or any other type of commercial real estate, MSCI said on Wednesday. Almost $20 billion of office loans that were bundled into commercial mortgage-backed securities and are due to mature by the end of next year are already potentially distressed, Moody’s Investors Service estimates.

Credit availability for commercial real estate was already challenged this year as investors have grown less interested in buying commercial mortgage bonds, JPMorgan Chase & Co. analysts including Chong Sin wrote in a note. Sales of CMBS deals without government backing have fallen more than 80% this year, according to data compiled by Bloomberg News.

Smaller banks potentially retreating may bring a credit crunch to smaller markets, the JPMorgan analysts wrote.

Lenders advanced a record $862 billion to commercial real estate last year, a 15% increase from a year prior, data provider Trepp estimates. Much of that was driven by banks, which originated 50% more loans in the period. The pace of growth has slowed since then, Federal Reserve data show, as the outlook for real estate grows increasingly negative.

The pressure on offices means lending standards are now being tightened, bad news for landlords that have high levels of leverage and putting lenders at a higher risk of defaults.

“Recent developments have increased downside risk to commercial real estate values from expectations of tightening lending standards,” Morgan Stanley analysts including Ronald Kamdem wrote in a note on Monday. Office REITs may have to sell assets to help them successfully refinance, they said.

Shorts soared on office landlords last year as rising interest rates weighed on the industry. They dropped subsequently as investors wagered that borrowing benchmarks would top out at a lower level than initially expected or the Federal Reserve would begin to cut the rates earlier than previously expected.

Cohen & Steers, which oversees about $80 billion, including $48 billion in real estate investments, went under weight on offices during the pandemic and will steer clear until the market shows signs of hitting a floor.

“I actually want to see more signs of weakness,” Hill said. “The more headlines I see that things are really, really bad, the closer I think we are to the end.” 

Chanos Short

Chanos said on CNBC in January that he had been betting against SL Green Realty Corp., short interest in which reached the highest since the financial crisis in recent days. The landlord’s assets include a New York building occupied by Credit Suisse Group AG, the lender taken over by UBS Group AG after government-brokered talks. Short sellers borrow stock and sell it, planning to profit by buying it back at a lower price later.

An SL Green spokesperson directed Bloomberg to company comments at a March 6 investor conference, before the recent bank failures.

The landlord plans to sell $2 billion of properties, cut its debt by $2.5 billion and refinance a $500 million mortgage, Chairman and CEO Marc Holliday said at the Citigroup Inc. conference. Because the securitization market and life insurance financing weren’t receptive to deals, the firm is dependent on banks, which were already an uphill challenge.

“Banks are more likely to say no these days than to execute,” Holliday said. “Knock on wood, hopefully we can get that done.” 

Mark Lammas, president of Hudson Pacific, said in an emailed statement that the firm is confident in its business fundamentals and long-term prospects. The company is investment-grade, a majority of its assets are unencumbered, it has $1 billion of liquidity, and no material debt maturities until 2025, Lammas said.  

Chanos and representatives of Vornado and Boston Properties didn’t immediately reply to requests for comment.

‘The Widowmaker’

Hedge funds have also been using credit-default swaps indexes known as CMBX to bet against CMBS that are most exposed to offices. The derivatives are tied to portions of bonds backed by commercial mortgages and a number of them reached a record low this week amid fears about a number of regional banks.

Betting against commercial real estate has historically been a hard way to make money, because it can take a long time for losses to emerge, and the range of possible outcomes for even troubled property can be wide. “Shorting CMBX BBB- is regarded as the widowmaker — the undoing of many a young trader’s career,” Morgan Stanley trader Kamil Sadik wrote in a March 6 note.   

But the spate of bad news means the BBB- portion of the 14th CMBX index is at the lowest level ever and the same part of the 13th index is at its lowest since the pandemic in 2020. Similar declines are also being seen in share prices of office landlords.

“Our conversation with investors suggests that there has been some capitulation and forced selling as the stocks have continued to underperformed,” Morgan Stanley analysts led by Kamdem wrote.

So far in 2023, there has been 17 downgrades of CMBS deals with no upgrades.

Investors are fleeing to money market funds as The Fed hits the brakes.