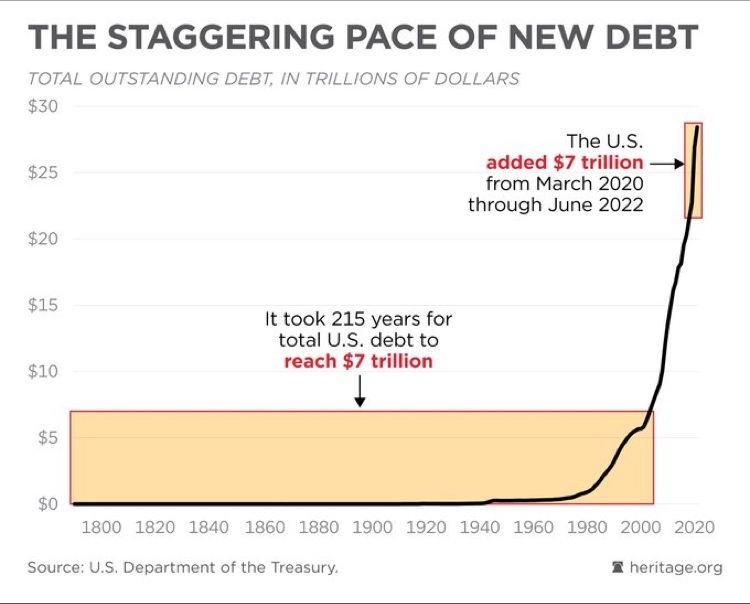
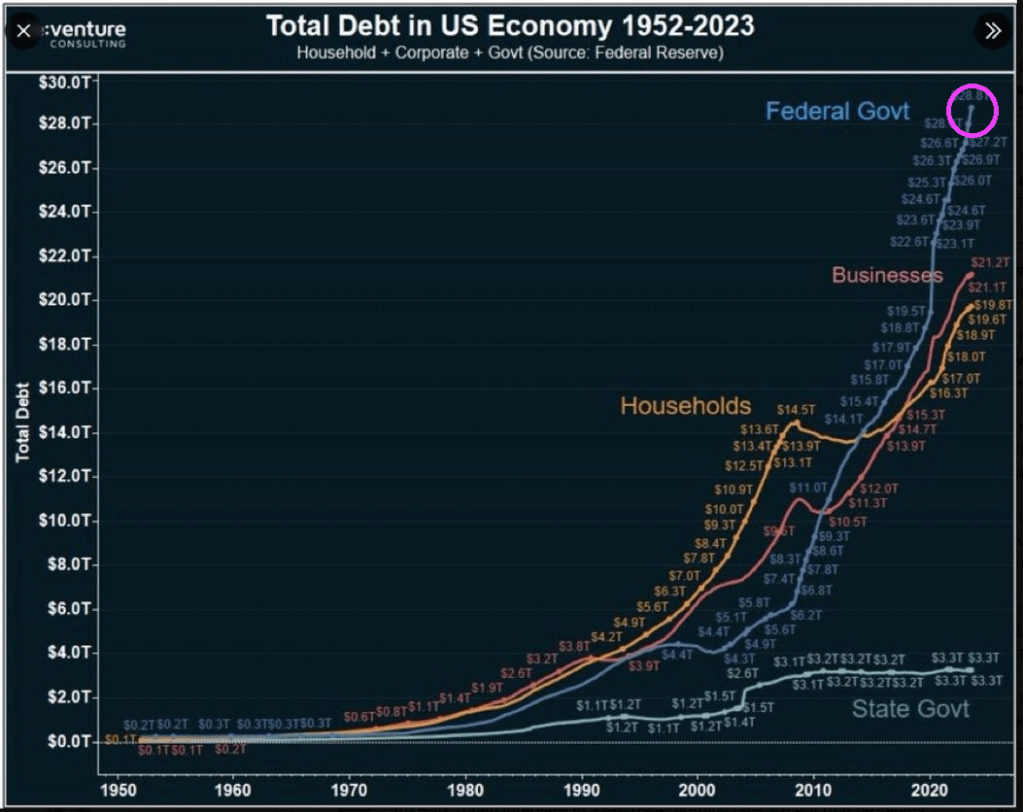
The Federal government added $7 trillion in debt since 2020 while it took 215 years to get to $7 trillion before Covid and Bidenomics.
In what can simply be called fiscal insanity, The Federal government is borrowing like there is no tomorrow (given that Biden is 81 years old, this isn’t far off) displacing businesses and households. Heaven help us if the Federal government has to borrow more money to fight a real war like World War II.
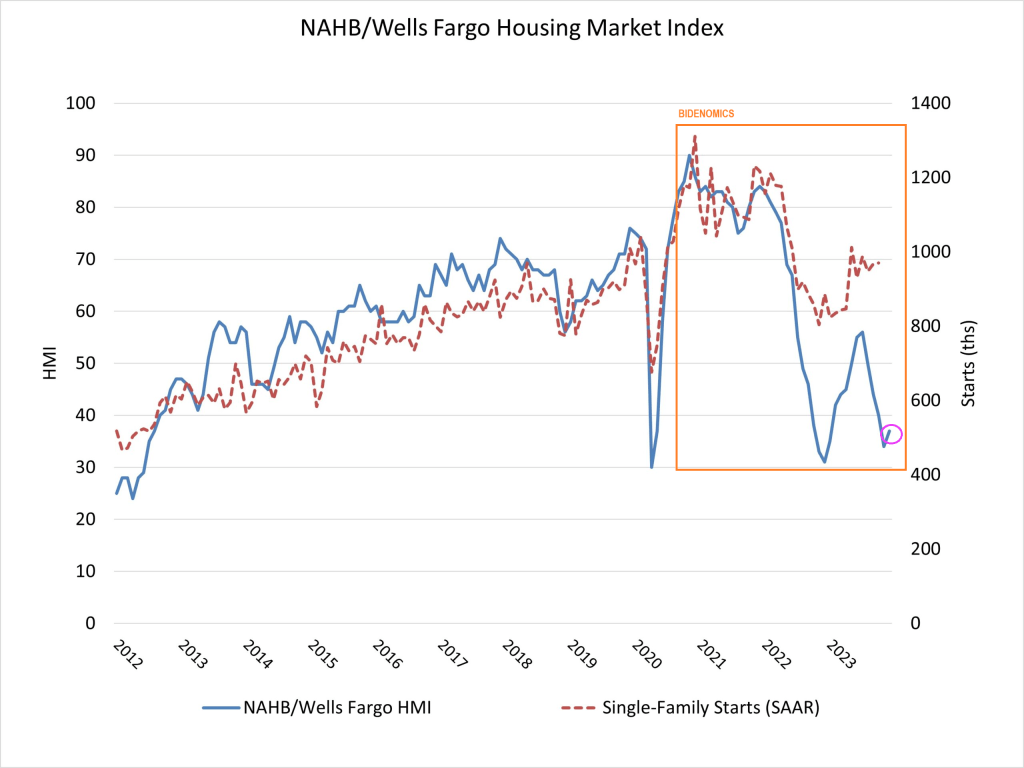
So, the massive Federal debt gorging isn’t helping the housing market.
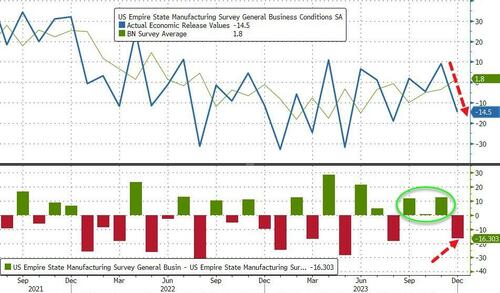
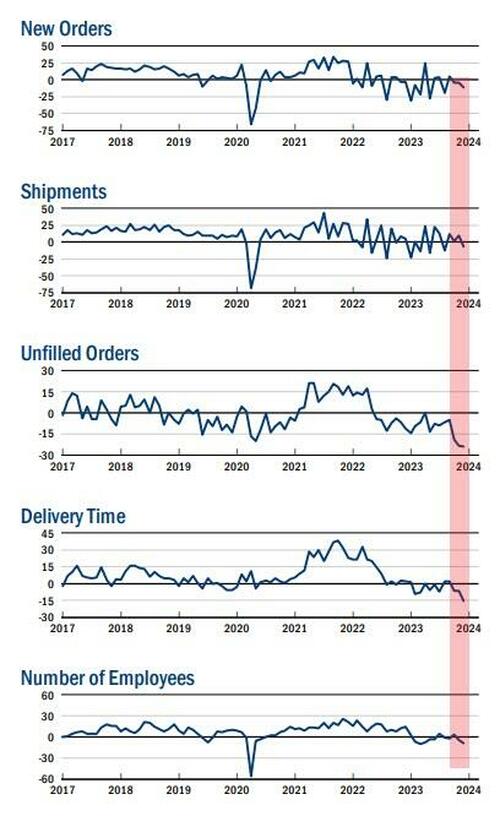
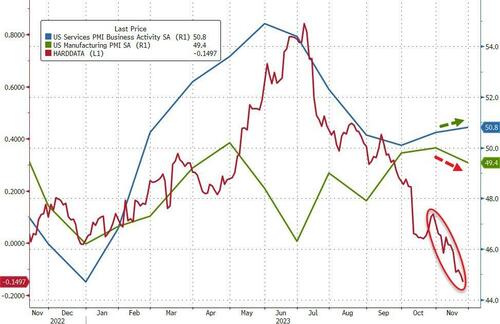
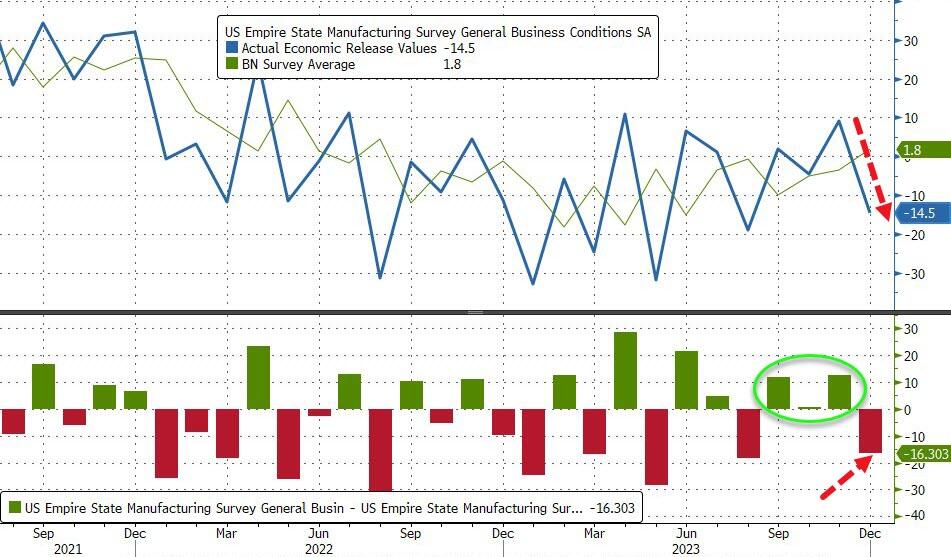
The drop takes the measure from ‘expansion’ at 7-month-highs to ‘contraction’ at 4-month-lows…
Source: Bloomberg
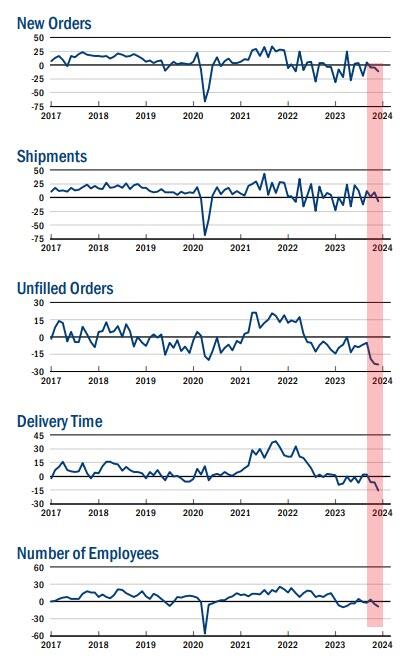
The new orders fell six points to -11.3, pointing to a decline in orders for a third consecutive month, and the shipments index fell sixteen points to -6.4, indicating that shipments fell.
The unfilled orders index held steady at -24.0, a sign that unfilled orders continued to fall significantly.
After rising into positive territory last month, the inventories index retreated fourteen points to -5.2, suggesting that inventories moved lower.
The delivery times index dropped ten points to -15.6, its lowest reading in several years, a sign that delivery times shortened.
The index for number of employees fell four points to -8.4, its lowest level in several months, pointing to a modest decline in employment levels.
On the bright side, the prices paid index moved down six points to 16.7, suggesting an ongoing moderation in input price increases, while the prices received index held steady at 11.5, a sign that selling price increases remained modest.
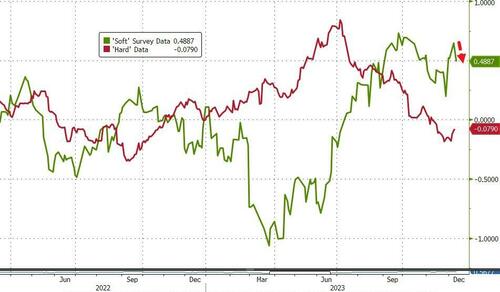
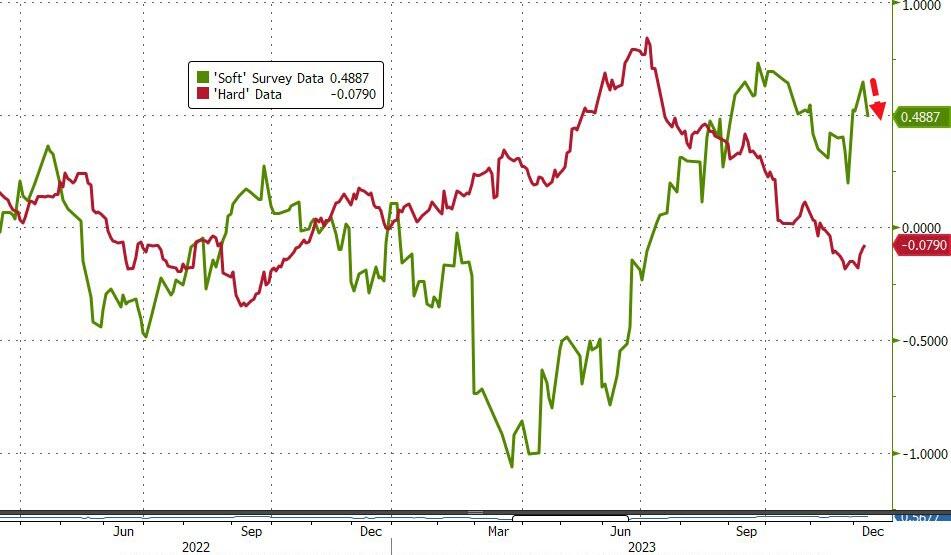
Is this the start of ‘soft’ data’s reversion to ‘hard’ reality?
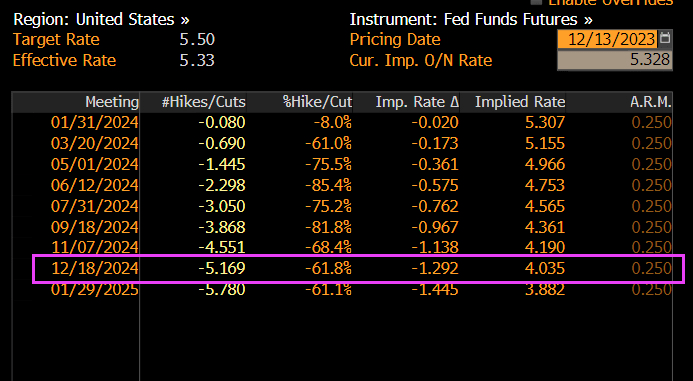
The Fed – with its six rate-cuts – better hope so.
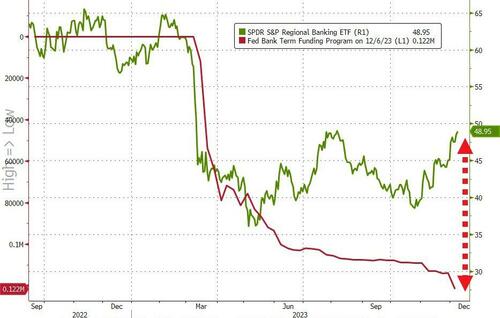
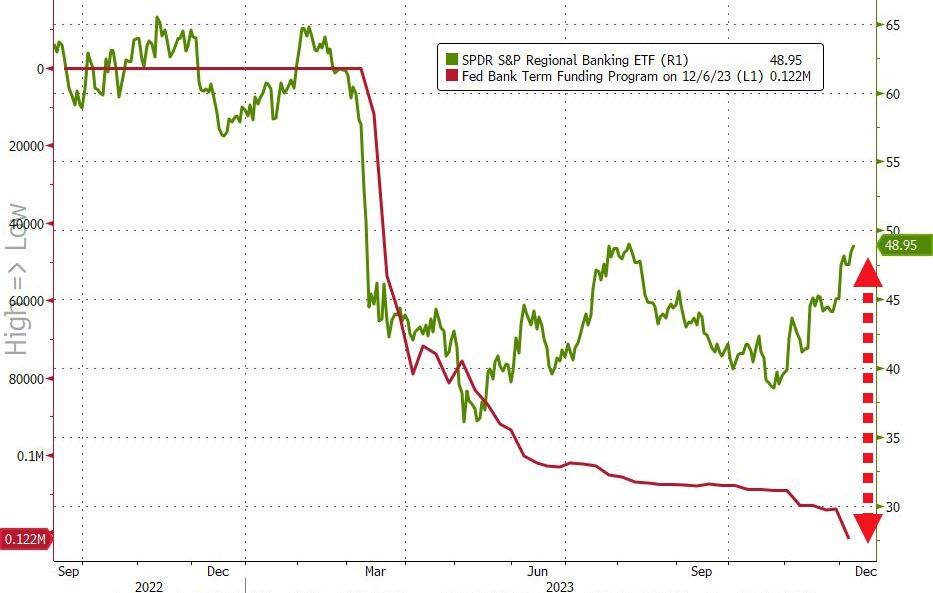
The song “Running on Empty” by Jackson Browne comes to mind when analyzing the state of American banking, especially regional banks.
Yesterday we found out that inflows to money-market funds continue to be huge ($290BN in six weeks), and more importantly, regional banks’ usage of The Fed’s BTFP bailout facility surged to a new record high (even as regional banks surged…
Source: Bloomberg
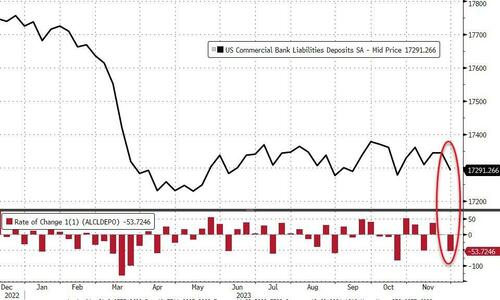
And so, with that shitshow in mind, we await the glorious manipulation of The Fed’s bank deposits data to reinforce that equity confidence.
On a seasonally-adjusted basis, banks saw a $53.7BN deposit outflow…
Source: Bloomberg
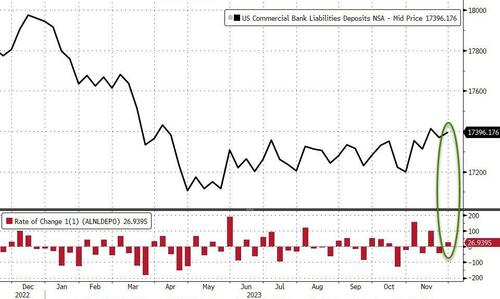
However, on a non-seasonally-adjusted basis, deposits rose by $27BN…
Source: Bloomberg
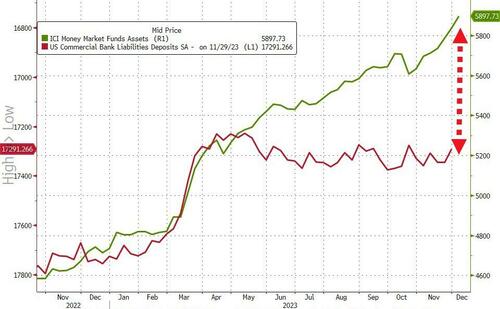
And even with the outflows (SA), the divergence between soaring money-market funds and bank deposits continues to widen…
Source: Bloomberg
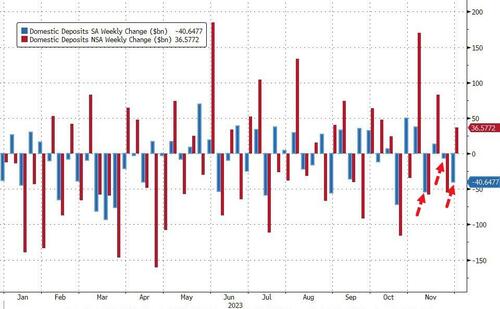
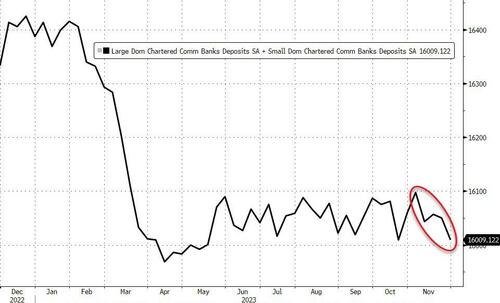
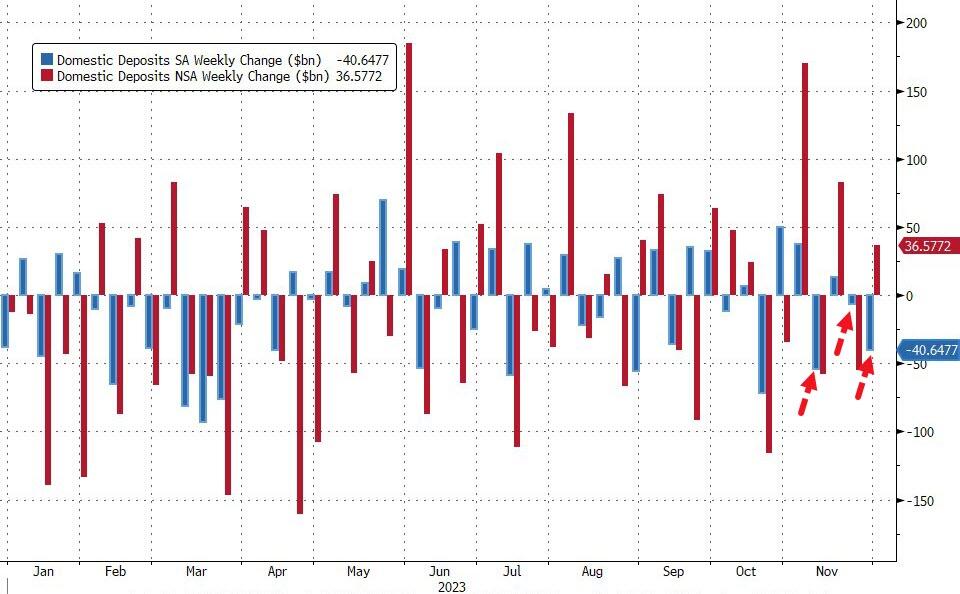
Excluding foreign bank deposits, domestic banks saw the third week of the last four of deposit outflows (-$40.6BN SA) with Large banks -$35BN (SA) and Small banks losing $5.7BN (SA). On an NSA basis, domestic banks saw inflows of $36.5BN last week with Large banks adding $32BN and Small banks adding $4BN…
Source: Bloomberg
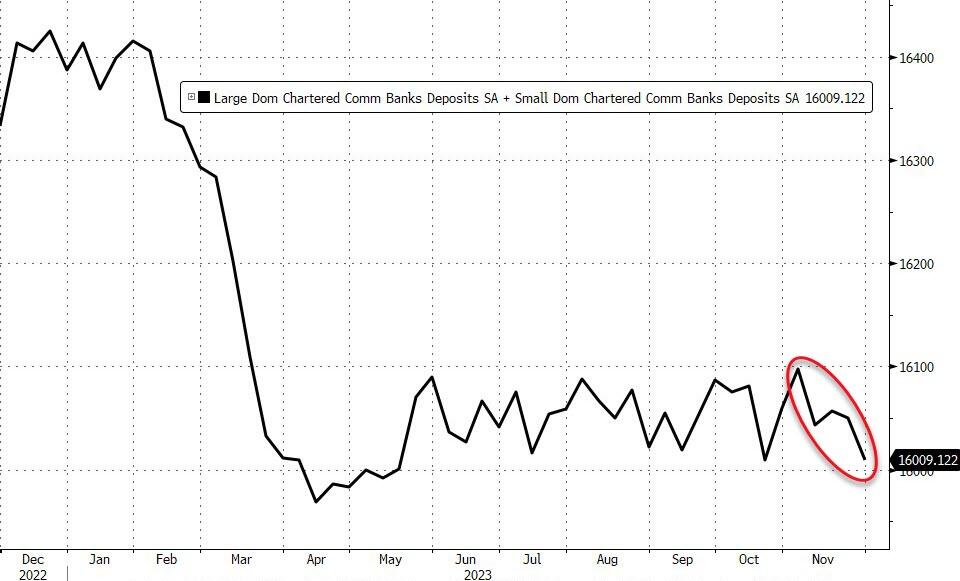
That adds up to $88BN (SA) of deposit outflows in the last four weeks (bank to its lowest total since May…
Source: Bloomberg
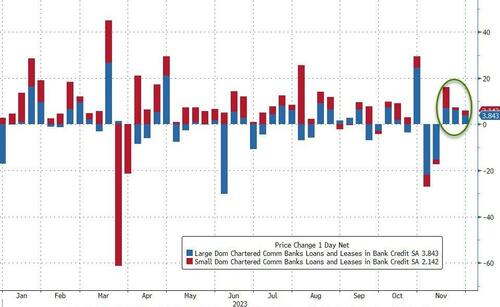
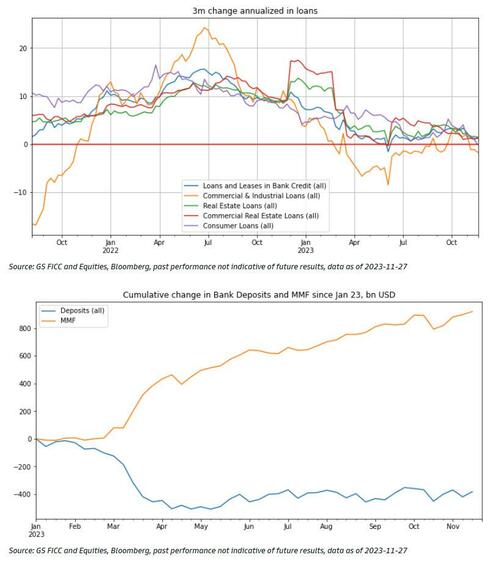
And on the other side of the ledger, despite deposits declining SA, loan volumes increased (SA) for the third week in a row with Small banks adding $2.1BN and Large banks adding $3.8BN…
Source: Bloomberg
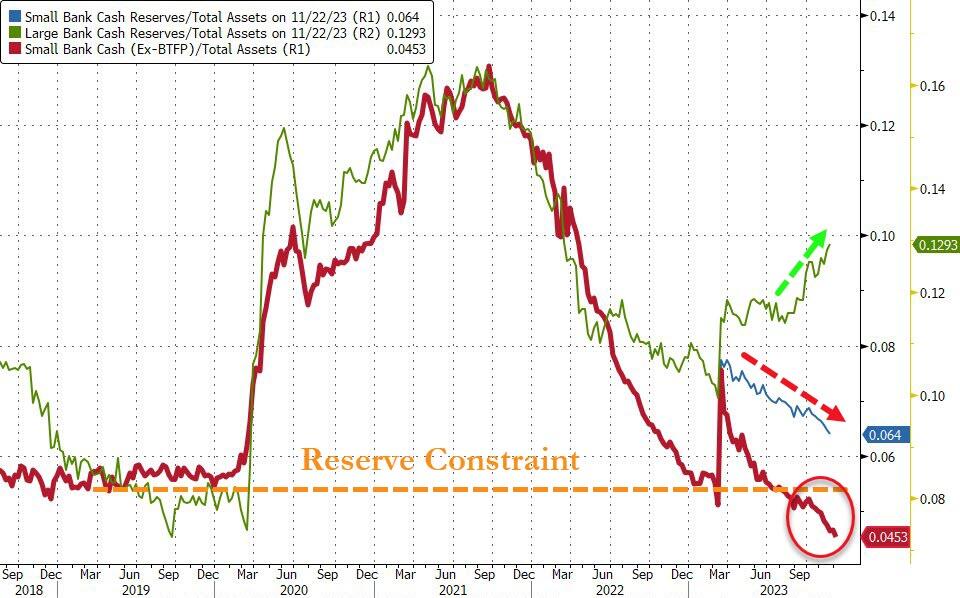
Finally, the key warning sign continues to trend ominously lower (Small Banks’ reserve constraint), supported above the critical level by The Fed’s emergency funds (for now)…
Source: Bloomberg
As the red line shows, without The Fed’s help, the crisis is back (and large bank cash needs a home – green line – like picking up a small bank from the FDIC).
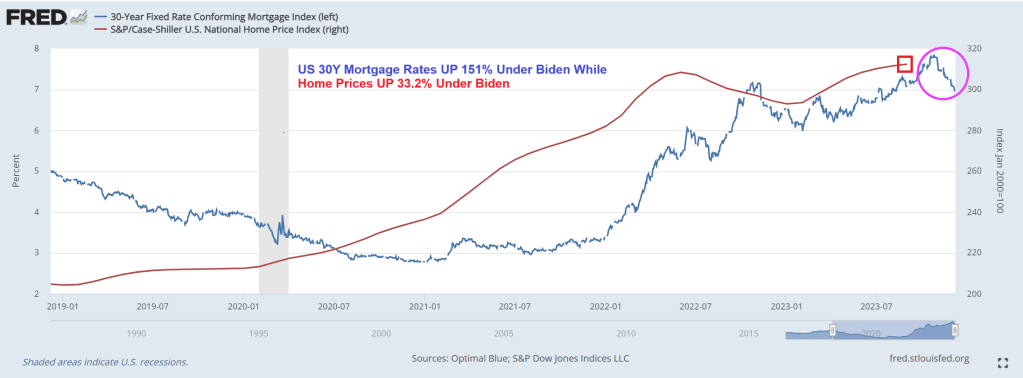
Mortgage rates, despite coming down recently, are still up 151% under Biden. And home prices are up 33.2%. So much for affordable housing for those renting.
So, “Running on Empty” applies to middle class and their ability to afford housing.
While the exciting headline is “Mortgage Purchase Demand rises 35%!” bear in mind that the level of mortgage purchase demand is still relatively low. This is volatility in mortgage applications.
Mortgage applications increased 2.8 percent from one week earlier, according to data from the Mortgage Bankers Association’s (MBA) Weekly Mortgage Applications Survey for the week ending December 1, 2023. Last week’s results include an adjustment for the observance of the Thanksgiving holiday.
The Market Composite Index, a measure of mortgage loan application volume, increased 2.8 percent on a seasonally adjusted basis from one week earlier. On an unadjusted basis, the Index increased 43 percent compared with the previous week. The seasonally adjusted Purchase Index decreased 0.3 percent from one week earlier. The unadjusted Purchase Index increased 35 percent compared with the previous week and was 17 percent lower than the same week one year ago.
The Refinance Index increased 14 percent from the previous week and was 10 percent higher than the same week one year ago. Mortgage rates declined last week, with the 30-year fixed-rate mortgage falling to 7.17 percent – the lowest level since August 2023.
And with 5 rate cuts priced in, we should see mortgage demand increasing in 2024.
On the hotness front, here are the 10 smokin’ housing markets. Strange that the hotness score is highest for generally depressed economic cities like Manchester NH, Rochester NY and Rockford IL. Hey, at least Columbus Ohio made the top 10 on the hotness list!
You might as well face it, markets are “addicted to gov.” Government monetary interference, that is. Government money printing and massive Federal spending.
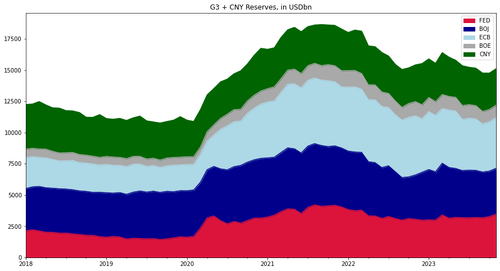
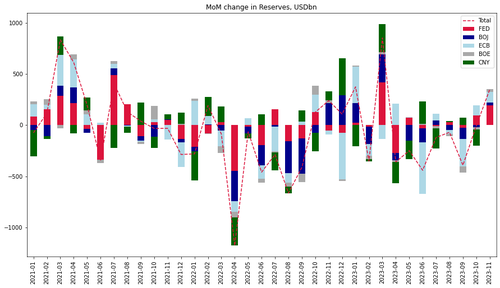
According to Goldman calculations, $350BN of liquidity (in USD terms) was added in November from the G4 central banks + the PBOC was nothing short of a fire hose.
In fact, this was the third largest monthly increase this year after January and March 2023.
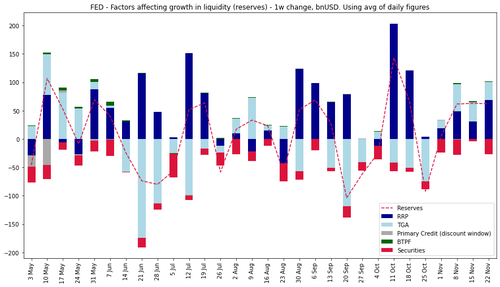
The US addition of $60bn for a third consecutive week plus weaker dollar are the main drivers.
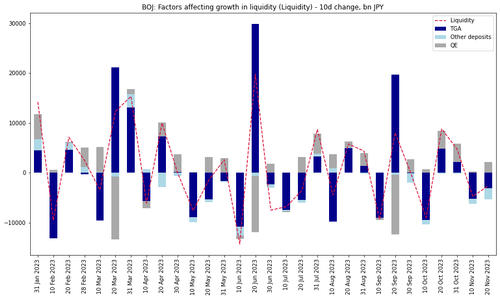
While the BoJ keeps adding liquidity via bond purchases, increases in the TGA balances in the past 20 days have net drained Yen liquidity.
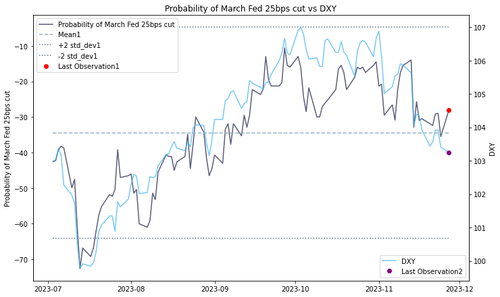
Looking forward over the year end and at the start of 2024, Goldman thinks that the US can keep adding liquidity via high bill issuance and RRP withdrawal over the next couple of months (something we discussed last month in “How Treasury Averted A Bond Market “Earthquake” In The Last Second: What Everyone Missed In The TBAC’s Remarkable Refunding Presentation“), while the dollar contribution to benign liquidity conditions could face some headwinds due to the risk of pricing out of some of the March Fed cuts as a result of the strong positive FCI impulse in November.
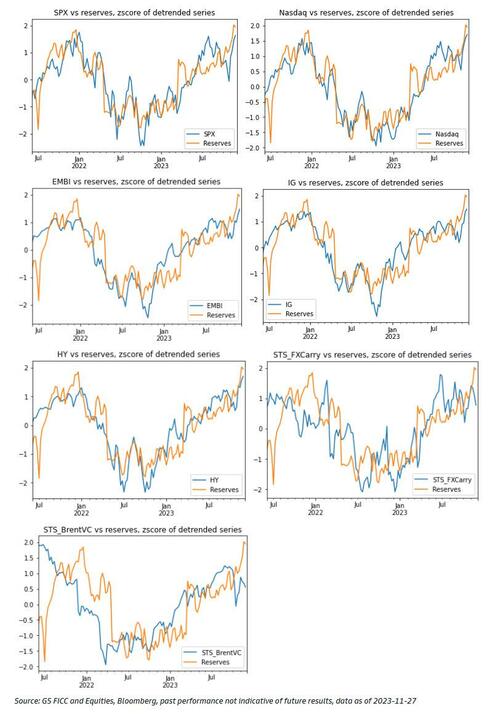
Goldman’s one-factor model for risky assets based on the liquidity cycle suggests that US IG and EM hard currency debt are cheap and the bank’s STS FX carry and Brent Vol Carry indices have under-performed the benign liquidity environment and may catch up the next two months.
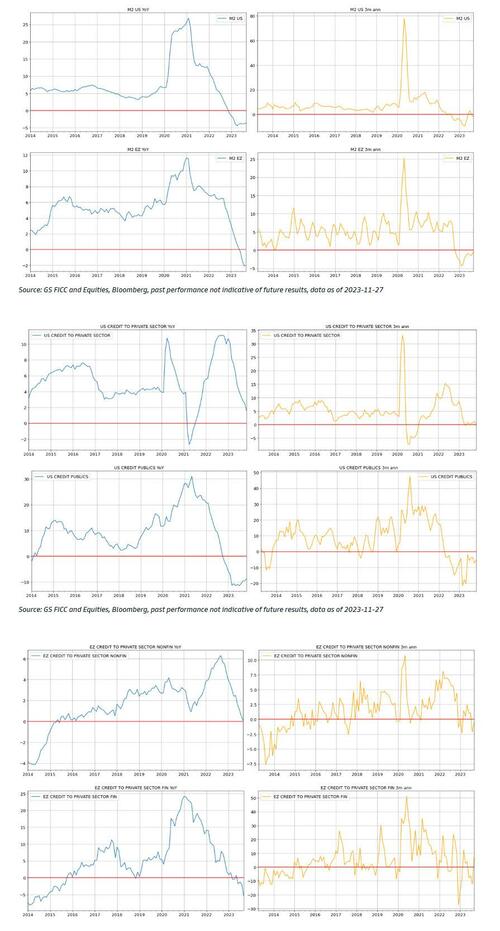
The US and Eurozone money supply and lending growth indicators remain weak, implying extended downside bias in domestic demand and inflation in H1-2024 (i.e., higher likelihood for easing absent a reflationary shock out of China or a supply-driven commodity price surge).
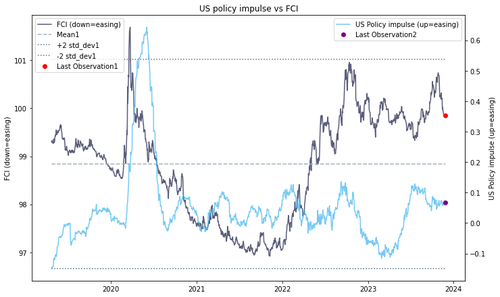
Finally, The US policy impulse (comprising of liquidity, fiscal stance, as well as nominal and real forward rates) has moved sideways in October and November after some renewed tightening in September. The GS FCI index eased nearly -100 basis points (-1.4z) in November.
Doctor, doctor (Yellen), we got a bad case of distortionomics (where the 1% wins and the 99% fall behind). After all, under Dr. Yellen as our Treasury Secretary, we are suffering from massive fiscal inferno with wild government spending. I would use “Government Gone Wild!” but the thought of Yellen … well, never mind.
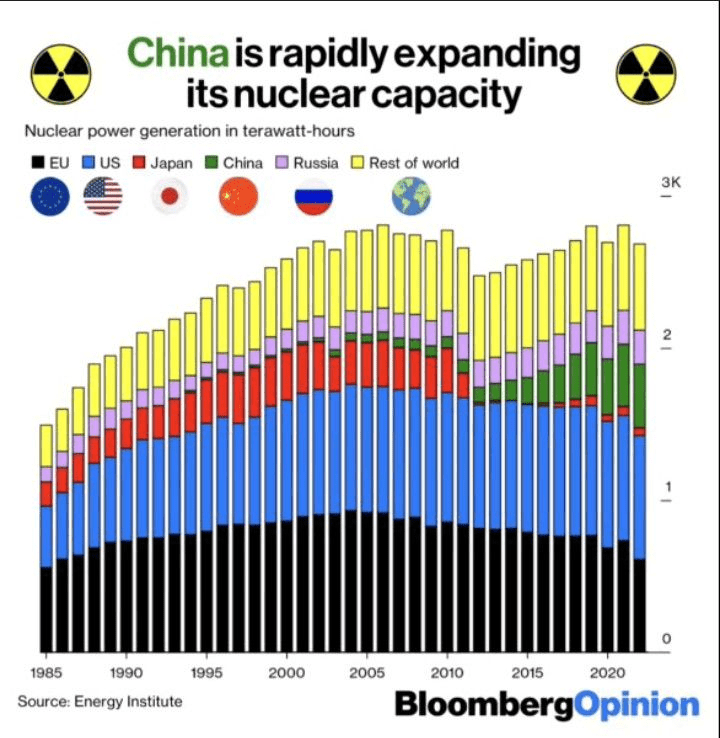
Meanwhile, while John Kerry pushes for ending ALL coal powered plants (good luck charging the thousands of EV charging stations on wind/solar power!), China is building NUCLEAR plants. While US green wimps (Kerry comes to mind) whine whenever nuclear plants are mentioned for the US.
But was it organic growth or simply The Federal Government funding the defense and green energy industies with trillions in spending?
One factor has been government spending which grew an unsustainably 4.7% in real terms over the last year. Outside the pandemic, this is one of the fastest rates in decades and works at a cross purpose with monetary policy objectives.
Bidenomics is code for massive Federal spending (and debt) to fund Federal priorities: wars in Ukraine, Israel and likely involvement around Taiwan. And the costly switch to green energy (but not nuclear, for some reason).
If the US economy growing simply to function as a war machine and wealth transfer mechanism from the middle class to the 1%, we are on the Highway To Hell. Personal consumption contributed 2.44% to the bottom line GDP print in Q3, down from the pre-revision number of 2.69% but well above Q2’s 0.55%.
The Federal Reserve reminds me of The Stones’ song “Tumbling Dice.” Why? The Fed can’t tell if inflation is cooling or re-accelerating. Hence, they are just rolling dice.
Let’s start with mortgage rates, a critical component of the housing and CRE markets. Mortgage rates remain up 163% since 2021, not great for housing affordability. Despite recent small declines in the mortgage rate. The 10Y-2Y Treasury curve is also going deeper into reversion … again.
However, the data was more mixed with US Manufacturing falling more than expected to 49.4 – back into contraction – (vs 49.9 exp) from 50.0 in October. However, US Services unexpectedly rose from 50.6 to 50.8 (exp 50.3).
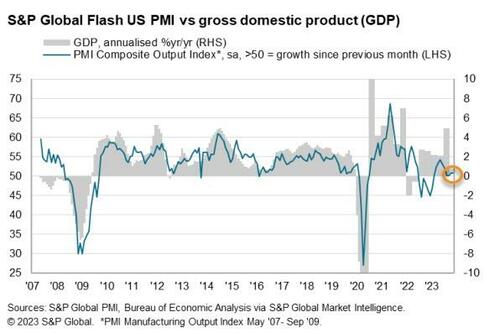
“The US private sector remained in expansionary territory in November, as firms signalled another marginal rise in business activity. Moreover, demand conditions – largely driven by the service sector – improved as new orders returned to growth for the first time in four months.
The upturn was historically subdued, however, amid challenges securing orders as customers remained concerned about global economic uncertainty, muted demand and high interest rates.
Businesses cut employment for the first time in almost three-and-a-half years in response to concerns about the outlook. Job shedding has spread beyond the manufacturing sector, as services firms signalled a renewed drop in staff in November as cost savings were sought.
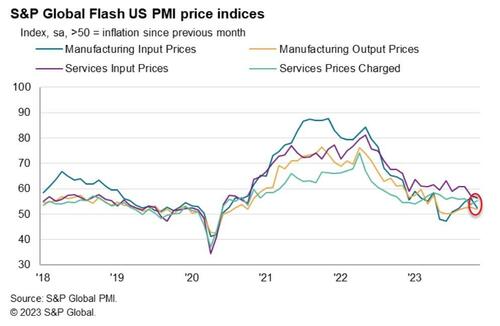
“On a more positive note, input price inflation softened again, with cost burdens rising at the slowest rate in over three years. The impact of hikes in oil prices appear to be dissipating in the manufacturing sector, where the rate of cost inflation slowed notably.
Although ticking up slightly, selling price inflation remained subdued relative to the average over the last three years and was consistent with a rate of increase close to the Fed’s 2% target.”
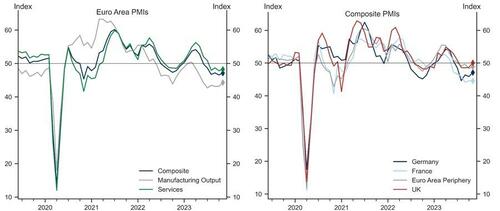
The US data comes after yesterday’s Euro area composite flash PMI increased by 0.6pt to 47.1, above consensus expectations, driven by a meaningful acceleration in Germany and the periphery, partially offset by a marginal decline in France. In the UK, the composite flash PMI improved meaningfully and entered expansionary territory at 50.1, above consensus expectations, on the back of a pickup in both sectors, with the services sector index entering positive territory at 50.5.
Goldman sees three main takeaways from today’s data.
First, we see a potential turning point in Euro area activity, with forward-looking indicators all improving in November, potentially setting a positive stage for the remainder of the year and the beginning of 2024. While the improvement seems to be broad-based, the upside surprises in the manufacturing sector in Germany and the Euro area as a whole may point to early signs of the sector’s revival.
Second, inflationary pressures, after moderating for some time, show signs of renewed intensification in the Euro area, as reflected by the output and input price components ticking up in November.
Third, UK growth momentum was meaningfully better than last month, and is picking up across the board, with the headline and services indices coming in above 50. This, however, is now accompanied by an increase in cost pressures, with both the input and output price indices edging up in November.
Finally, back to the US, S&P Global found that US business uncertainty was also heightened among US firms, as expectations regarding the year-ahead outlook slipped to the weakest since July.
A record 130.7 million people are expected to shop in stores and online in the U.S. on Black Friday this year, the National Retail Federation (NRF) estimates. The event is known for crowds lining up at big-box stores at dawn to scoop up discounted TVs and home appliances.
But at 6 a.m. on Friday at a Walmart in New Milford, Connecticut, the parking lot was only half full.
“It’s a lot quieter this year, a lot quieter,” said shopper Theresa Forsberg, who visits the same five stores with her family at dawn every Black Friday. She was at a nearby Kohl’s (KSS.N) store at 5 a.m.
Fifth Avenue, one of the world’s top shopping streets, is dead quiet on Black Friday — at least by New York’s boisterous standards.
The strip of high-end shops from brands like Louis Vuitton and Cartier has largely recovered since its pandemic lull, where vacancies had once reached nearly 30% in Midtown East. Some vestiges of that struggle remain, with a few empty storefronts covered up or filled with little art installations. Yet the street has managed to keep its title as the most expensive retail area on the planet by rent per square foot, according to Cushman & Wakefield.
Mortgage rates up 163% since 2021, manufacturing PMI in contraction and Black Friday shopping muted. Not good. The Fed is rolling the dice on what to do next.
The World Economic Forum (WEF) is a leading pusher of the ESG drug, pushed by the elite class intending to control the world. Unfortunately, numerous American politicians and influencers have attended the Davos meetings and have openly praised the WEF and its leader Klaus Schwab.
ESG investing, or sustainable responsible investing (SRI), uses this information about a company to inform investment decisions that prioritize all stakeholders.
Here’s how the Forum’s partners are leading the switch to stakeholder capitalism.
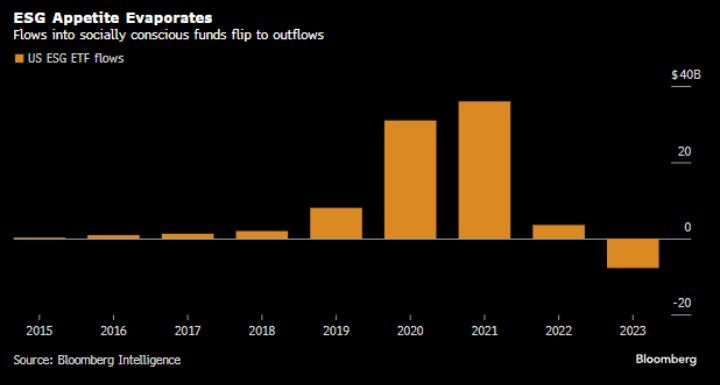
But all is not well with WEF’s ESG drug distribution. In fact, ESG flows into socially consious funds were a big thing during Covid (2020) and the first year of Biden’s Reign of Error. But ESG flows slowed sharply in 2022 and seeing net outflows in 2023.
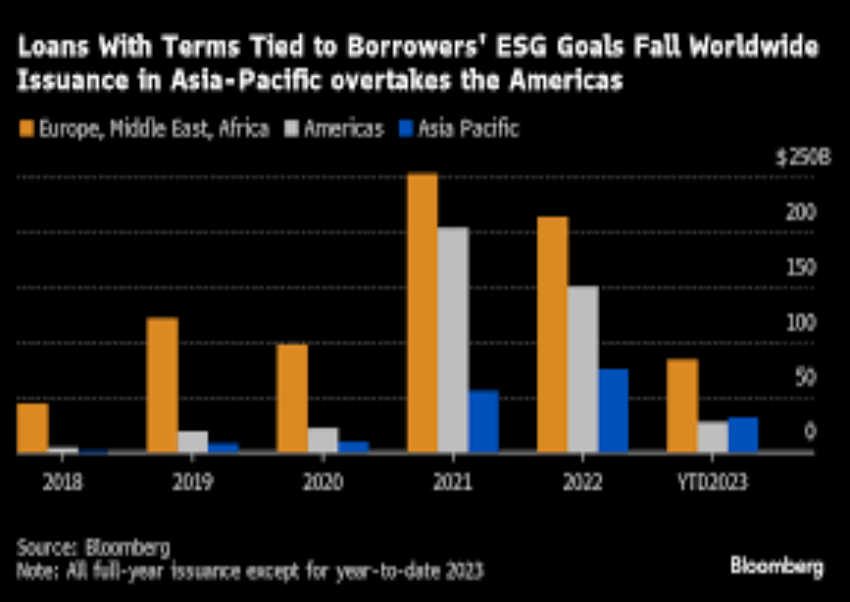
US borrowers are retreating en masse from the world’s second-biggest ESG debt class.
The $1.5 trillion market for sustainability-linked loans, in which borrowing is tied to environmental, social or governance goals, has seen an overall slowdown in volumes this year as both interest rates and greenwashing fears rise. But nowhere has the decline been as precipitous as in the US, where the number of new sustainability-linked loans is down 80% from a year earlier.
But ESG is still relatively popular in Europe, Middle East and Africa (orange). But taste for ESG is waning around the globe. But the selection of Biden as President in the US marked a surge in ESG -tied loans in 2021 and 2022 (not to mention the insane levels of spending out of Biden and Congress, much tied to the sustainability, green energy fantasy.
Loans with terms tied to borrower’s ESG goals have fallen worldwide.
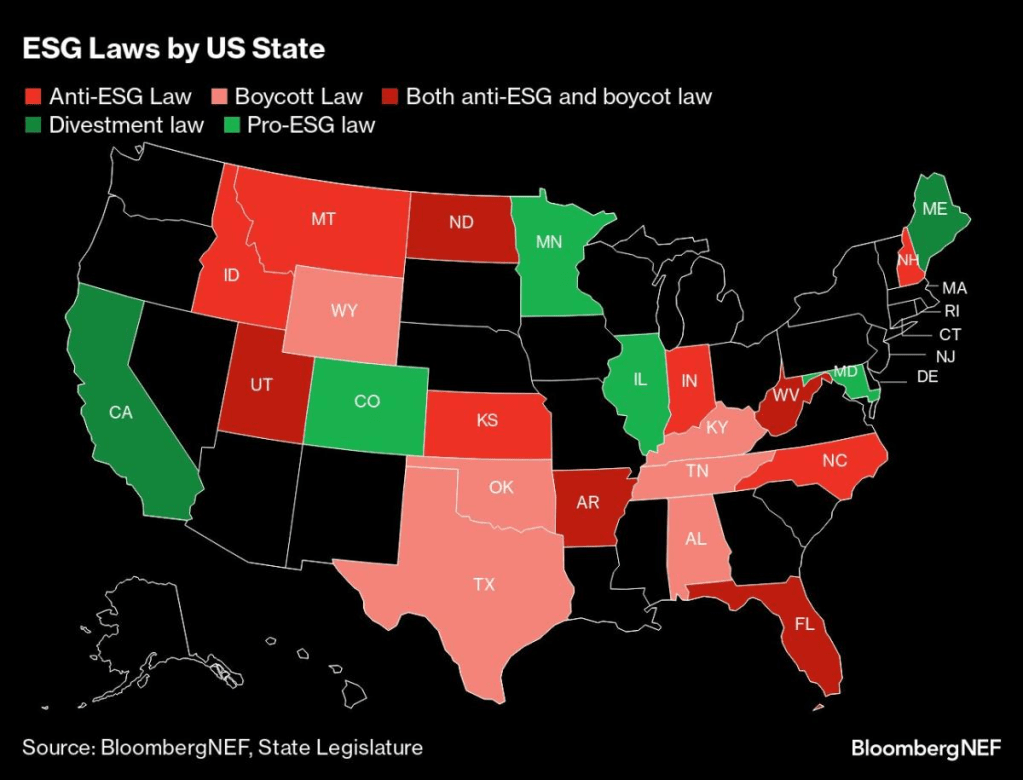
Several states (largely blue states like California, Minnesota, Illinois, and Colorado have pro-ESG laws) while several states have anti-ESG laws (largely red states like Montana, Idaho, North Dakota, Kansas, Utah, Indiana, Arkansas, Florida, and West Virginia).
And of course, global warning may not be as dire as John Kerry and Greta Thunberg say.
WEF’s Klaus Schwab about to get sniffed by his 80-year old puppet, Joe Biden. In fact, Biden is singing “I’m your puppet.”
Here is Hunter Biden welcoming the Green Energy fairy and all the trillions in misallocated spending it brings.
Even eating breakfast under Bidenomics is more expensive. Particularly if you like orange juice like I do. To save money, I am probably going to have to switch to nasty-tasting Tang.
Food CPI is up 3.69% year-over-year. The rate of growth in food prices is slowing. But do I trust BLS data on CPI? Of course not.
Orange juice prices are up 47% under Biden.
And we see that REAL GDP is growing at a slower rate than nominal GDP.
Speaking of Bidenomics, here is an interesting Zero Hedge story on “The Biden-Du Pont Nexus: From A Prestigious Golf Club To A Controversial Child Rape Plea Deal.” What is it with Delaware elites having sex with their children?? And why is NY AG Letitia James prosecuting Donald Trump when there has been no crime while she let’s Epstein’s clients who flew to have sex with minors (used to be illegal) off the hook?
But I feel good! After my breakfast of … Scotch Broth. OJ is just too expensive.
On a amusing or sad note, Biden campaign communications director Michael Tyler’s message to Americans who are worse off economically under Biden: “That’s precisely why we need another four years to finish the job.” OMG! What does “finish the job” mean?? I am afraid to ask.
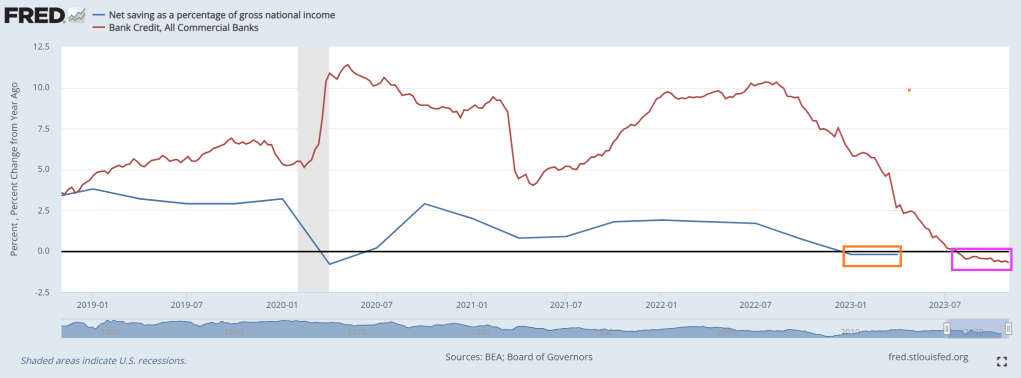
Where we currently sit is … bank credit growth is in the red (15th straight week of negative growth) and net savings as a percentage of gross national income has seen negative growth YoY for 2 consequtive quarters.
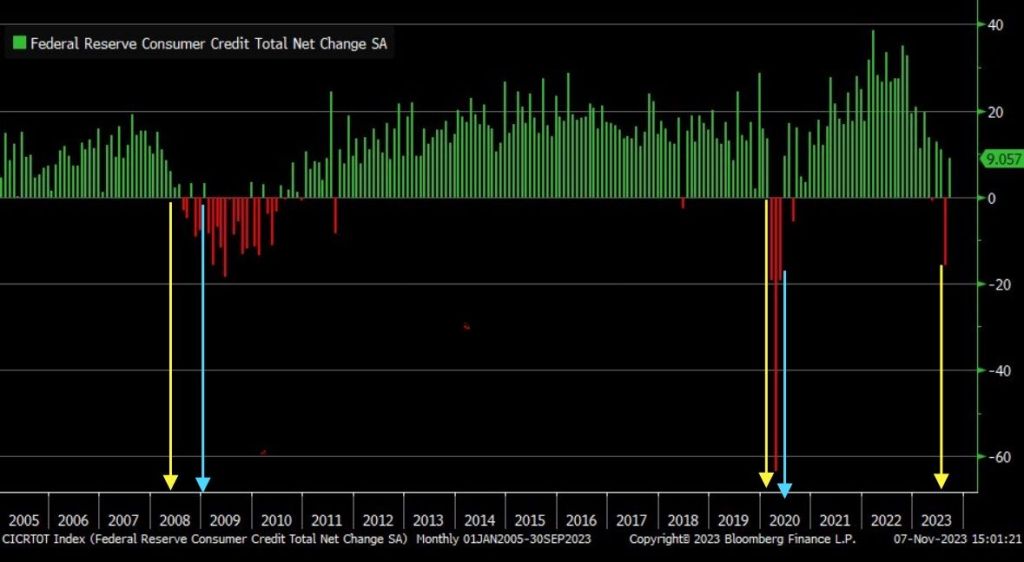
September marked the largest consumer credit drop since May 2020, signaling a significant recession warning.
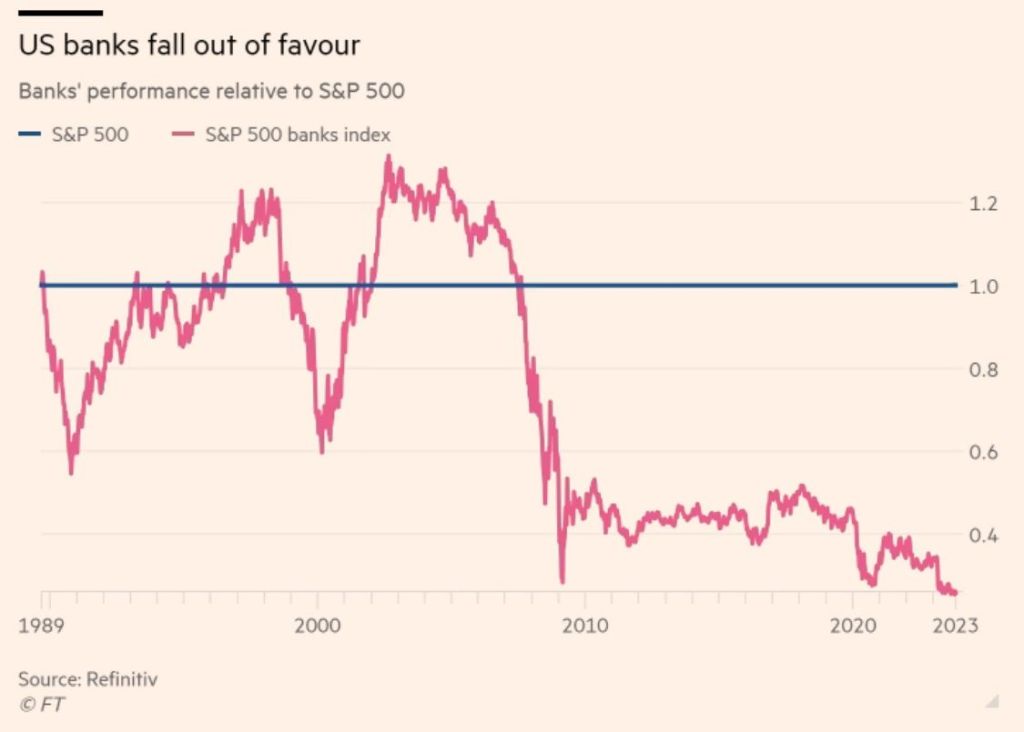
And with Bidenflation (or Yellenflation) and The Fed’s counterattack, we are seeing bank stocks losing relative to the tech sector.
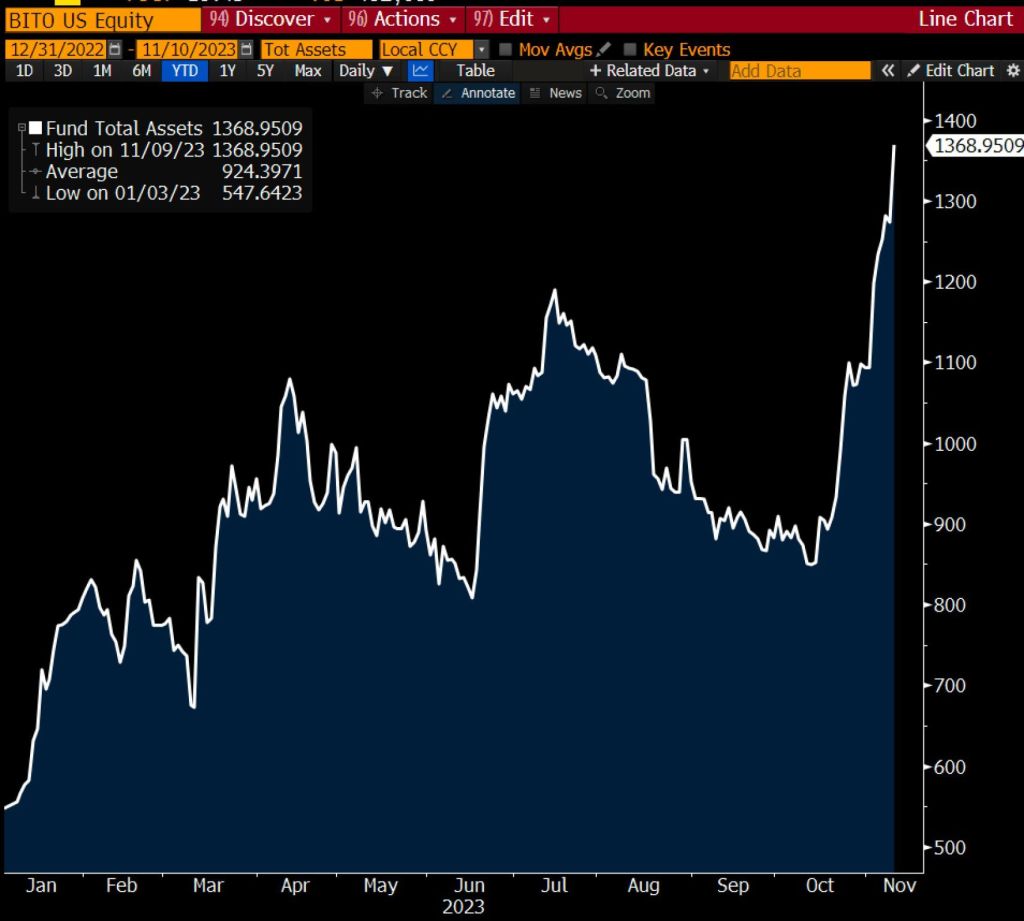
Proshares Bitcoin (BITO)’s assets have nearly doubled in the past 30 days.
Yes, the Three Stooges (Biden, Yellen, Powell) have put the US on a highway to hell!


You must be logged in to post a comment.