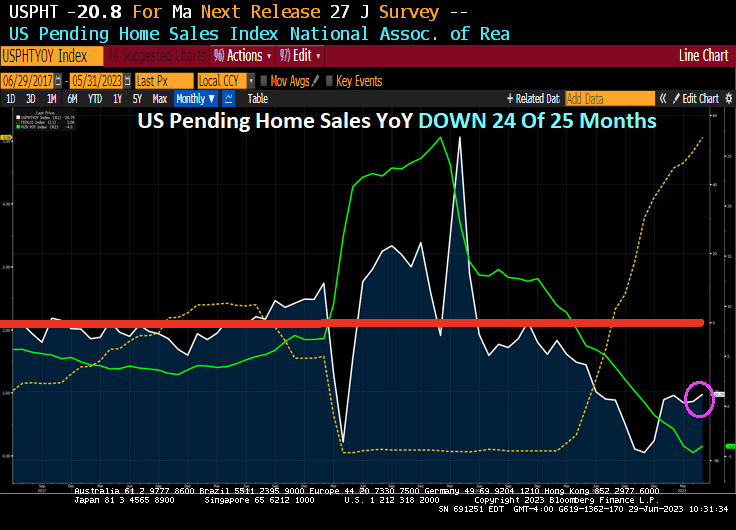
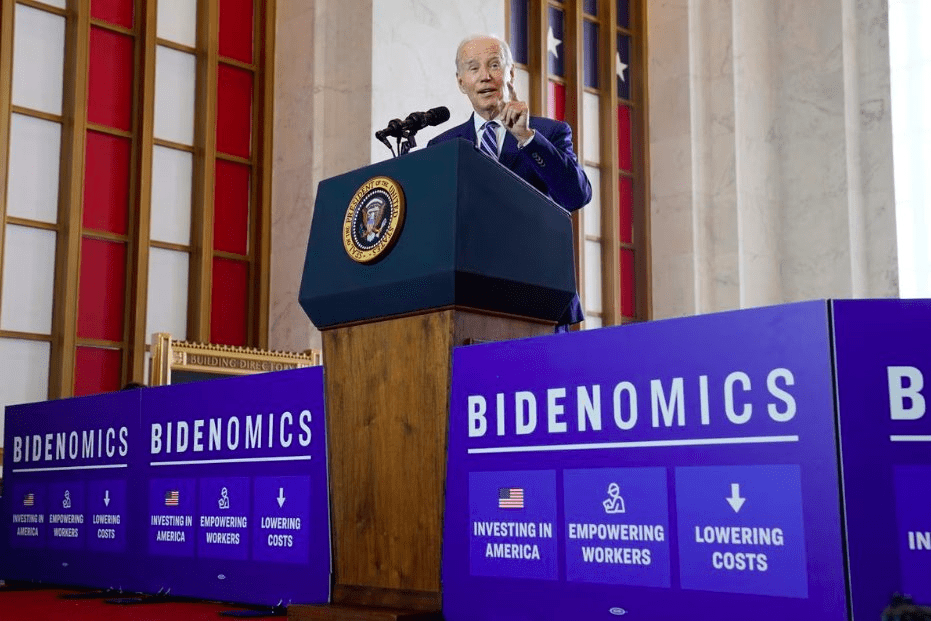
Bidenomics? Yes, an economy where inflation crushes the middle class and low wage workers with 2 years of negative wage growth and now 24 or the last 25 months of negative growth rates of Pending Home Sales YoY.
After existing home sales were flat and new home sales exploded higher, pending home sales once again are the tie-breaker on May’s housing market (and were expected to decline 0.5% MoM). The actual print was considerably worse than expected, down 2.7% MoM (and April was revised down from unchanged to -0.4% MoM). Pending Home Sales were down -20.8% YoY in May.
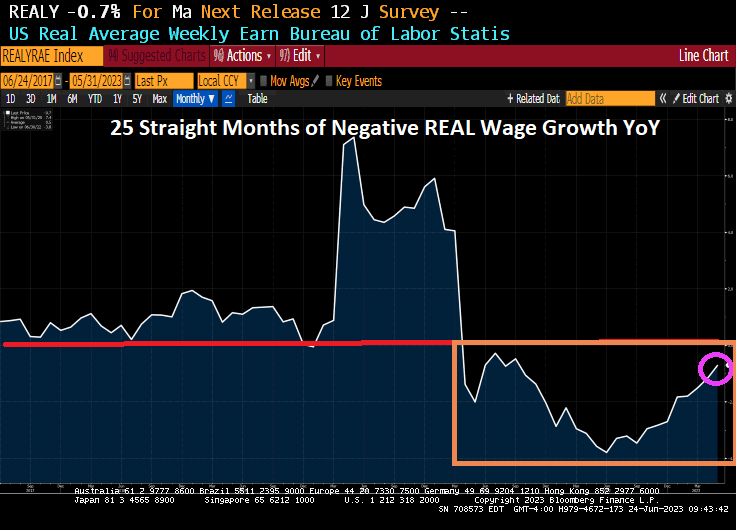
This is not exactly surprising given that Americans have suffered from 25 straight months of NEGATIVE real weekly earnings growth.
“C’mon man! The Biden clan is getting filthy rich with foreign bribes! Stop the malarkey about Bidenomics being a disaster!”
Jay Leno once quipped about the Obama meal. “Order anything you want and hand the bill to the person standing behind you.” Biden, like his boss Obama, is praciticing a similar strategy. Spend like a drunken sailor and just keep borrowing until the whole thing breaks.
The barrage of fresh Treasury bills poised to hit the market over the next few months is merely a prelude of what’s yet to come: a wave of longer-term debt sales that’s seen driving bond yields even higher.
Sales of government notes and bonds are set to begin rising in August, with net new issuance estimated to top $1 trillion in 2023 and nearly double next year to fund a widening deficit. The Treasury is already in the middle of an estimated $1 trillion bump in bills as it seeks to replenish its cash coffers in the wake of the debt-limit deal.
It’s an explosive mix for borrowing costs as debt sales are swelling and the Federal Reserve continues to reduce its balance sheet at a time when traditional buyers of Treasuries overseas are discouraged by currency hedging costs.
“A worsening fiscal profile, amid fairly modest spending cuts, suggests that the upcoming supply deluge will not be limited to T-bills,” wrote Anshul Pradhan, head of US rates strategy at Barclays Plc. “The Treasury will soon need to increase auction sizes meaningfully across the curve. We believe the rates market is too complacent.”
Barclays strategists predict the net rise in coupon-bearing debt from August to year-end will be nearly $600 billion. And that would only ramp up in 2024, they say, with an annual figure of $1.7 trillion. That would be nearly double this year’s expected debt issuance.
Pradhan says he doesn’t think the market appreciates the increase in issuance that’s going to be needed due to wide budget deficits and the fact the Treasury won’t want bills to become a substantial share of the total debt.
Total net new bill sales are set to bring their share of US debt to about 20%, according to JPMorgan Chase & Co. The issuance would hit a threshold seen by the Treasury Borrowing Advisory Committee as the upper limit for the US to fund deficits at the least possible cost to taxpayers.
Bank of America Corp. says the supply deluge could result in a “demand vacuum” for longer maturity bonds that could push yields higher and tighten financial conditions.
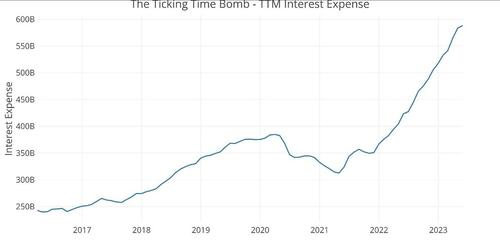
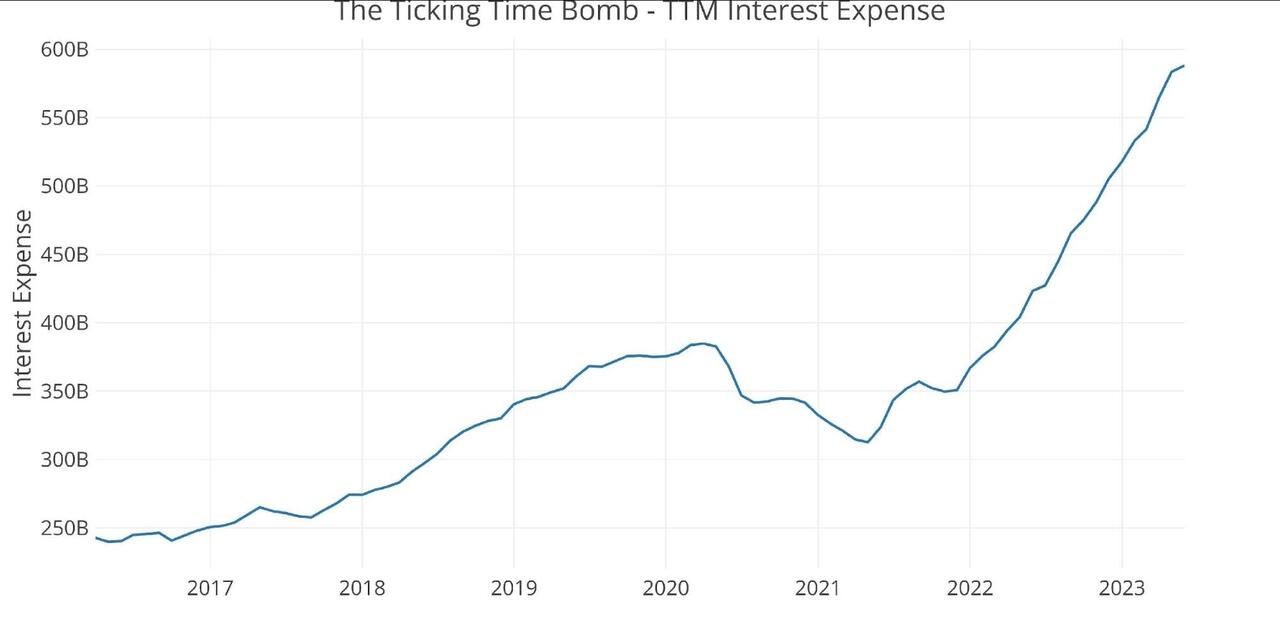
The problem isn’t purely a function of more debt. The bigger issue is that this new debt comes with a much steeper price tag. Interest on the national debt is rising at an alarming clip.
The trailing 12-month (TTM) interest on the debt clocked in at just under $600 billion in May. This was up from $350 billion at the start of 2022, less than 18 months ago. The government has added an extra $250 billion in expenses per year on just debt service.
This is just the beginning of an upward trend. Based on the current interest payments, the Treasury is paying less than 2% interest on the total debt. But a lot of the debt currently on the books was financed at very low rates before the Federal Reserve started its hiking cycle. Every month, some of that super-low-yielding paper matures and has to be replaced by bills, notes and bonds yielding much higher rates. That means interest payments will quickly climb much higher unless rates fall.
Looking at the Treasury sale on June 26 reveals the extent of the problem. The Treasury sold $162 billion in securities, with $120 billion in short-term Treasury bills with high yields.
$58 billion in six-month bills at an investment yield of 5.45%
$62 billion in three-month bills at an investment yield of 5.34%.
$42 billion in two-year notes at a high yield of 4.67%, amid very strong demand. Longer-term yields are still far below short-term yields.
With this flood of Treasury bills, the share of short-term paper underpinning the debt is approaching 20%. That’s considered the upper limit, meaning the Treasury will soon have to turn to issuing longer-term notes and bonds. That means the Treasury will be locking in higher interest rates for the long term.
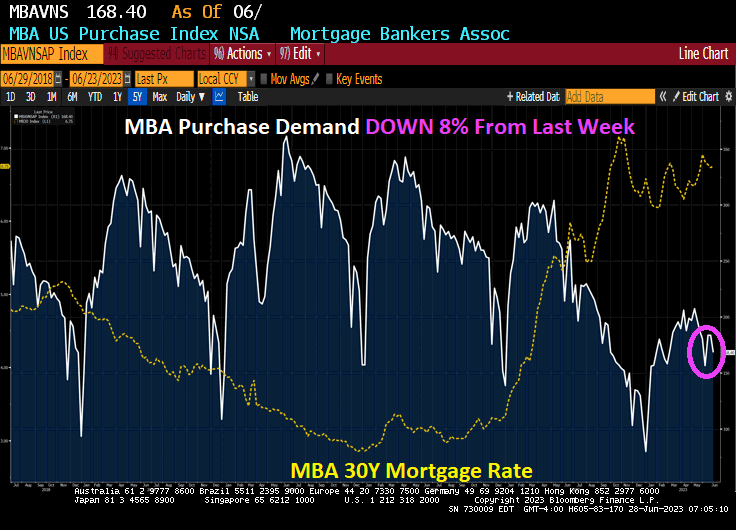
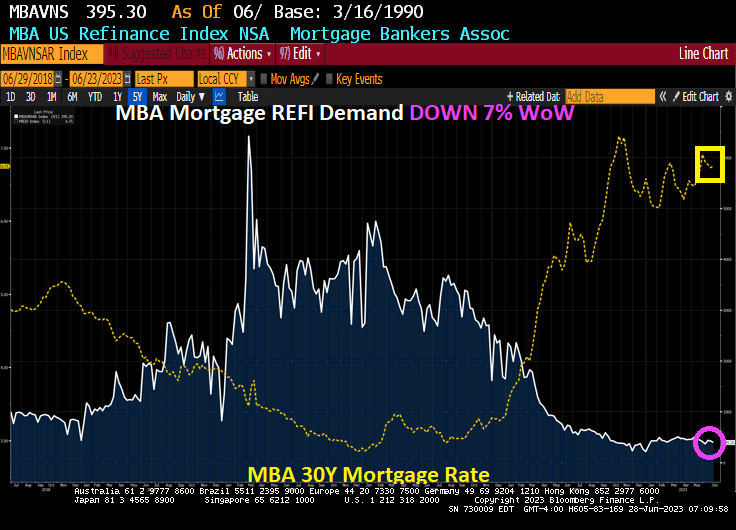
Eggs, bacon and toast. All more expensive under Biden’s economy. And mortgage purchase demand is down -45.3% since Biden was elected and mortgage refinancing demand is down -91% under Biden and mortgage rates are up 128% under Biden’s economy.
Mortgage applications increased 3.0 percent from one week earlier (using seasonally adjusted data), according to the Mortgage Bankers Association’s (MBA) Weekly Mortgage Applications Survey for the week ending June 23, 2023. This week’s results include an adjustment for Juneteenth holiday.
The Market Composite Index, a measure of mortgage loan application volume, increased 3.0 percent on a seasonally adjusted basis from one week earlier. On an unadjusted basis, the Index decreased 8 percent compared with the previous week. The seasonally adjusted Purchase Index increased 3 percent from one week earlier. The unadjusted Purchase Index decreased 8 percent compared with the previous week and was 21 percent lower than the same week one year ago.
The Refinance Index increased 3 percent from the previous week and was 32 percent lower than the same week one year ago.
Now for the highly (self) touted Biden economy: Mortgage purchase demand is DOWN DOWN -45.3% under Biden, Refi demand is DOWN -91% under Bidenomics, and mortgage rates are UP 128% under Clueless Joe’s Reign of economic error.
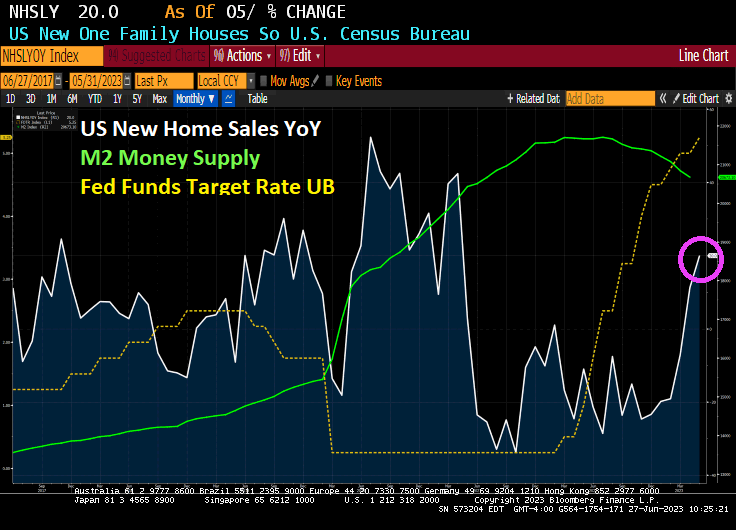
Well its about time that homebuilder started building again! And maybe it was The Fed rate hike pause (and possible rate cuts in the future.
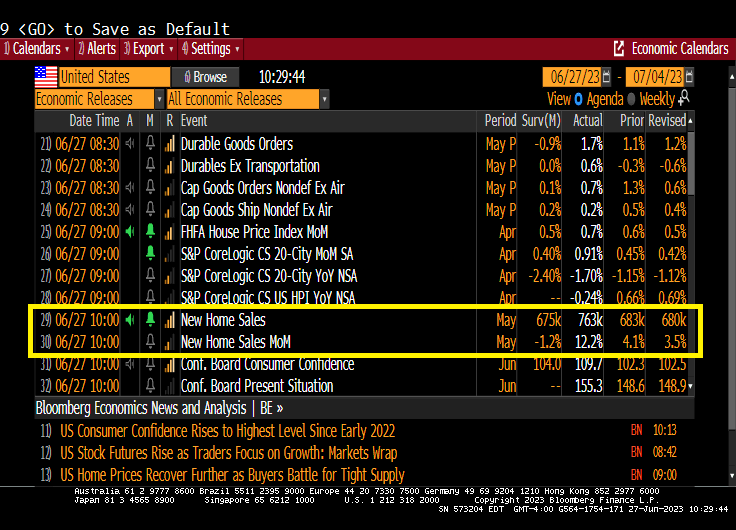
US new home sales rose 20% in May as The Fed pauses rate hikes.
Fed Funds Futures point to one or two more rate hikes, then down she goes!!!
763k new homes were added in May
Remember, there is still a lot of stimulus (M2) sloshing around the economy. Perhaps we can rename all the infrastructure stimulus that is leaking out into the economy “Buttigieg Bucks.” Or “Buty Bucks!”
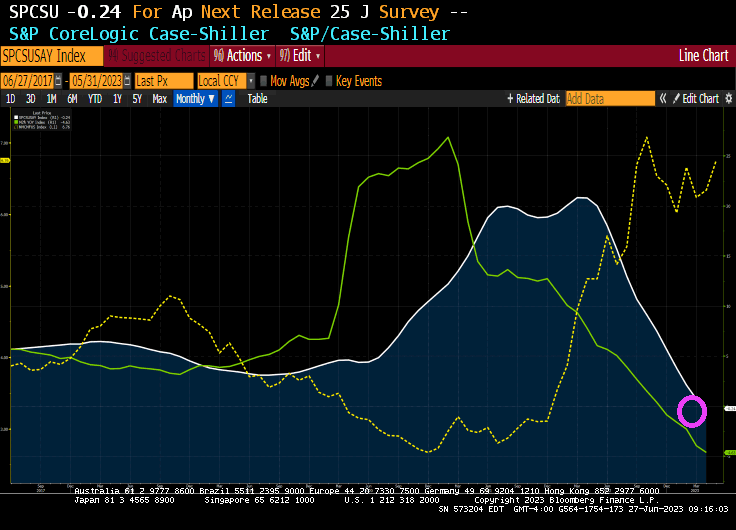
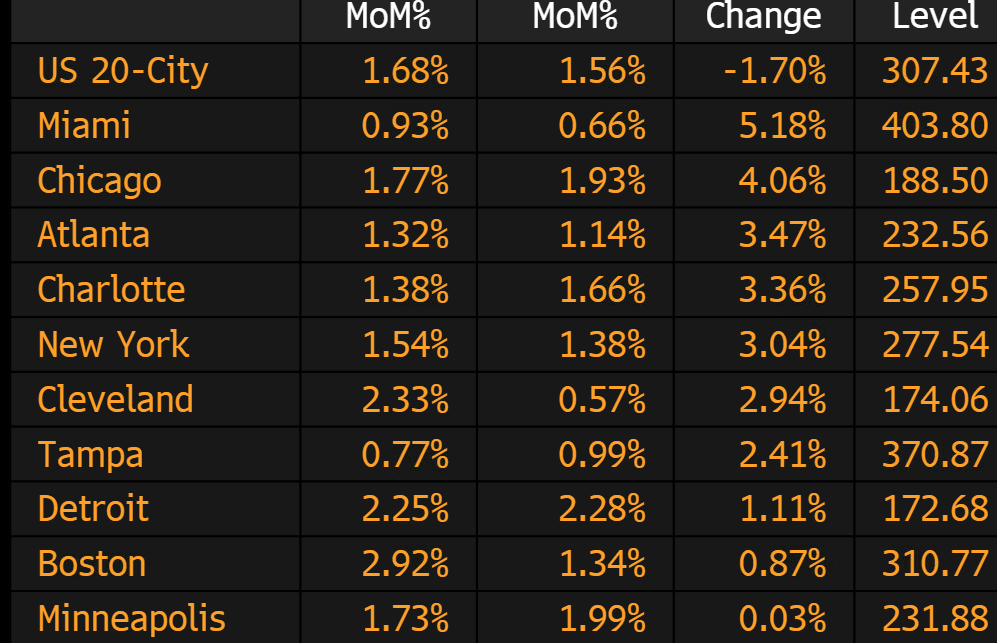
The S&P CoreLogic Case-Shiller U.S. National Home Price NSA Index, covering all nine U.S. census divisions, reported a -0.2% annual decrease in April, down from a gain of 0.7% in the previous month. The 10-City Composite showed a decrease of -1.2%, down from the -0.7% decrease in the previous month. The 20-City Composite posted a -1.7% year-over-year loss, down from -1.1% in the previous month.
The winners in April? Miami and … Chicago?
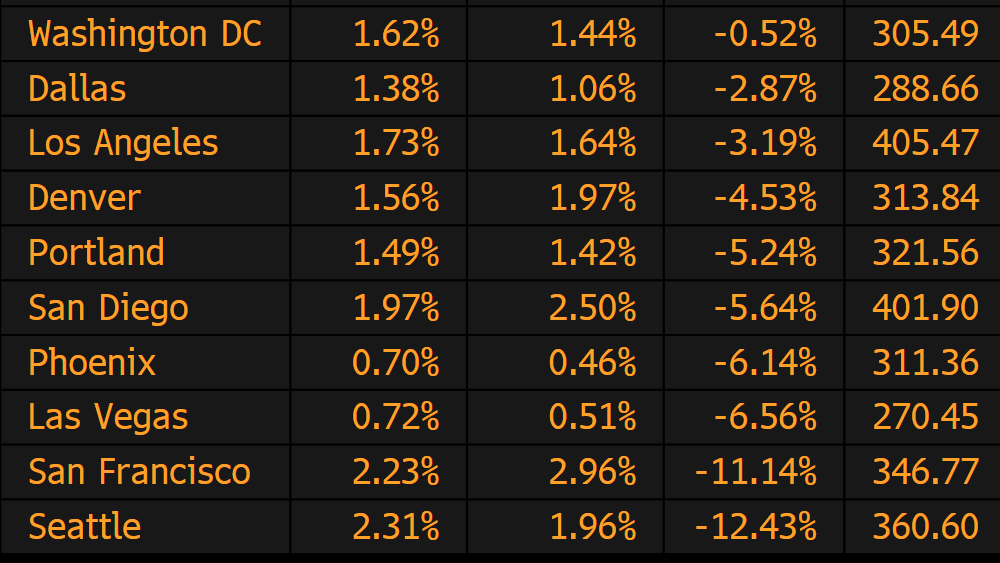
The biggest losers in April? Seattle and San Francisco both suffered YoY losses over -11%.
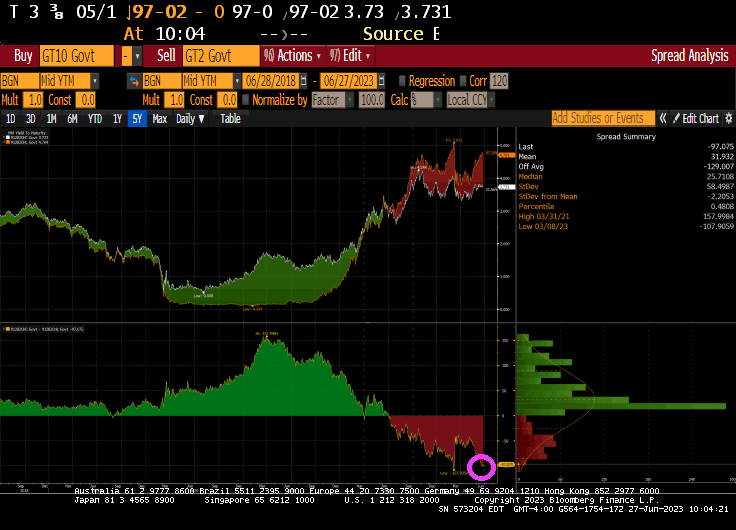
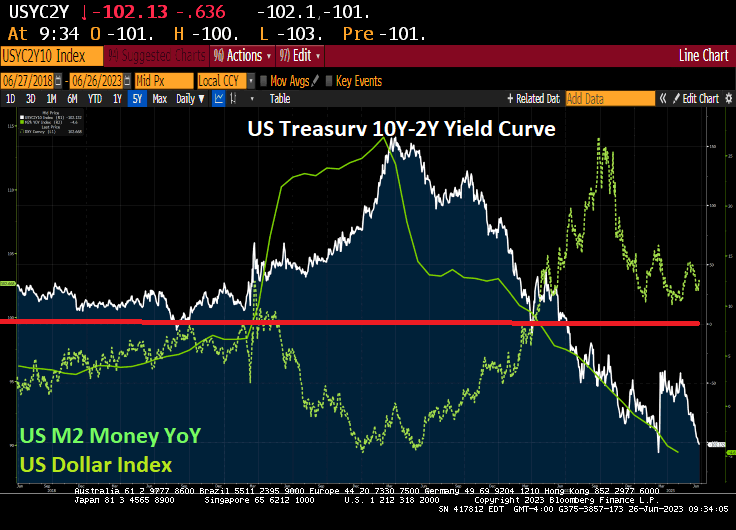
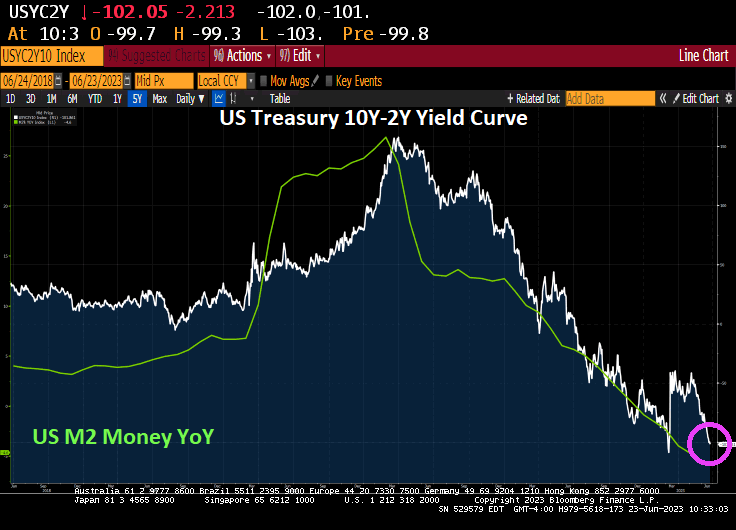
The US Treasury 10Y-2Y yield curve remains steeply inverted at -97 basis points.
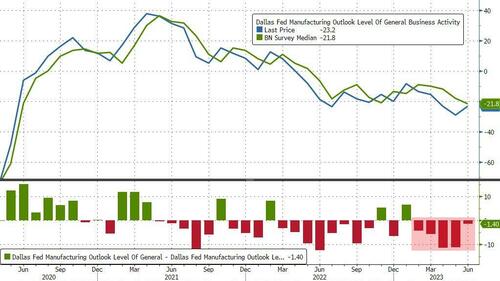
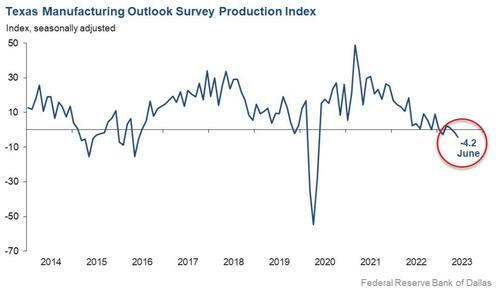
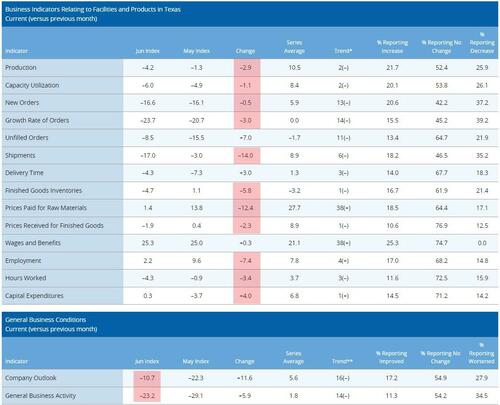
Texas factory activity declined in June, according to business executives responding to the Texas Manufacturing Outlook Survey. The production index, a key measure of state manufacturing conditions, fell three points to -4.2, a reading indicative of a slight contraction in output.
Labor market measures suggest weaker employment growth and declining work hours. Price pressures evaporated, while wage pressures remained elevated…
Yes, the Biden Administration may be the most incompetent administration in US history with Congress a close second. And did I mention CORRUPT??
Silverado! No, not the Chevy full-size pickup truck, but the precious metal Silver is up over 1% this morning!
The US Treasury 10Y-2Y yield curve remains inverted at -102.7 basis points for the 244th straight day as M2 Money YoY (aka, liquidity) evaporates.
Silver is up over 1% this morning.
Bitcoin Cash is up12.39% this morning.
Speaking of Silverado, a fully loaded new 2023 Chevy Silverado 1500 ZR2 costs around $100,000. Thanks Biden and Powell (BiPow?). Try financing that purchase with auto loan rates soaring!
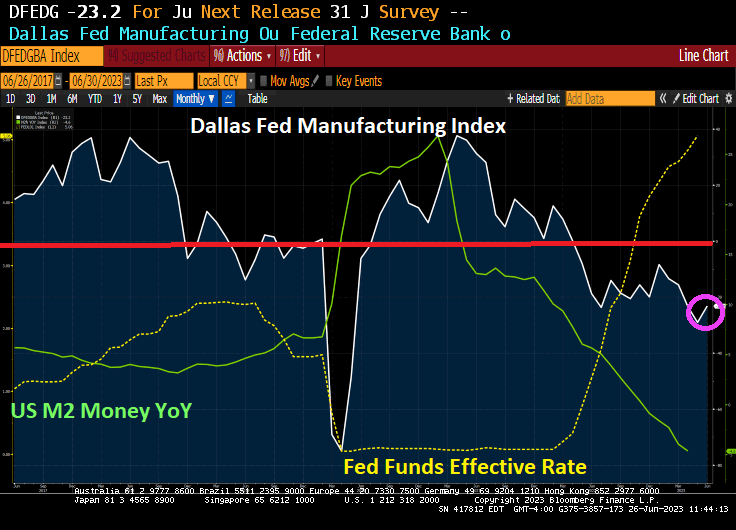
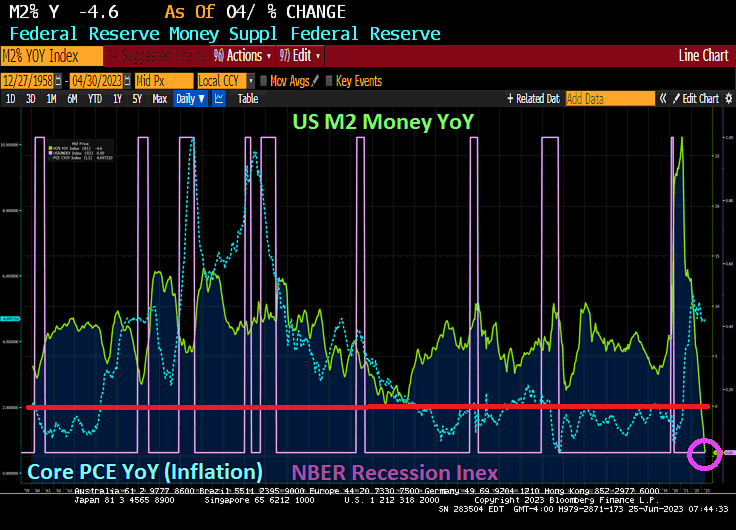
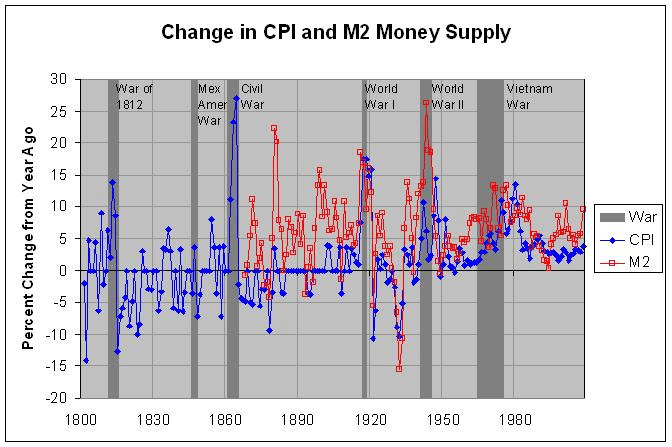
Money supply growth fell again in April from Jerome Powell And The Fed, plummeting further into negative territory after turning negative in November 2022 for the first time in twenty-eight years. April’s drop continues a steep downward trend from the unprecedented highs experienced during much of the past two years.
Yes, The Fed is printing money like it is going out of style! The war on Covid was similar to other wars fought where the US printed boatloads of money to pay for WWI. WWII, Korea and Vietnam wars. And the war against the middle class (known as The Best Depression). Apparently, The Fed is still waging war against the middle class.
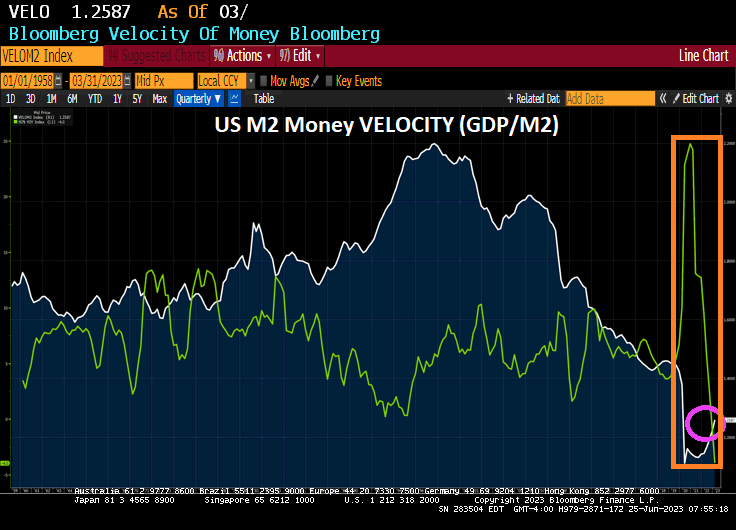
US M2 Money VELOCITY (GDP/M2) is near an all-time low after The Fed went berserk with money printing to combat the Covid economic and school shutdowns.
Then with The Fed’s massive monetary expansion and sudden contraction, we have REAL average weekly earnings growth YoY in negative territory for 25 straight months.
The Walking Dead’s Negan, the poster child for The Federal Reserve.
I could have used 3 shades of Joe, but 50 shades of Joe sounds better!
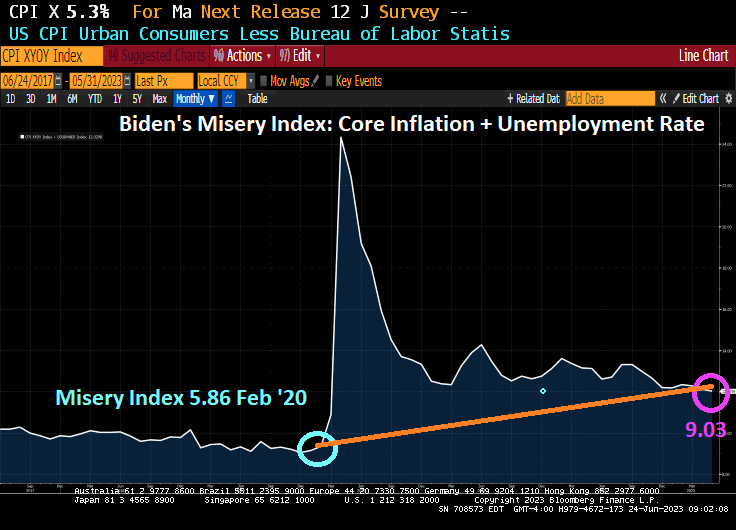
But the fact remains that Americans are far more miserable under Biden than they were under Trump before the Chinese Wuhan Covid virus was unleashed. 9.03 today (Core CPI YoY + U-3 Unemployment) than it was in February 2020 under Trump (5.86). While not twice as bad, inflation is continues to cause serious problems for America’s middle class and low-wage workers.
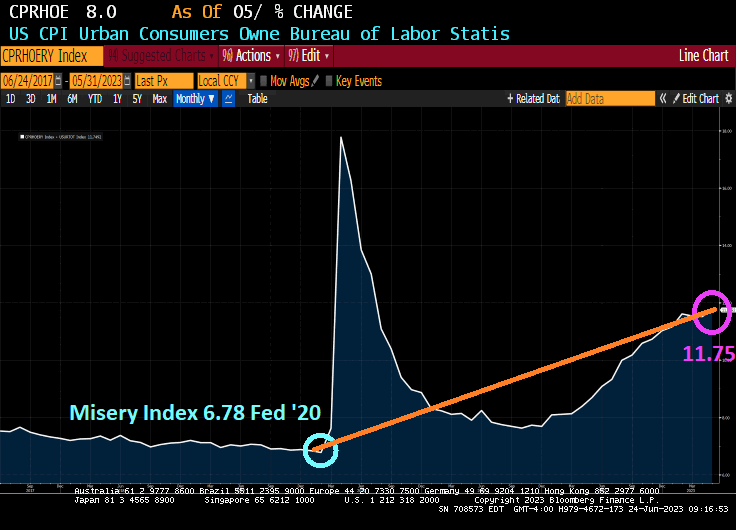
Speaking of the middle class and low wage workers, let’s look at the Renter’s Misery index (CPI Owner’s equivalent rent YoY + Unemployment rate). It was 6.78% in February 2020 under Trump and before Covid struck and is now 11.75% under Inflation Joe.
Speaking of misery, how 25 straight months of negative REAL wage growth? Real weekly wage growth went negative in April 2021, just a few months after Biden was installed as President.
Now, there was winners under Biden. Green energy donors, the big banks, big pharma, big tech, but media … essentially any big donors from big entities got massive payoffs. The middle class and low-wage workers? As Jerry Reid once sang, “They got the coal mine and we got the shaft.”
The US is Living La Vida Biden (living the Biden life!) Which means you are making millions if you are a political elite, but suffering if you live on Main Street.
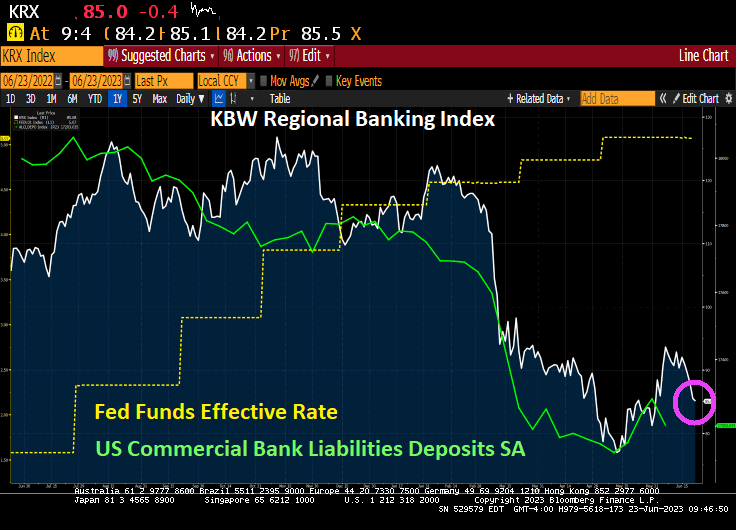
And regional banks (not the TBTF national banks) continue to suffer. The Bank Term Funding Program (1 of 2) is skyrocketing as The Fed cranks up rates to fight BidenFedflation (a combination of excessive monetary stimulus by The Fed and Biden’s lousy economic policies) and M2 Money growth crashes.
The regional banking index continues to fall as bank deposits shrink (like me when I used to jump in the Pacific Ocean in Santa Cruz).
Cryptos down this morning. But Bitcoin is above $30,000 … again.
Oil is down this morning but gold and silver are up slightly.
The 10Y-2Y US Treasury yield curve just dipped below -100 basis points (steep inversion) as M2 Money growth crashed and burned.


You must be logged in to post a comment.