US Manufacturing Activity Shrinks By Most in Three Years As Cardboard Box Shipments Declining At Fastest Rate Since Financial Crisis) Ethereum UP >2% This AM

I was hoping that the week of July 4th would start off with fireworks, but we got bad news about the economy.

US factory activity contracted for an eighth month in June, slipping to the weakest level in more than three years as production, employment and input prices retreated.

The Institute for Supply Management’s manufacturing gauge fell to 46, the weakest since May 2020, from 46.9 a month earlier, according to data released Monday. The current stretch of readings below 50, which indicates shrinking activity, is the longest since 2008-2009.
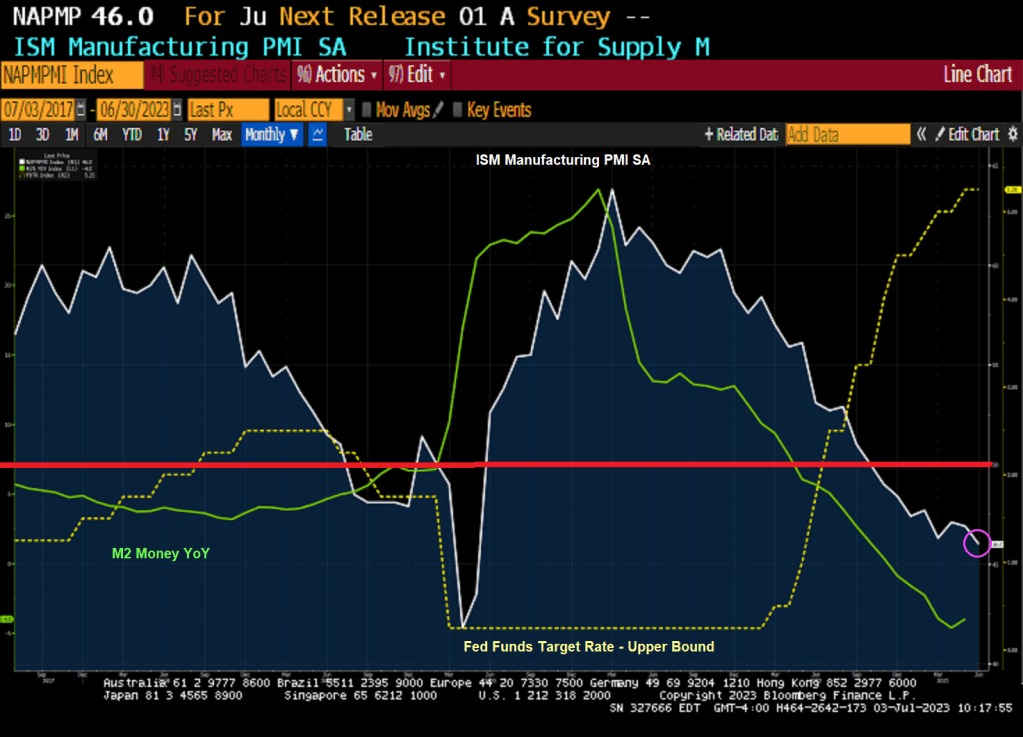
The decline in the ISM production gauge, which also stands at the lowest level since May 2020, suggests demand for merchandise remains weak. The index of new orders contracted for the 10th straight month and order backlogs shrank, which may help explain a pullback in a measure of manufacturing employment.

The ISM gauge retreated to a three-month low and, at 48.1, indicates fewer producers adding to payrolls.

Many Americans continue to limit their spending on merchandise as they rotate to services and experiences. Others are simply tightening their belts as still-high inflation takes a toll on their incomes.

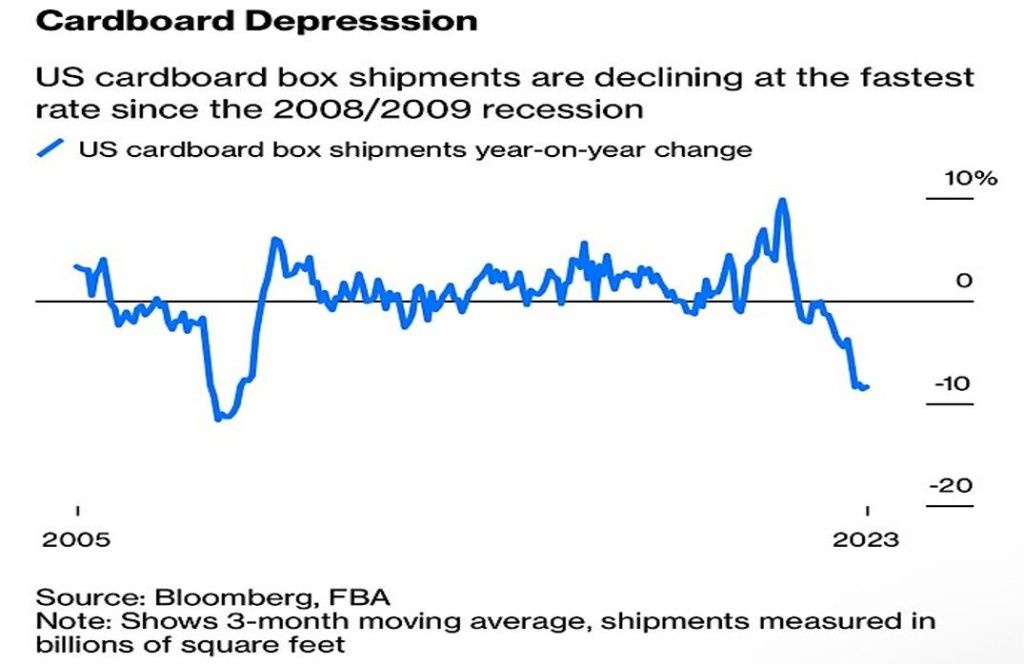
And then we have cardboard box shipments declining at fastest rate since 2008/2009.
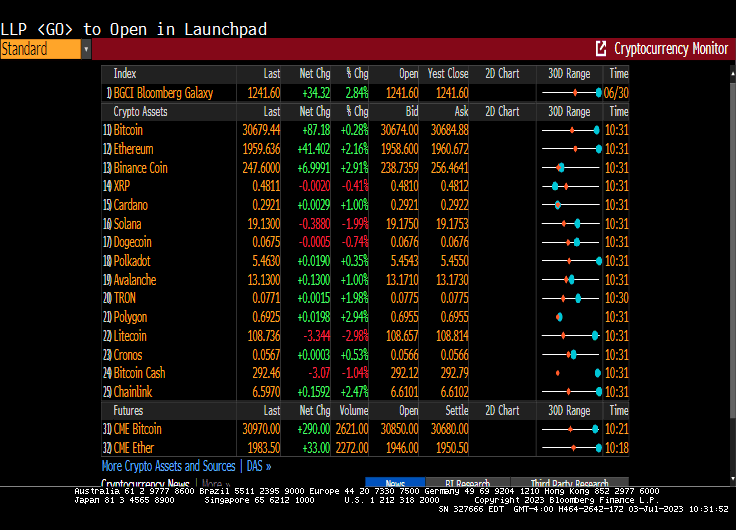
At least Ethereum is up over 2% this morning.
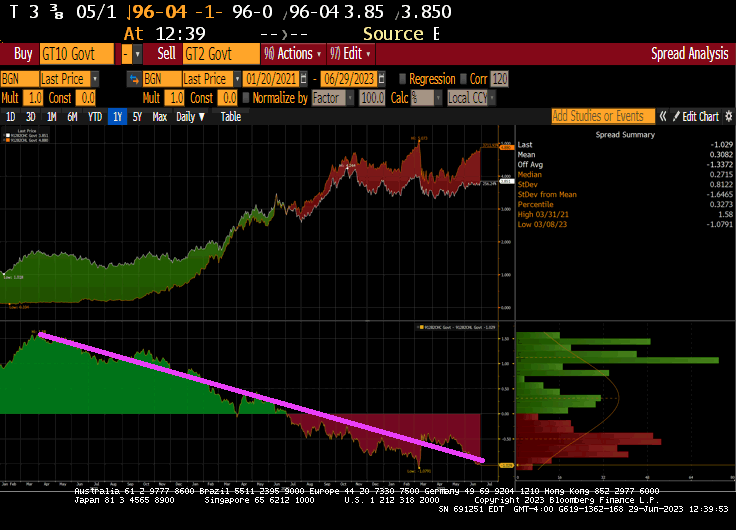
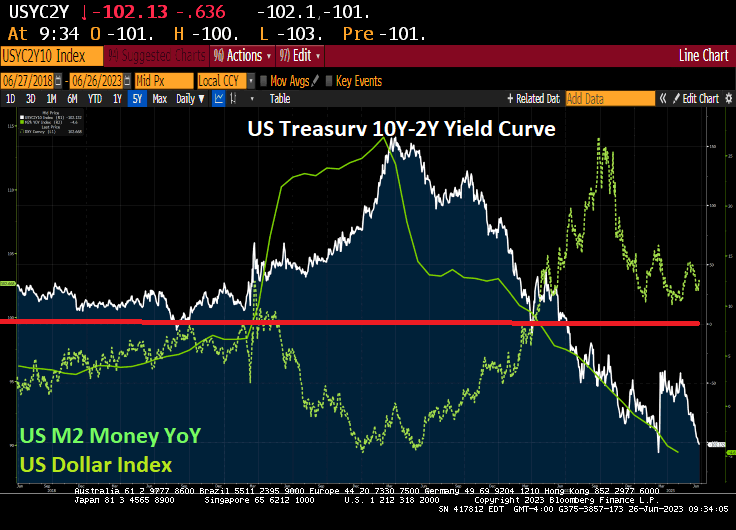
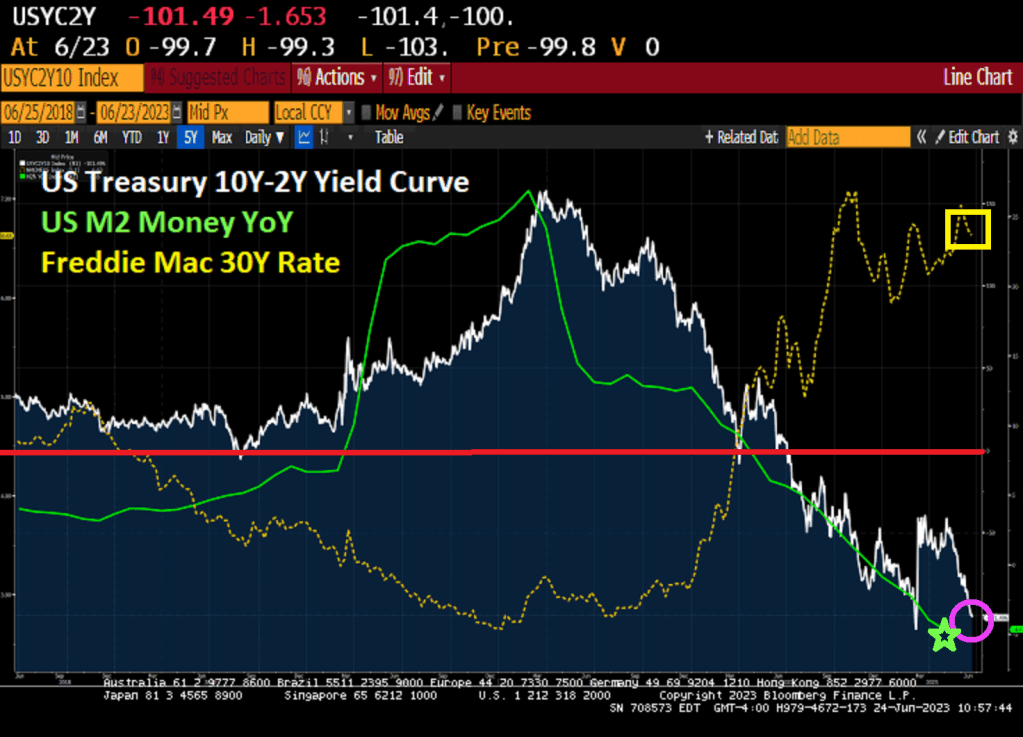
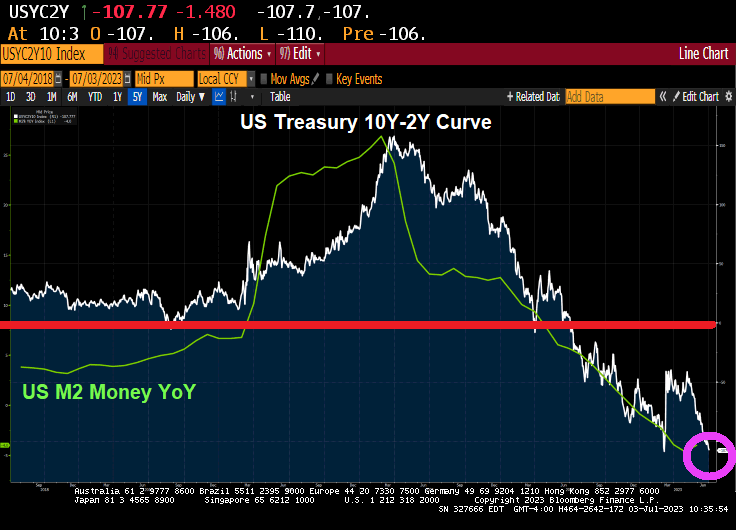
And the US Treasury 10Y-2Y keeps on diving deeper into inversion.
Joe Biden, the face of Bidenomics.
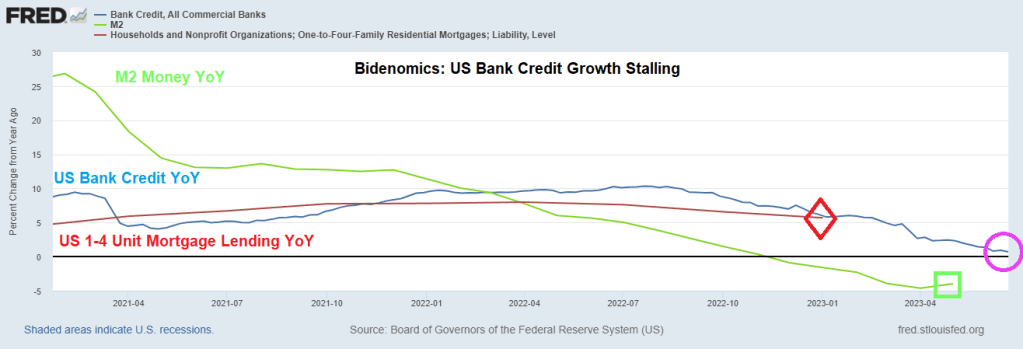
Bidenomics? US Bank Credit Growth Approaches Stall Speed (0.7% YoY) As M2 Money Growth Reverses Course, But Still Negative Growth At -4% YoY (Biden Contemplates Blocking The Sun To Prevent Global Warming!)

Bidenomics is based on massive Federal spending and massive Fed monetary stimulus. But like all stimulus, it wears off. Such is the case with bank lending as The Fed raises interest rates.

US bank credit year-over-year (YoY) has stalled to a lowly 0.7% rate as M2 Money growth YoY increases slightly to -4%.

White House report signals openness to manipulating sunlight to prevent climate change.

Its figures. With the Socialist Federal Reserve manipulating interest rates and Biden/Congress spending like drunken sailors trying to manipuate economic growth, it makes sense that Biden wants to explore Bill Gate’s idiotic idea of blotting out the sun to prevent global warming.

Of course, Biden can hide at any of his 4 mansions and wear his Ray-ban Aviators to avoid the horror of his policies.

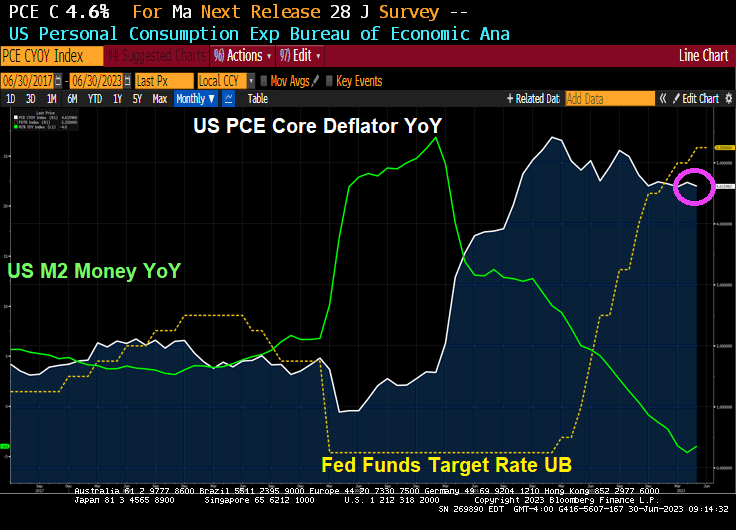
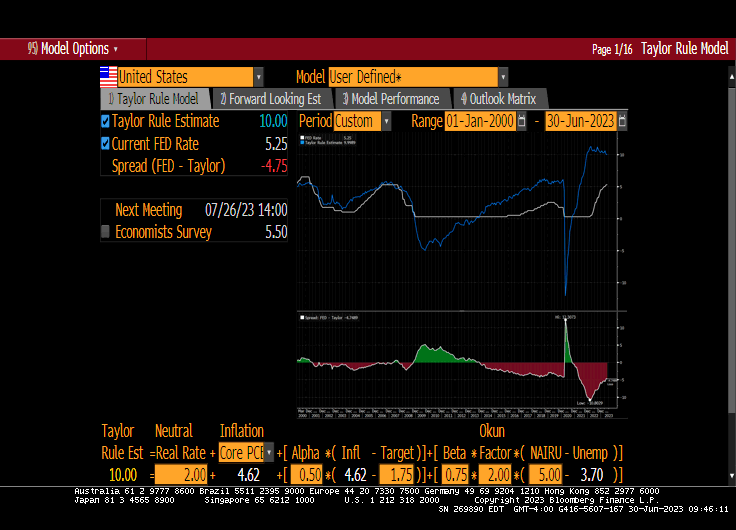
The Core! US PCE Core Deflator Remains High At 4.6%, Spending Slows (Taylor Rule Suggests Fed Funds Target Rate Of 10%, Halfway To Target!!)

The film “The Core” was a silly film, but core inflation in the US is a serious problem for the middle class and low-wage workers. It remains elevated despite Treasury Secretary Janet “The Marxist Gnome” Yellen saying it was “transitory.” Looks pretty permanent to me!

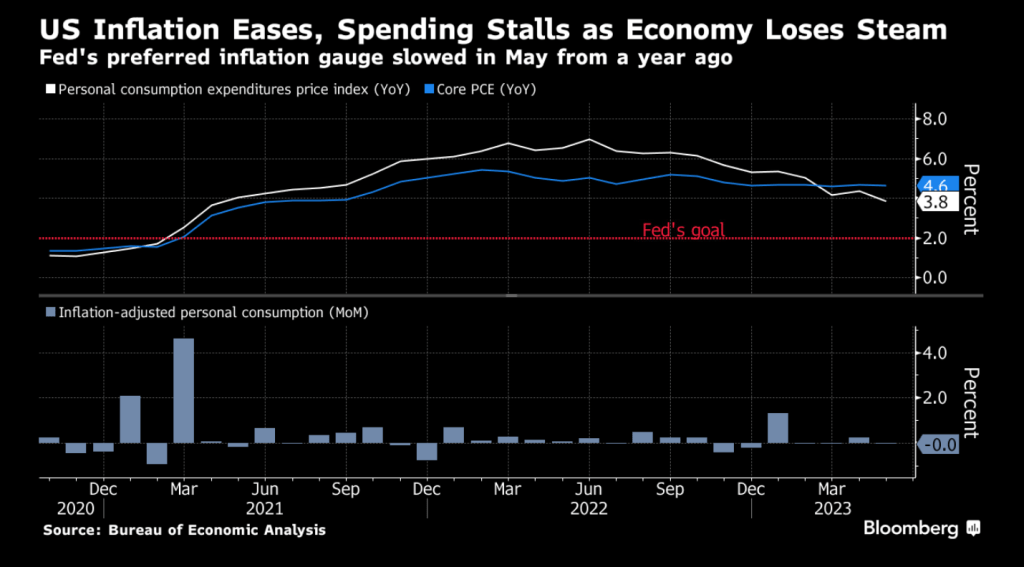
The Federal Reserve’s preferred measures of US inflation cooled (slightly) in May and consumer spending stagnated, suggesting the economy’s main engine is starting to lose some momentum. 

The personal consumption expenditures price index rose 0.1% in May, Commerce Department figures showed Friday. From a year ago, the measure eased to the slowest pace in more than two years.

Consumer spending, adjusted for prices, was little changed after a downwardly revised 0.2% gain in April. From February through May, household spending has essentially stalled after an early-year surge. Spending on merchandise dropped, while outlays for services increased.

Excluding food and energy, the so-called core PCE price index increased 4.6% from May 2022. That’s in line with annual readings back to late 2022 and shows minimal relief from elevated price pressures. Economists consider this to be a better gauge of underlying inflation.

IndicatorActualEstimate
PCE price index (MoM)+0.1%+0.1%
Core PCE price index (MoM)+0.3%+0.3%
PCE price index (YoY)+3.8%+3.8%
Core PCE price index (YoY)+4.6%+4.7%
Real consumer spending (MoM)0.0%+0.1%

Under the hood of the government report, a key metric flagged by Fed Chair Jerome Powell showed a welcome slowdown. Services inflation excluding housing and energy services increased 0.2% in May from a month earlier, the smallest advance since July of last year, according to Bloomberg calculations. The figure was up 4.5% from a year ago. 

The Taylor Rule now suggests a target rate of 10%. We are just halfway to target!

Meanwhile, Yellen Plans July China Trip, While US Preps Investment Curbs. Trying to convince China that the US won’t default on its $32 TRILLION and growing debt?

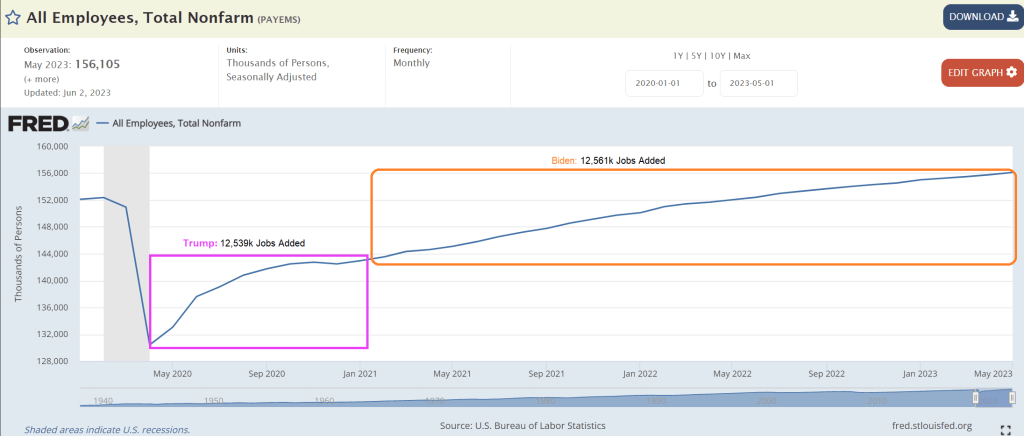
Bidenomics?? US Gross Domestic Income Drops -1.8% QoQ For Q1 2023, REAL GDI At -0.8% QoQ (US Added 12.53M Jobs After April 2020 (Trump) While Bidenomics Took 2 1/2 years To Add 12.56M Jobs)

Bidenomics is a great marketing ploy where you have out of control Federal spending and magically decide to reopen the economy and school after Covid and focus only on jobs added after Biden was selected President and ignore the jobs added during Trump.

Real gross domestic income (GDI) is a measure of the incomes earned and the costs incurred in the production of gross domestic product. It’s another way of measuring U.S. economic activity. BEA also publishes the average of real GDP and real GDI.  

REAL GDI dropped to -0.8% QoQ for Q1 2023. Kind of looks like Bidenomics is running out of gas.

On Biden’s claims that he created twice as many jobs as any other President, the US economy add 12.53 million jobs after April 2020 (Trump) while Bidenomics created took 2 1/2 years to add 12.56 million jobs.

The US Treasury yield curve (10Y-2Y) is now inverted at -103 basis points.

As Fed stimulus wears out, so is the Treasury 10Y-2Y yield curve.

The official themesong of Bidenomics!!!

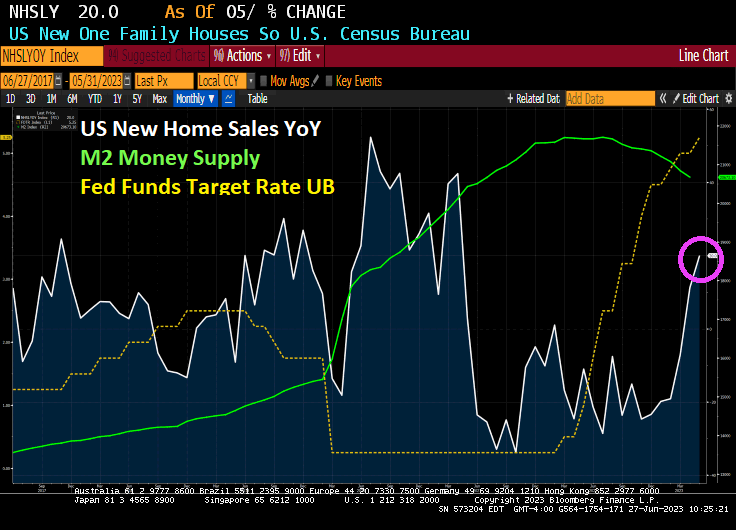
US New Home Sales Spike 20% Year-over-Year (YoY) In May As Fed Pauses Rate Hikes (The Buck Drops Here!)

Well its about time that homebuilder started building again! And maybe it was The Fed rate hike pause (and possible rate cuts in the future.

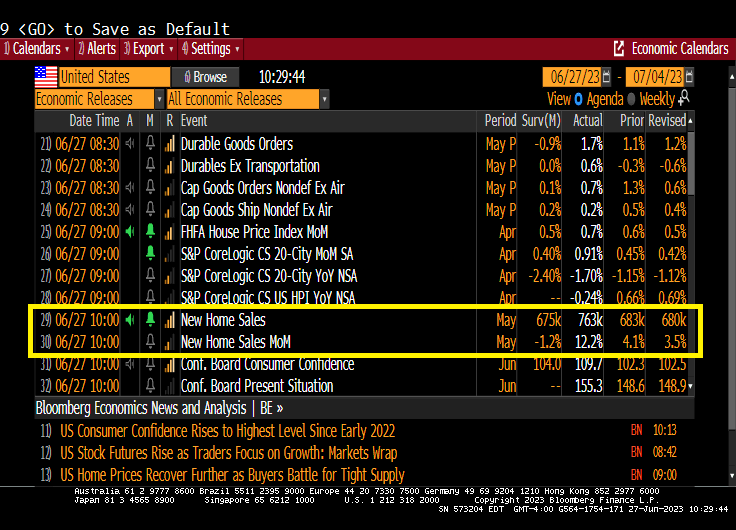
US new home sales rose 20% in May as The Fed pauses rate hikes.

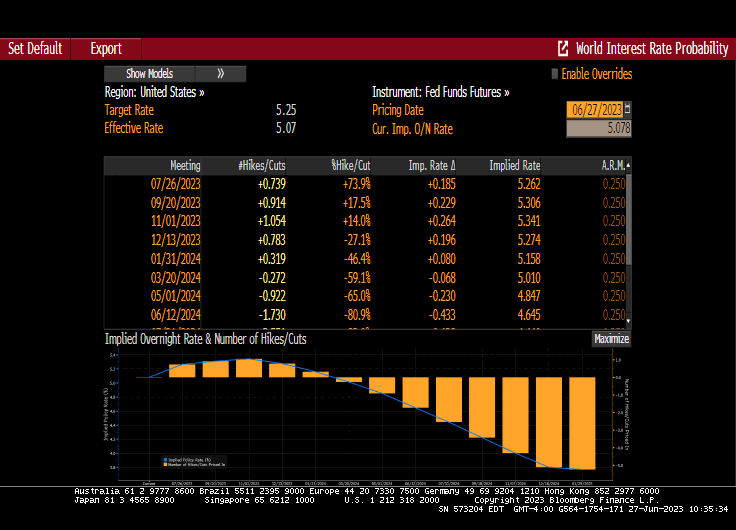
Fed Funds Futures point to one or two more rate hikes, then down she goes!!!

763k new homes were added in May

Remember, there is still a lot of stimulus (M2) sloshing around the economy. Perhaps we can rename all the infrastructure stimulus that is leaking out into the economy “Buttigieg Bucks.” Or “Buty Bucks!”

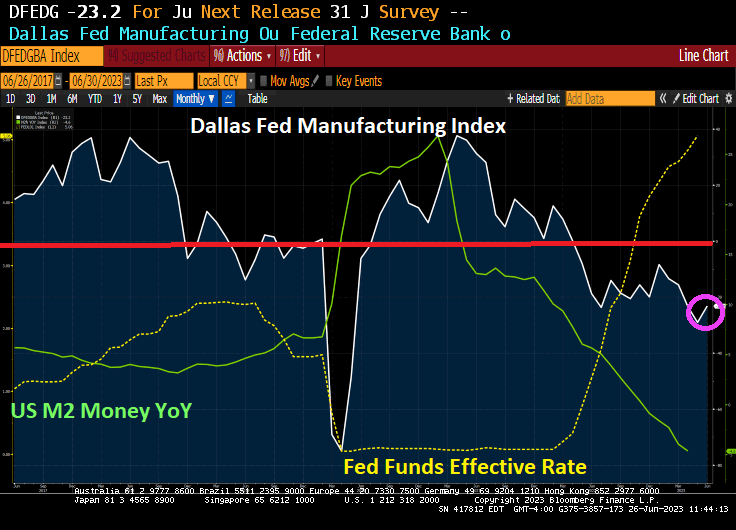
Dallas After (Economic) Midnight! Texas Manufacturing Survey Disappoints For 5th Straight Month Amid “Political Incompetence”(And Massive Corruption)

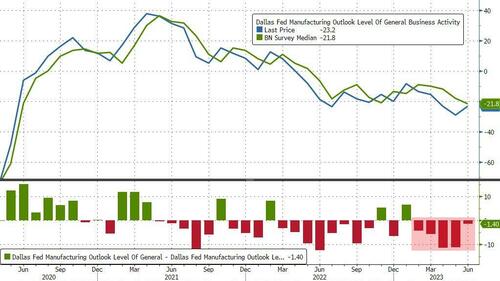
Dallas after (economic) midnight! Particularly after 5 consecutive months of negative readings.

For the fifth straight month, the Dallas Fed’s Texas Manufacturing Outlook survey disappointed expectations, printing -23.2 vs -21.8 exp) and is negative for a fifth straight month.

Source: Bloomberg

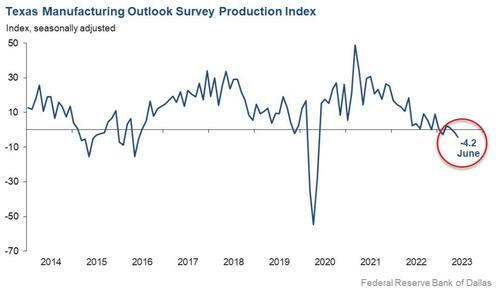
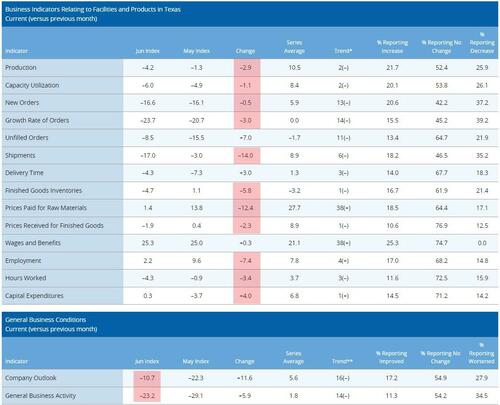
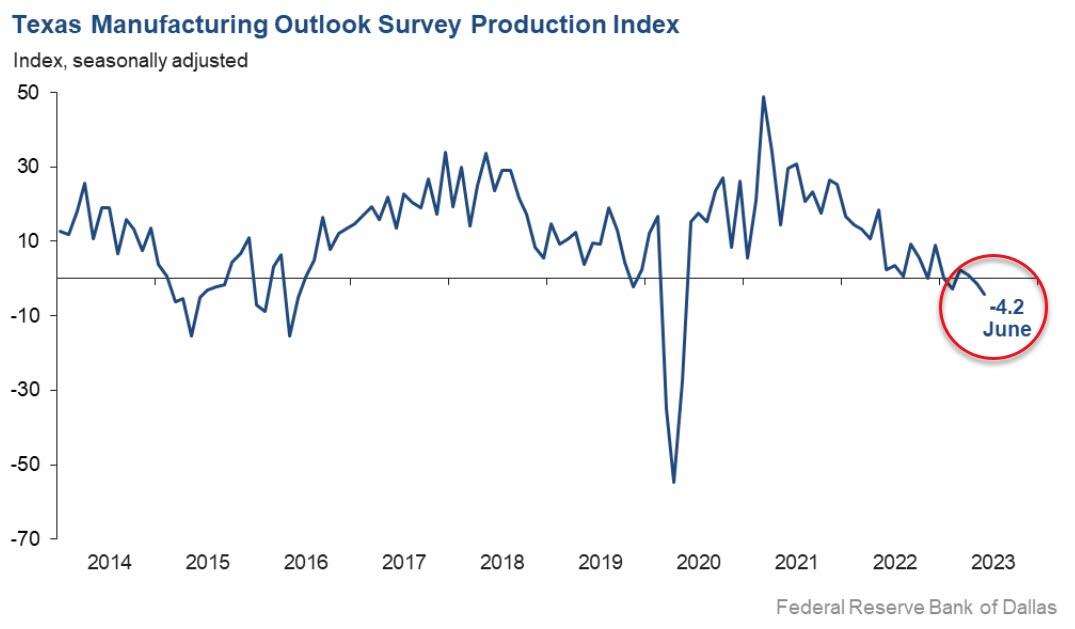
Texas factory activity declined in June, according to business executives responding to the Texas Manufacturing Outlook Survey. The production index, a key measure of state manufacturing conditions, fell three points to -4.2, a reading indicative of a slight contraction in output.

Labor market measures suggest weaker employment growth and declining work hours. Price pressures evaporated, while wage pressures remained elevated…

Yes, the Biden Administration may be the most incompetent administration in US history with Congress a close second. And did I mention CORRUPT??

Silverado! US Treasury 10Y-2Y Yield Curve Remains Inverted At -102.7 (244th Straight Days Of Inversion) As Liquidity Evaporates (Silver UP >1%) Bitcoin CASH UP 12% This AM

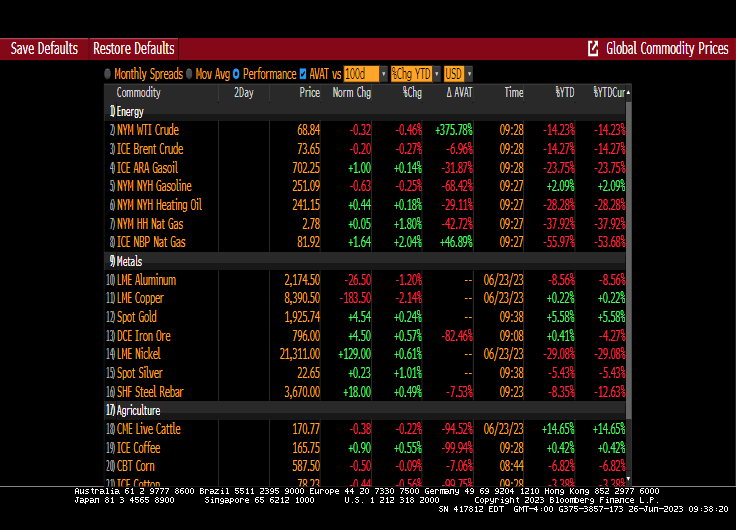
Silverado! No, not the Chevy full-size pickup truck, but the precious metal Silver is up over 1% this morning!

The US Treasury 10Y-2Y yield curve remains inverted at -102.7 basis points for the 244th straight day as M2 Money YoY (aka, liquidity) evaporates.

Silver is up over 1% this morning.

Bitcoin Cash is up12.39% this morning.

Speaking of Silverado, a fully loaded new 2023 Chevy Silverado 1500  ZR2 costs around $100,000. Thanks Biden and Powell (BiPow?). Try financing that purchase with auto loan rates soaring!

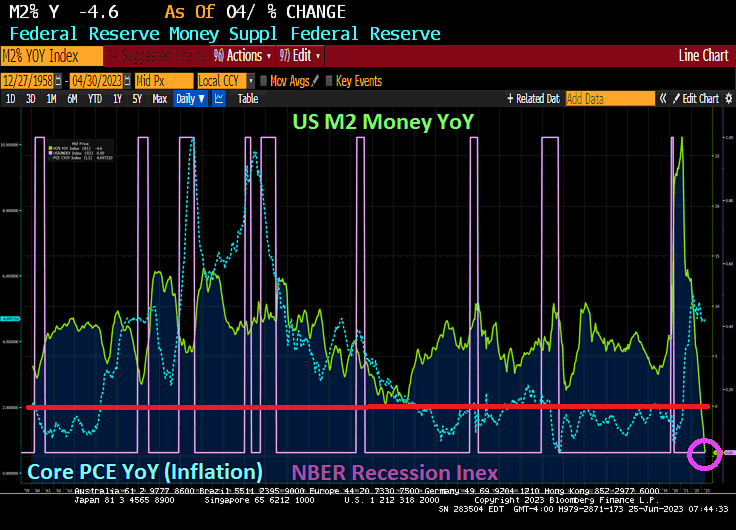
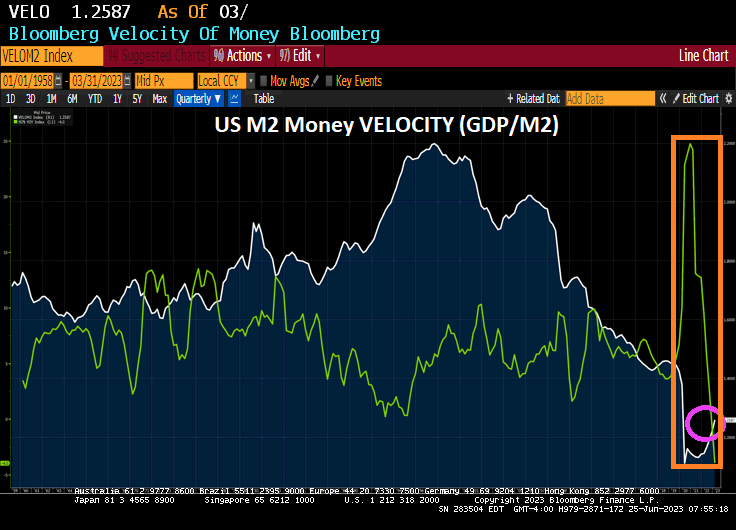
Fed Inferno! US M2 Money-Supply Growth Falls To Depression-Era Levels For Second Month In April (As M2 Money Velocity Remains Near Historic Lows)

It is truly a Fed Inferno!

Money supply growth fell again in April from Jerome Powell And The Fed, plummeting further into negative territory after turning negative in November 2022 for the first time in twenty-eight years.  April’s drop continues a steep downward trend from the unprecedented highs experienced during much of the past two years.

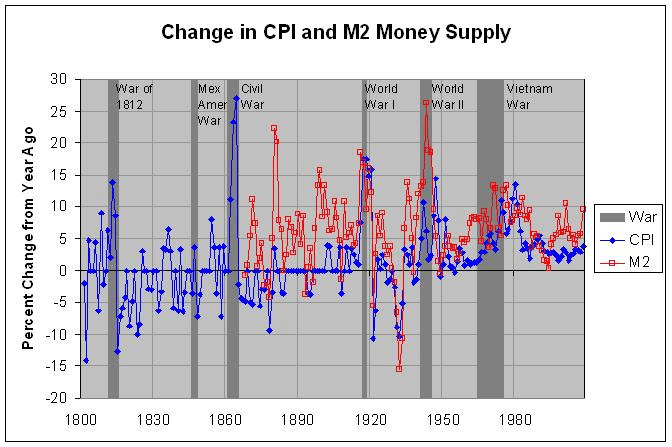
Yes, The Fed is printing money like it is going out of style! The war on Covid was similar to other wars fought where the US printed boatloads of money to pay for WWI. WWII, Korea and Vietnam wars. And the war against the middle class (known as The Best Depression). Apparently, The Fed is still waging war against the middle class.

US M2 Money VELOCITY (GDP/M2) is near an all-time low after The Fed went berserk with money printing to combat the Covid economic and school shutdowns.

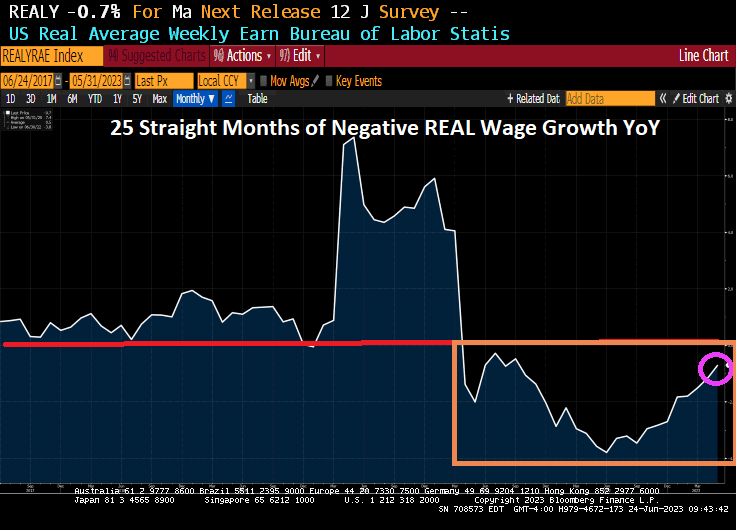
Then with The Fed’s massive monetary expansion and sudden contraction, we have REAL average weekly earnings growth YoY in negative territory for 25 straight months.

The Walking Dead’s Negan, the poster child for The Federal Reserve.

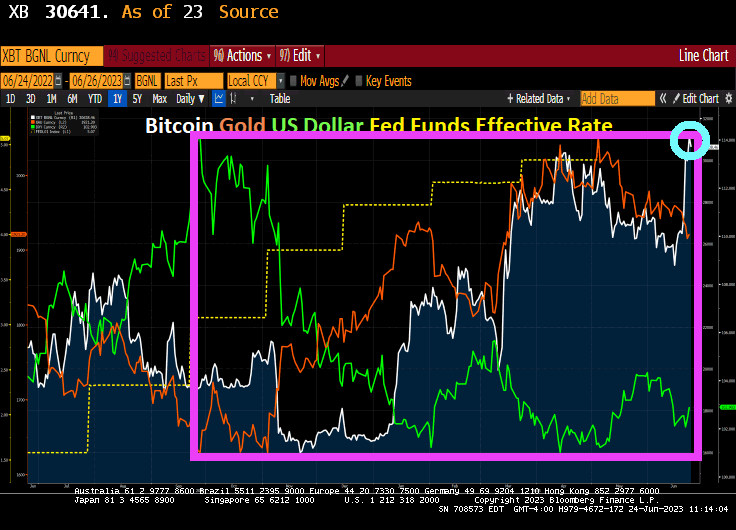
Weekend Update! Bitcoin UP 61%, Gold UP 18%, US Dollar DOWN -10% Since 9/26/22 (Mortgage Rates Hover Around 7% As 10Y-2Y Yield Curve Inverts To -100 Basis Points)

Well, with Jerome Powell And The Fed tightening monetary policy (about half way there!), we have seen competitors to the US Dollar Bitcoin and Gold have soared since September 26, 2022. Bitcoin is up 61%, Gold is up 18% and the US Dollar is down -10%.

Mortgage rates hover around 7% as the US Treasury 10-2Y curve inverts to over -100 basis points with M2 Money growth crashed and burned.

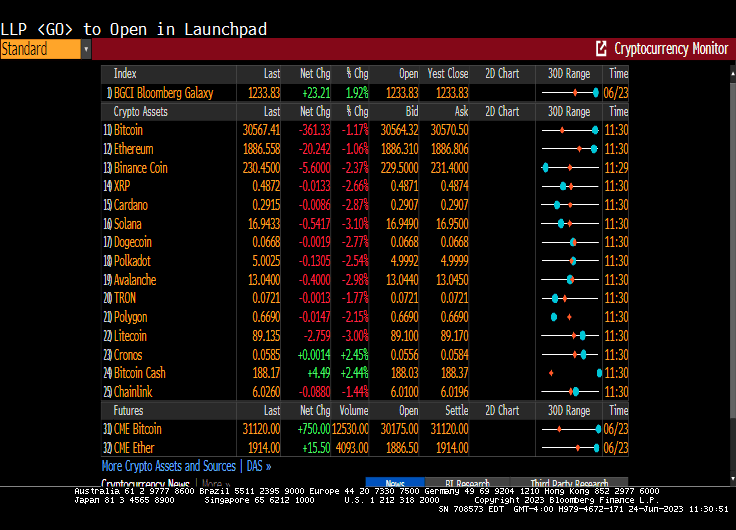
Cryptos today are down. Bitcoin down -1.17%.

Buying more gold and silver!! And cryptos!

...I love gold.

50 Shades Of Joe! Misery Indices All Point To Americans Being Almost Twice As Miserable Under Biden Than Pre-Covid Trump (25 Straight Months Of Negative Weekly Wage Growth)

I could have used 3 shades of Joe, but 50 shades of Joe sounds better!

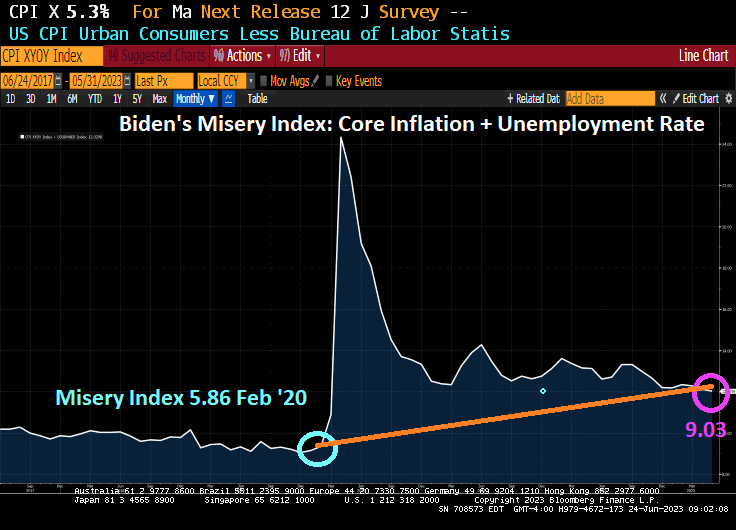
But the fact remains that Americans are far more miserable under Biden than they were under Trump before the Chinese Wuhan Covid virus was unleashed. 9.03 today (Core CPI YoY + U-3 Unemployment) than it was in February 2020 under Trump (5.86). While not twice as bad, inflation is continues to cause serious problems for America’s middle class and low-wage workers.

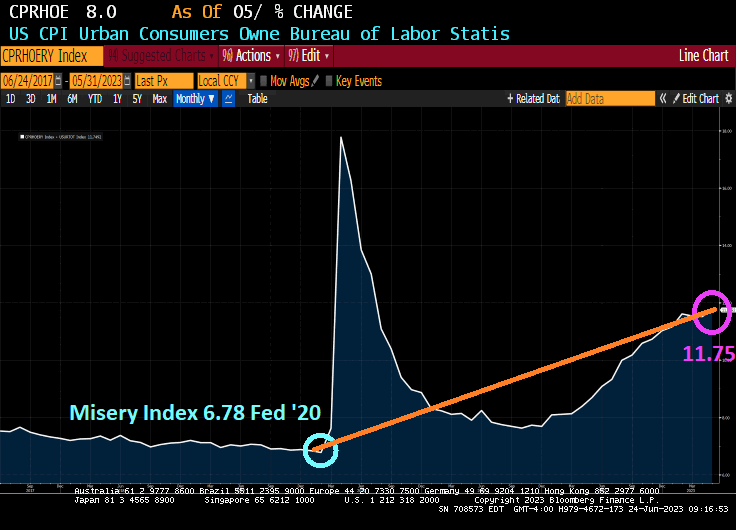
Speaking of the middle class and low wage workers, let’s look at the Renter’s Misery index (CPI Owner’s equivalent rent YoY + Unemployment rate). It was 6.78% in February 2020 under Trump and before Covid struck and is now 11.75% under Inflation Joe.

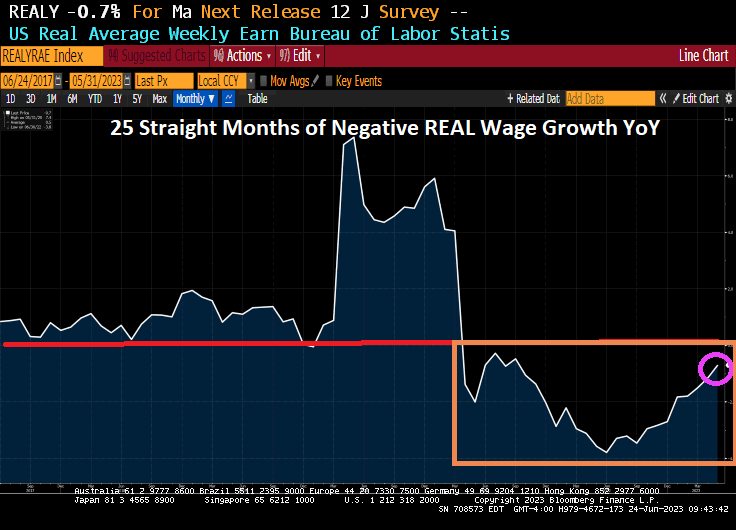
Speaking of misery, how 25 straight months of negative REAL wage growth? Real weekly wage growth went negative in April 2021, just a few months after Biden was installed as President.

Now, there was winners under Biden. Green energy donors, the big banks, big pharma, big tech, but media … essentially any big donors from big entities got massive payoffs. The middle class and low-wage workers? As Jerry Reid once sang, “They got the coal mine and we got the shaft.”