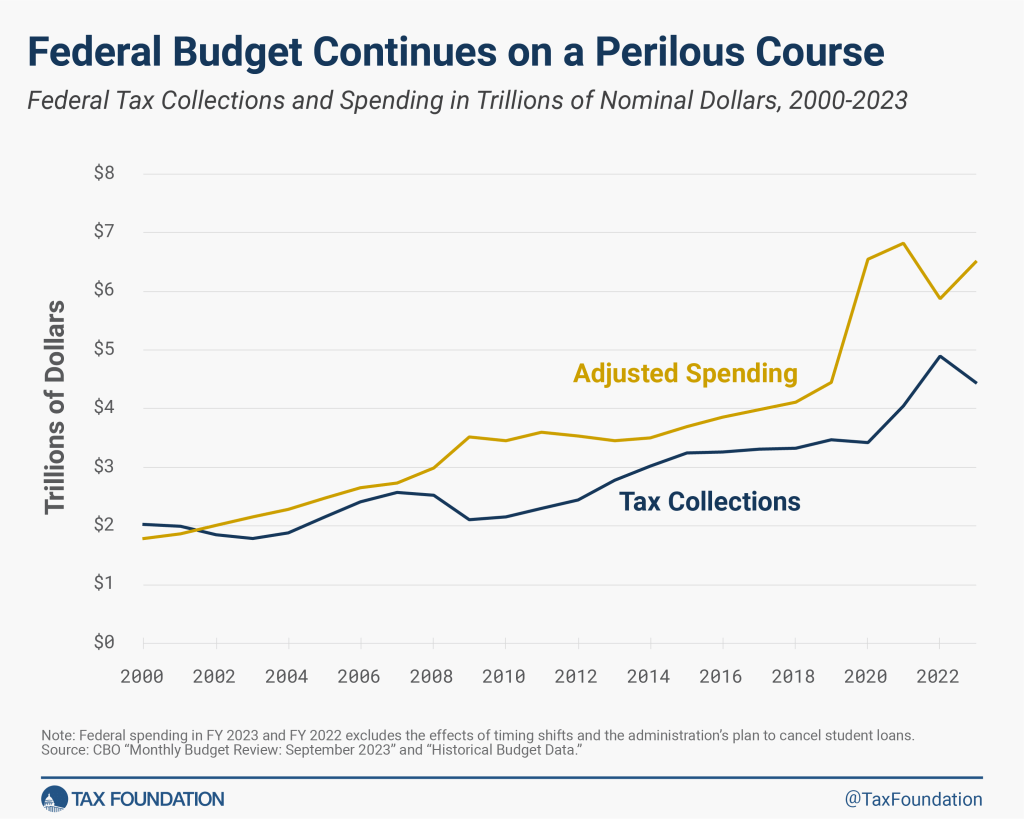
In fact, Congress and the Biden (mis) Administration are spending like the proverbial drunk sailors in port. US national debt is up to $33.7 TRILLION. That transates to $259,103 per taxpayer. With US debt to GDP of 138%!
Now, HERE IS THE REAL BAD NEWS! Unfunded promises that politicians made to Americans (Social Security, Medicare, Medicaid, etc.) now stands at $211.6 TRILLION. That equates to $629,000 per citizen. Maybe that should be the deal at the southern border: all immigrants must pay $629,000 for admission!
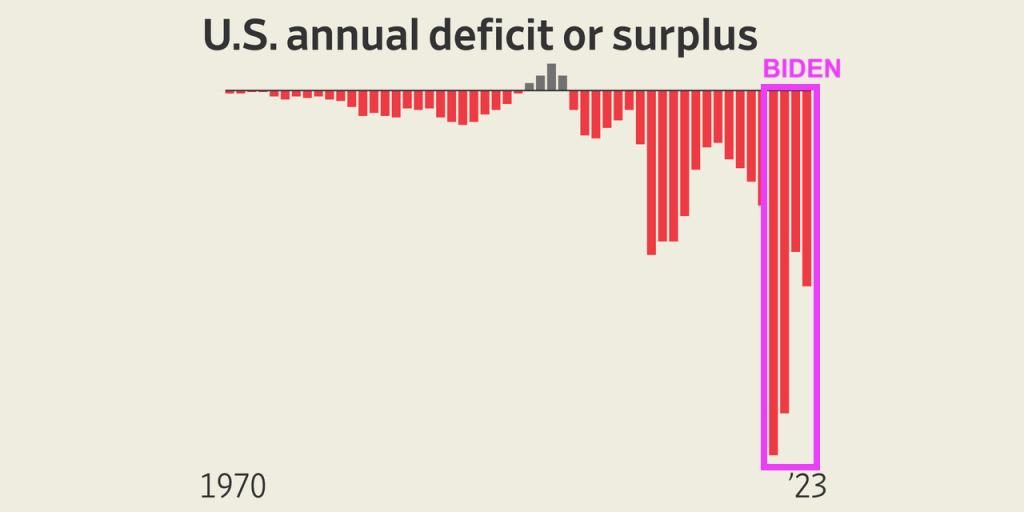
And the Federal budget deficit keeps on getting worse.
The budget deficits under Biden/Yellen have been the worst in history. So much for Biden whispering “Bidenomics is working!”
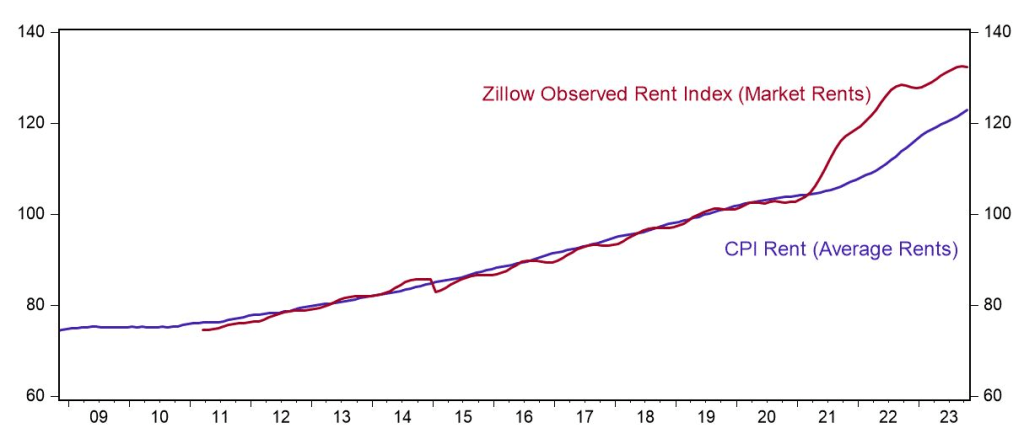
Rents in the US remain unaffordable to many.
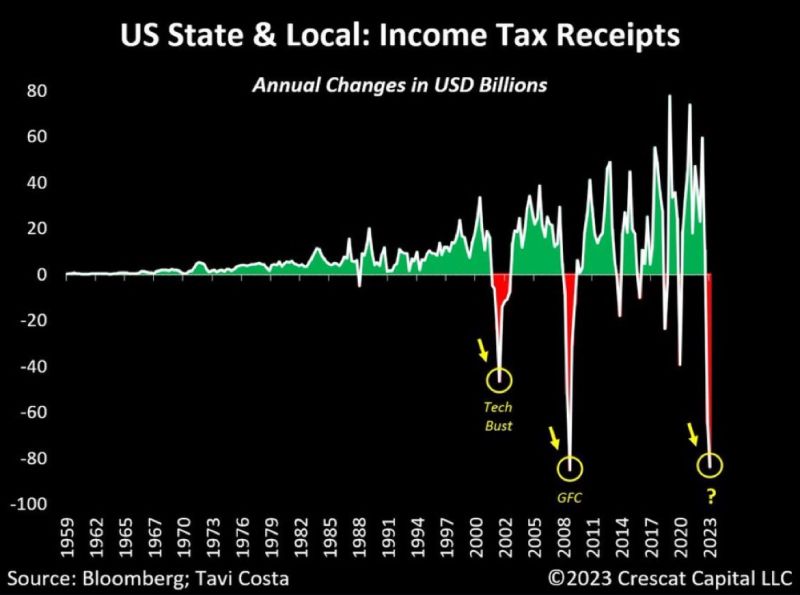
And Yellen, our nation’s financial consigliari, hasn’t said much about the dire decline in income tax receipts.
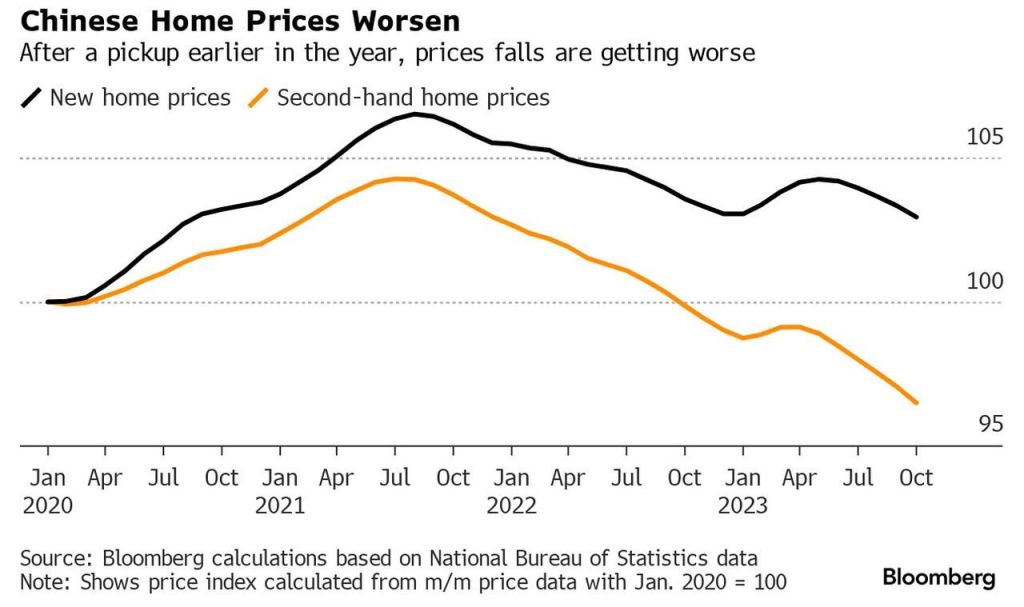
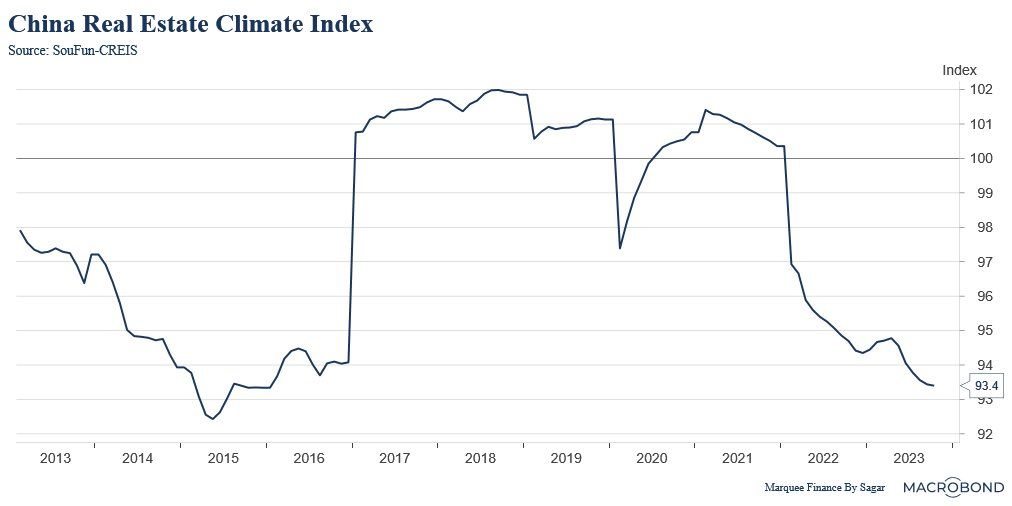
But Biden’s favorite country China, a classic top-down command economy like Biden and Yellen love,
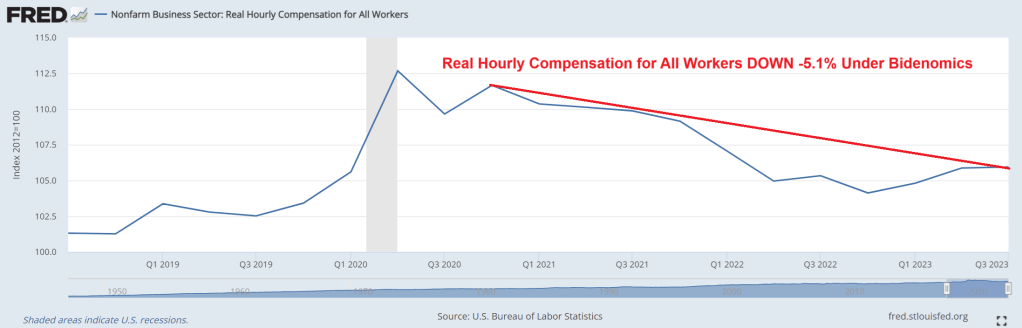
On Sunday, President Joe Biden tweeted, “Right now, real wages for the average American worker is higher than it was before the pandemic, with lower wage workers seeing the largest gains. That’s Bidenomics.” That’s right, Joe! Except real hourly compensation has DECLINED by -5.1% under Biden.
After listening in horror to Joe Biden’s press conference after his summit with China’s Xi, I had to ask the following question: what does Joe Biden has in common with Georgia Tech? Answer? They are both rambling wrecks. Biden made a horrendous foreign policy blunder by calling Xi a “dictator” and almost blew it by nearly spillling the beans on our foreign policy negotiations with Israel. SecState Blinken had to intervene. We are represented by Winken (Harris), Blinken and Nod (Biden, who usually looks asleep or confused).
But back to the horrors of a slowing economy.
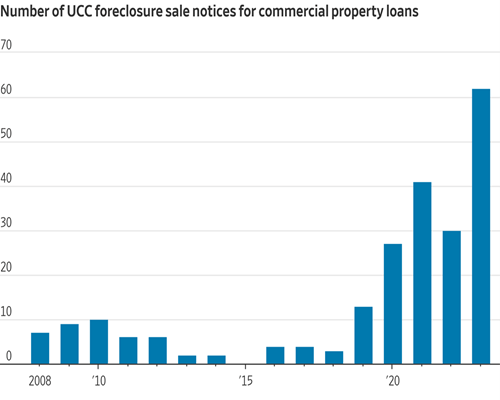
As the US economy slows down (like Biden himself), we are seeing further cracks in the real estate market. Foreclosure sale notices for commercial property loans are exploding.
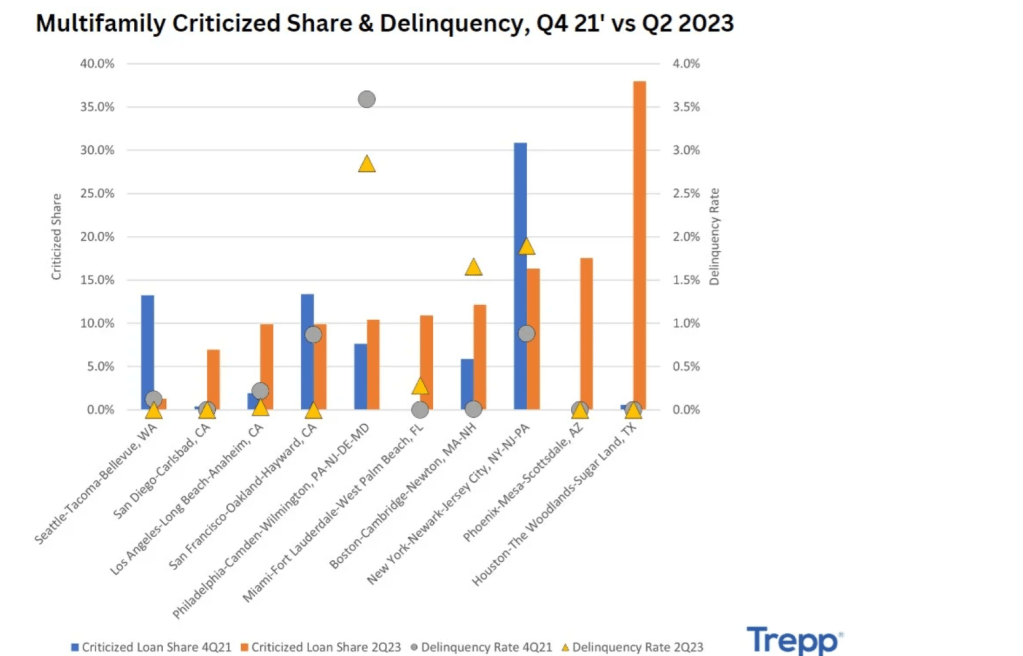
And depending on the MSA, multifamily delinquencies are booming, like in Houston, Texas, New York City and Phoenix AZ.
Then we have this headline: “Not Just Office Towers – Commercial Real Estate Sales Crater Throughout Los Angeles.” It’s difficult to find big commercial real estate deals of any kind in Los Angeles. A new report from NAI Capital reveals how severe and universal the decline in activity is throughout the region this year amid collapsing values, higher interest rates, and a new tax on property sales above $5 million.
Yes, I know, California’s real estate woes are mostly the fault of their politicians like Governor Gavin (Gruesome) Newsom. The same guy who ordered San Francisco’s homeless population to be moved creating a new Potemkin Village. But rising interest rates are the fault of excessive spending by Congress and the Biden Administration.
Biden says he wants 4 more years to finish the job. Like killing off the mortgage market completely, Joe?
Mortgage applications increased 2.8 percent from one week earlier, according to data from the Mortgage Bankers Association’s (MBA) Weekly Mortgage Applications Survey for the week ending November 10, 2023.
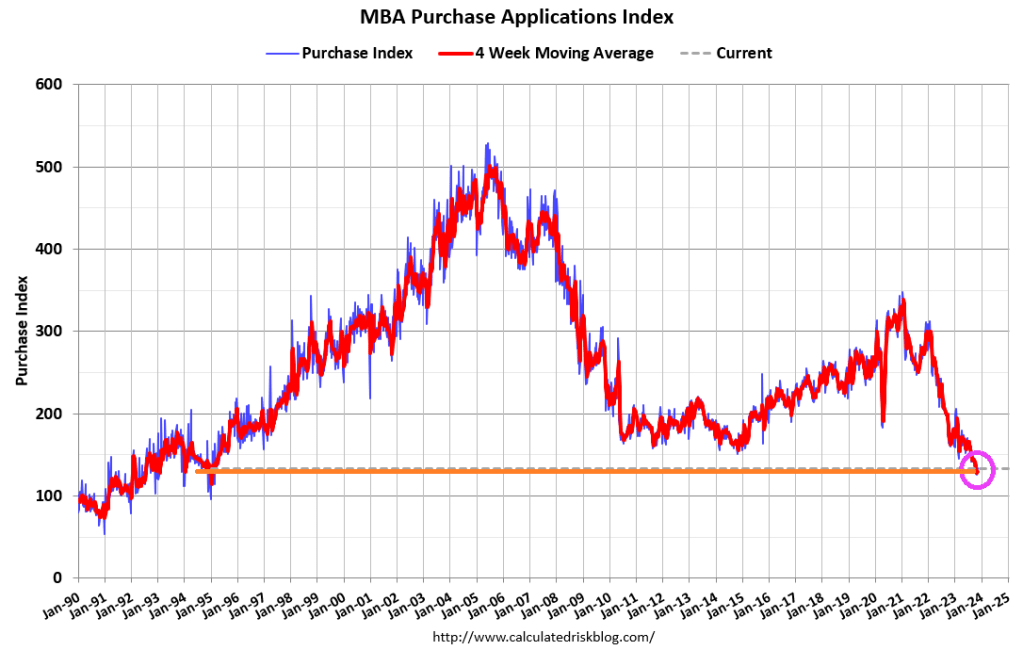
The Market Composite Index, a measure of mortgage loan application volume, increased 2.8 percent on a seasonally adjusted basis from one week earlier. On an unadjusted basis, the Index increased 0.4 percent compared with the previous week. The seasonally adjusted Purchase Index increased 3 percent from one week earlier. The unadjusted Purchase Index decreased 0.3 percent compared with the previous week and was12 percent lower than the same week one year ago.
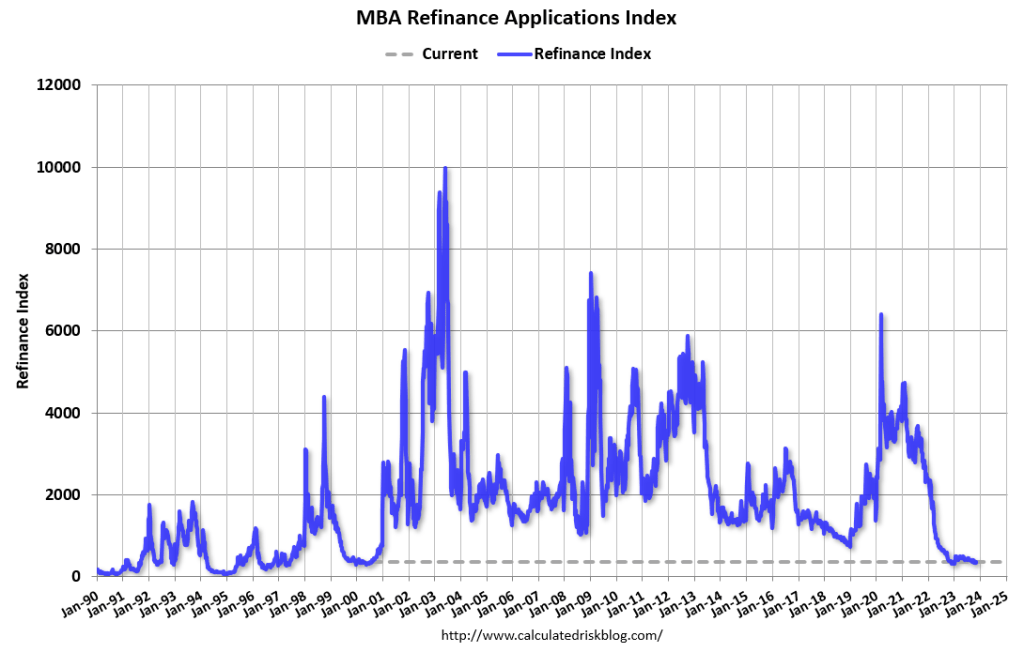
The Refinance Index increased 2 percent from the previous week and was 7 percent higher than the same week one year ago.
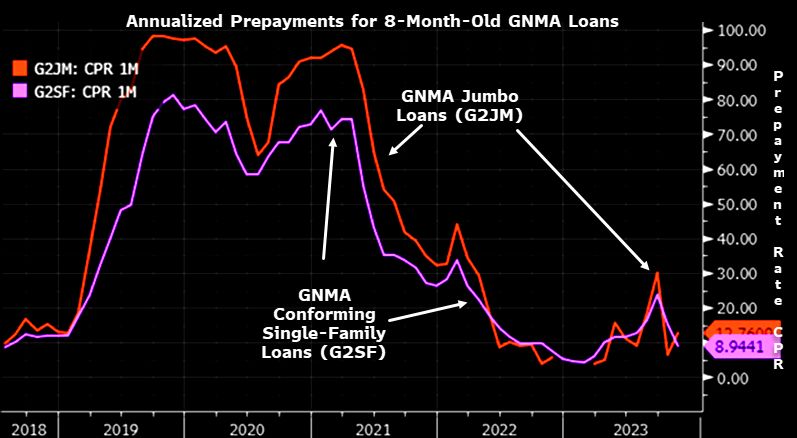
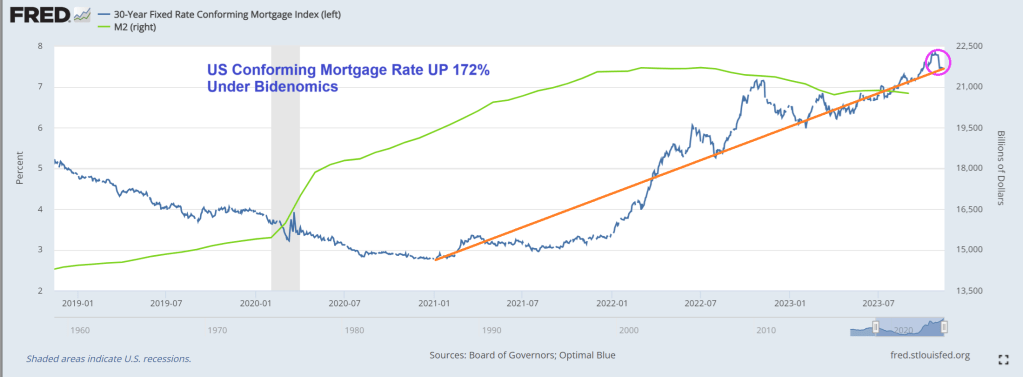
Of course, mortgage rates have been declining slightly over the past few weeks, but remain up 172% under Biden.
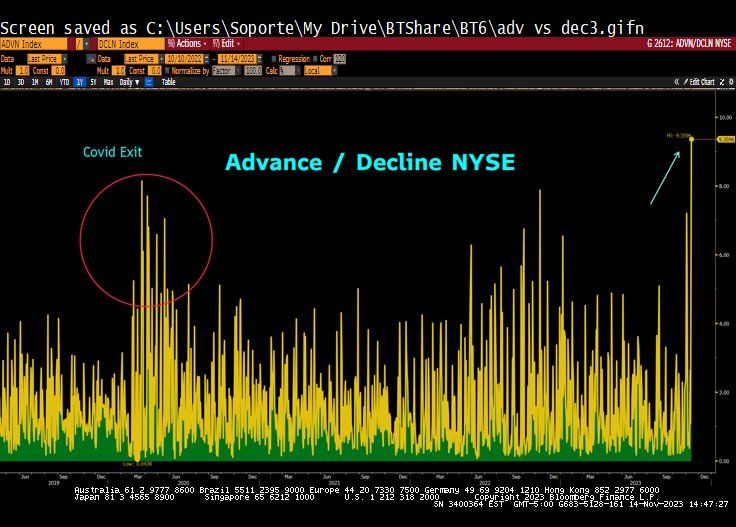
At least the stock market is booming after the inflation report signalled that The Fed is likely done with rate hikes.
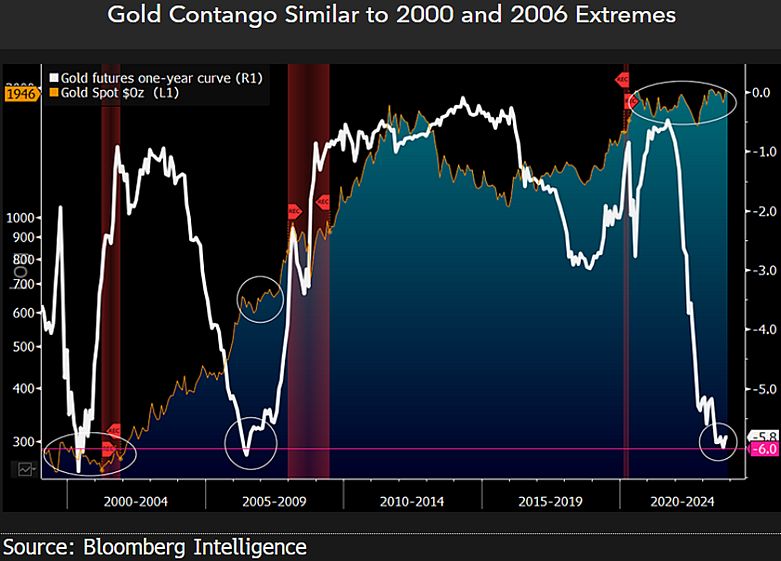
On the gold front, we are seeing evidence of contango.
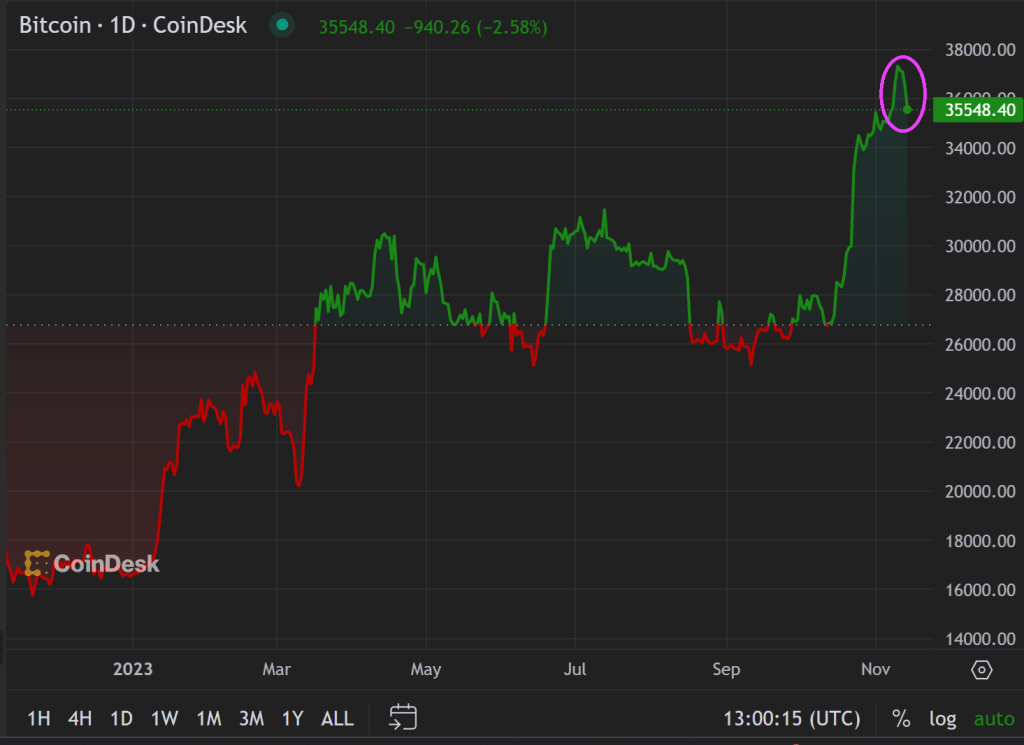
Bitcoin? Down a wee bit after a staggering rise in price over the past year.
Here is China’s Xi meeting with Biden’s likely replacement, “Greasy Gavin” Newsom and Newsom’s likely Treasury Secretary, Janet “Too Low For Too Long” Yellen. Newsom, Yellen and Xi all want havoc in America.
On a amusing or sad note, Biden campaign communications director Michael Tyler’s message to Americans who are worse off economically under Biden: “That’s precisely why we need another four years to finish the job.” OMG! What does “finish the job” mean?? I am afraid to ask.
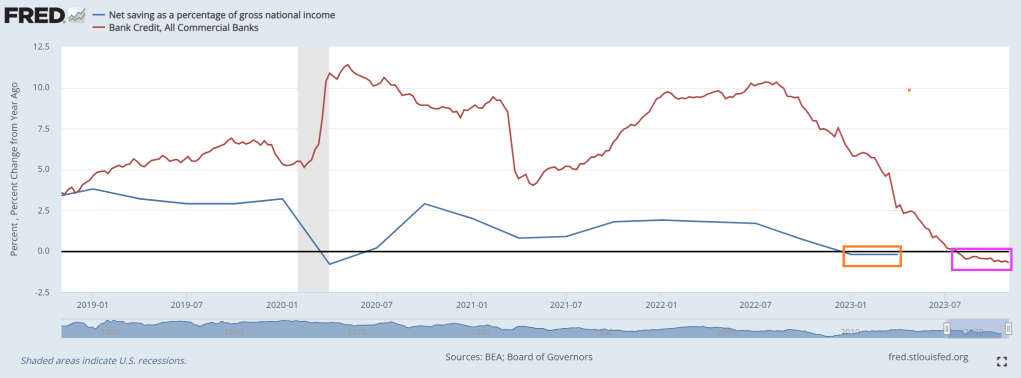
Where we currently sit is … bank credit growth is in the red (15th straight week of negative growth) and net savings as a percentage of gross national income has seen negative growth YoY for 2 consequtive quarters.
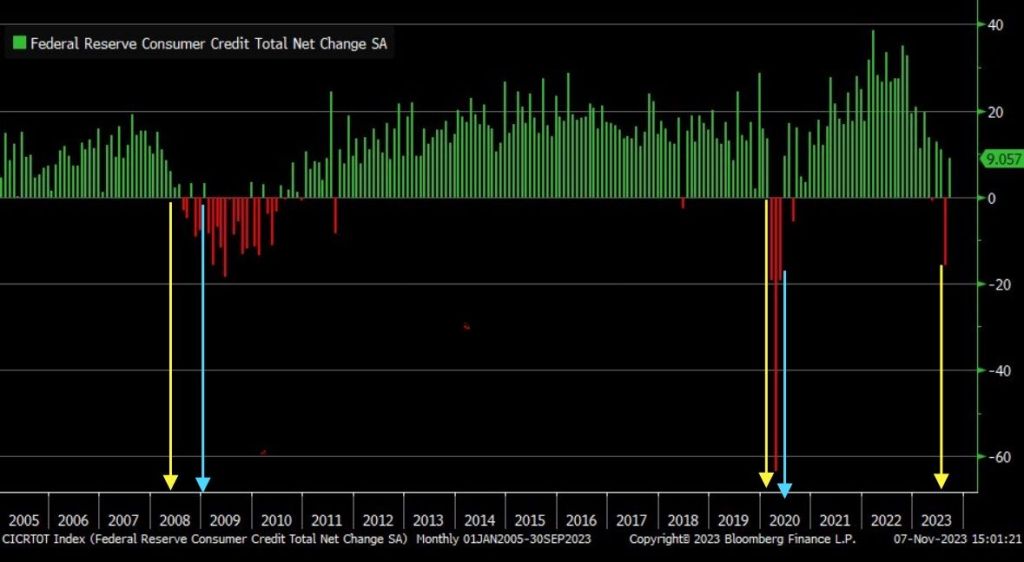
September marked the largest consumer credit drop since May 2020, signaling a significant recession warning.
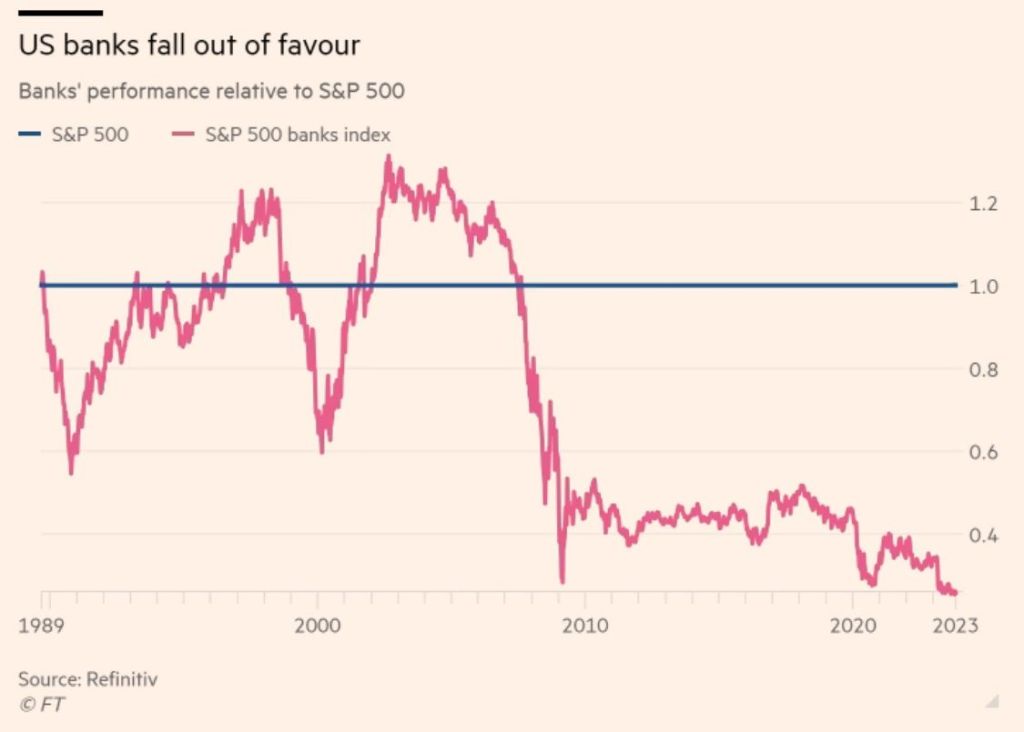
And with Bidenflation (or Yellenflation) and The Fed’s counterattack, we are seeing bank stocks losing relative to the tech sector.
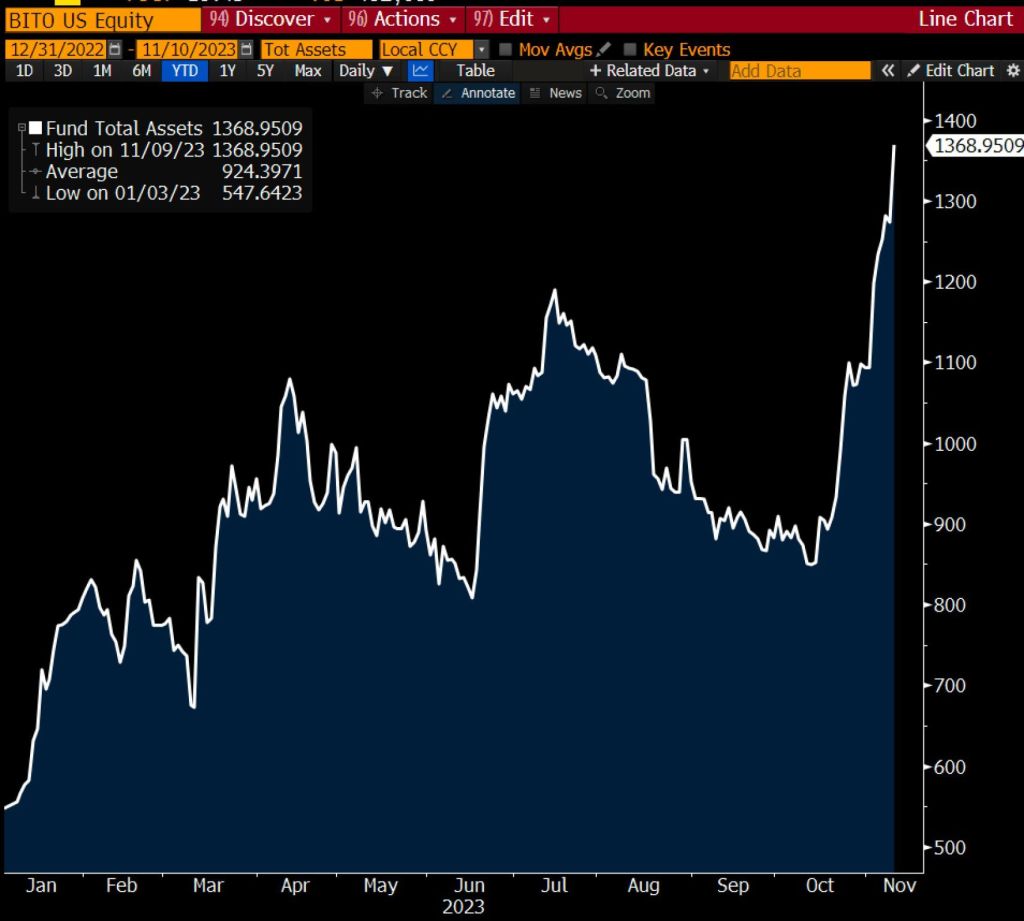
Proshares Bitcoin (BITO)’s assets have nearly doubled in the past 30 days.
Yes, the Three Stooges (Biden, Yellen, Powell) have put the US on a highway to hell!
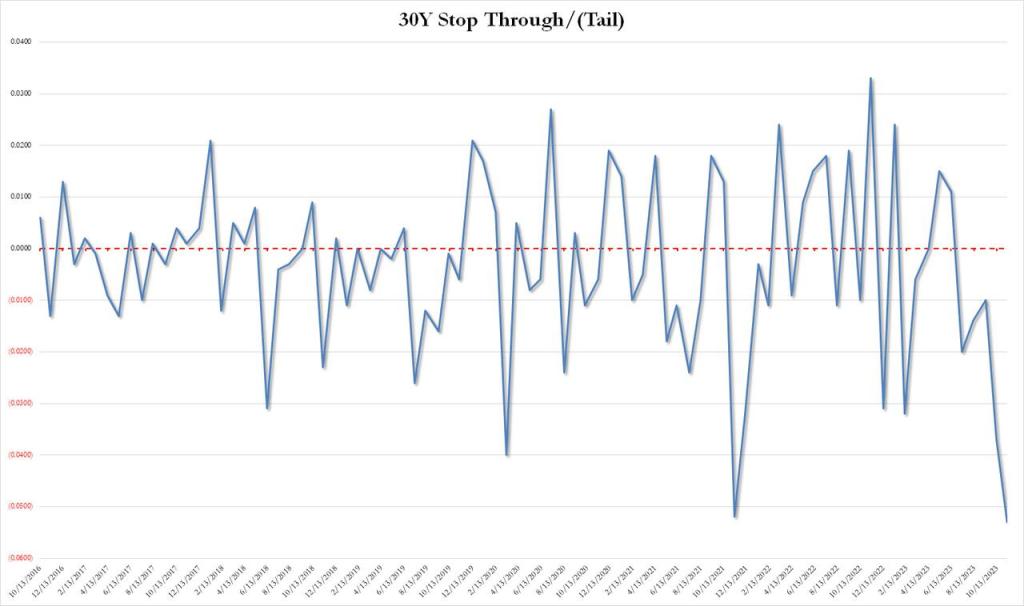
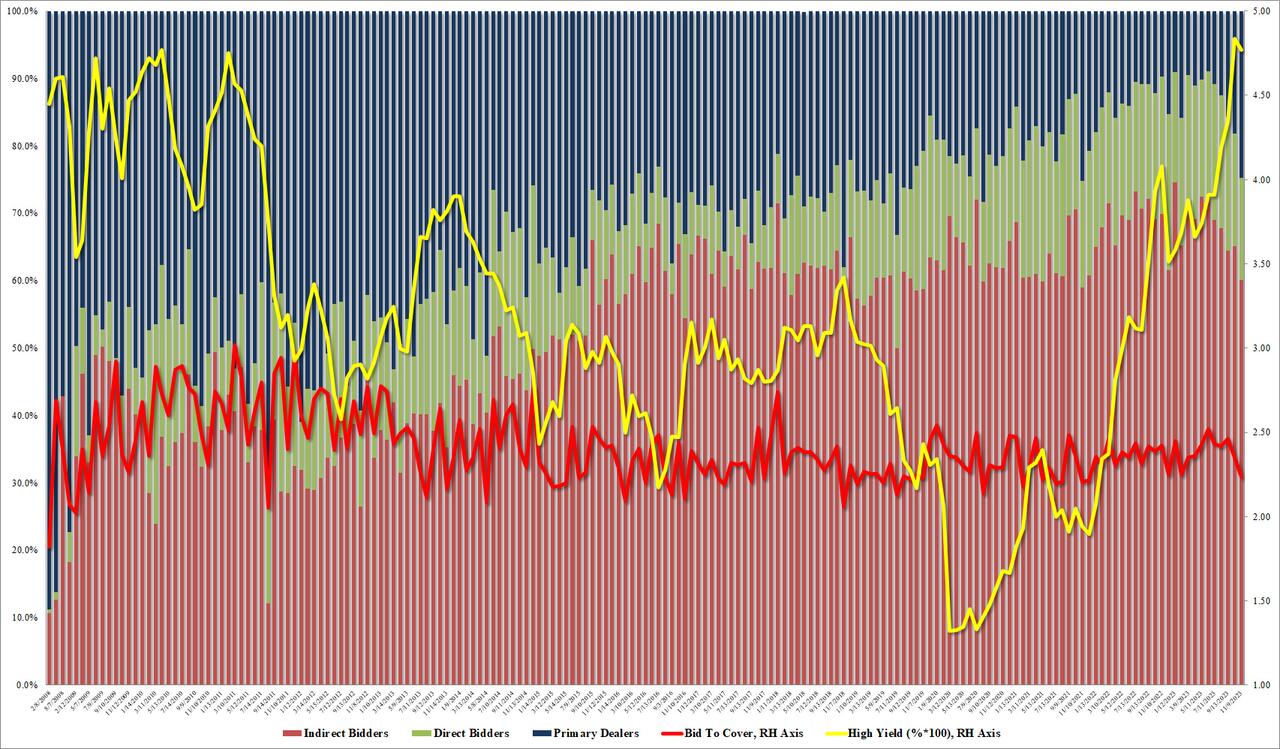
The bond priced at a high yield of 4.769%, which was below last month’s 4.837%, and just shy of the April 2010 high. But more importantly, it tailed the When Issued by a whopping 5.3bps, which was… well… terrible, because as shown in the chart below, this was the biggest tail on record (going back to 2016).
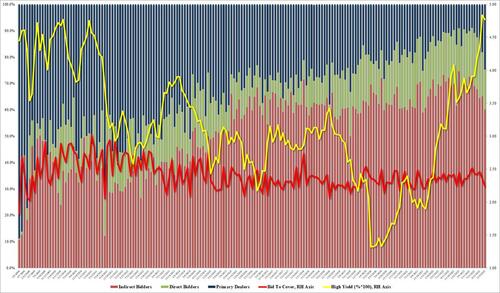
The bid to cover was just as bad: at 2.236 it was the lowest since Dec 2021.
The internals were even worse as foreign bidders (Indirects) tumbled from 65.1% to 60.1%, the lowest since Nov 2021, and with Directs taking down only 15.2%, banks (Dealers) were forced to step up and take the balance, or a whopping 24.7%, double the recent average of 12.7%, and the highest since Nov 2021.
This is a big warning flag because every time we have seen a surge in Dealer takedowns, some sort of Fed intervention – QE or otherwise – has usually followed and we doubt this time will be different.
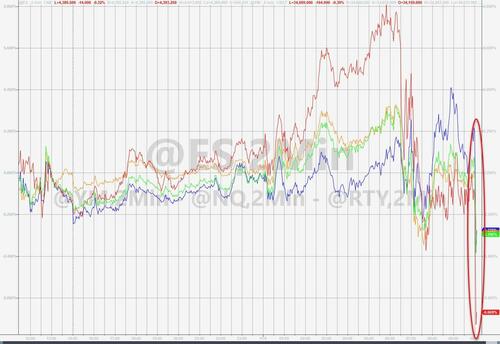
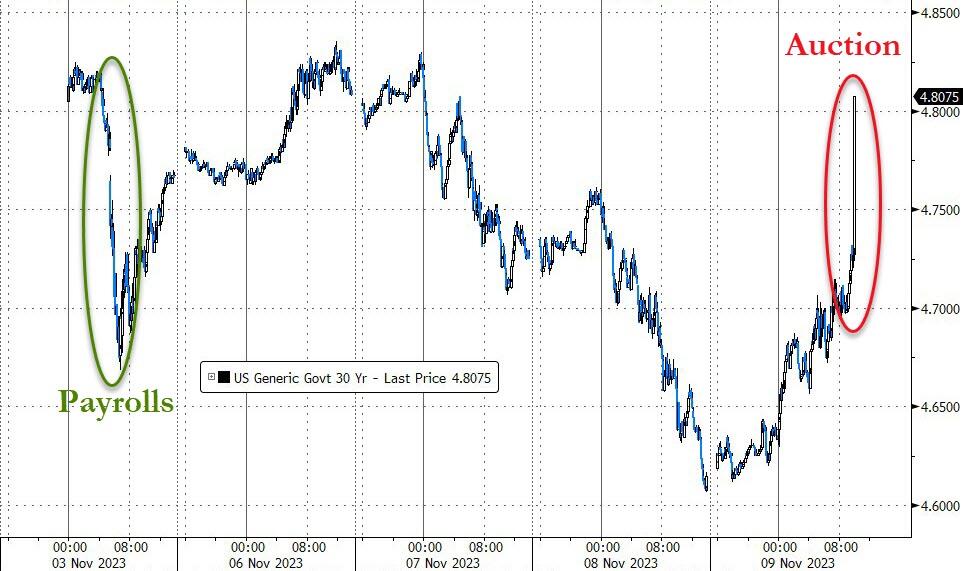
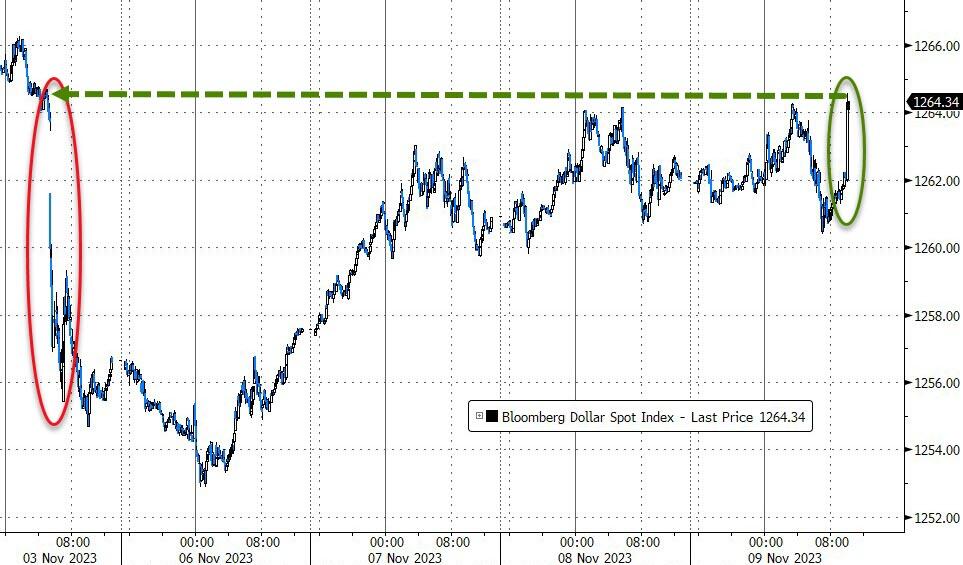
The market reaction to the catastrophic 30Y auction was immediately, sparking a swift and painful response across markets with bonds and stocks hammered lower and the dollar spiking.
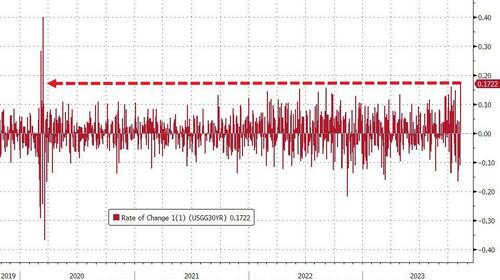
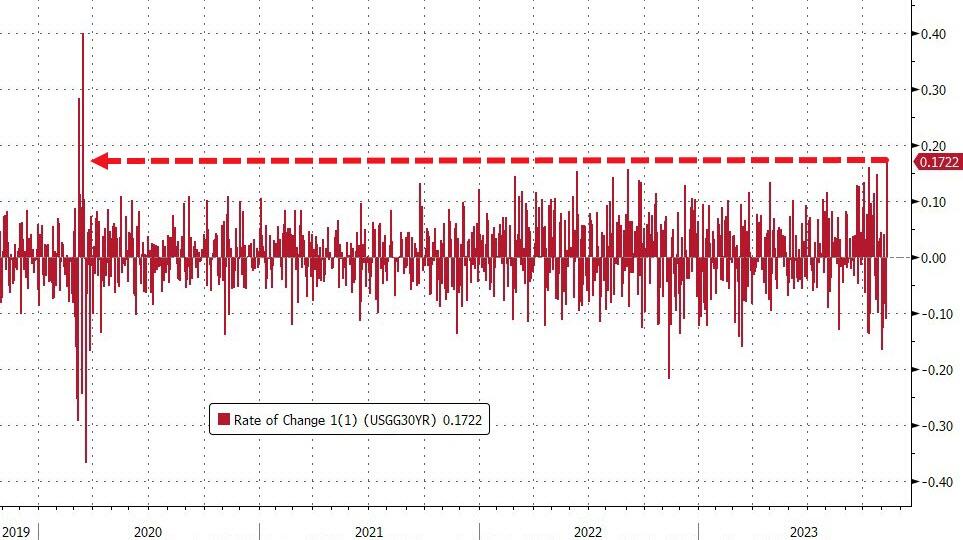
Treasury yields – as you would expect – exploded higher, with 30Y Yields back up to pre-payrolls levels…
That is the biggest spike in 30Y yields since March 2020…
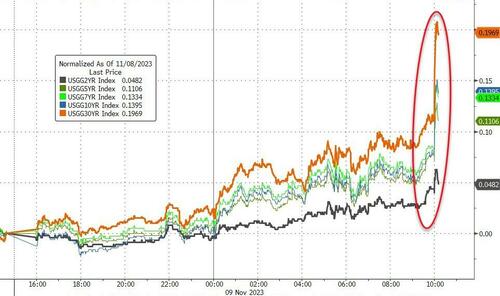
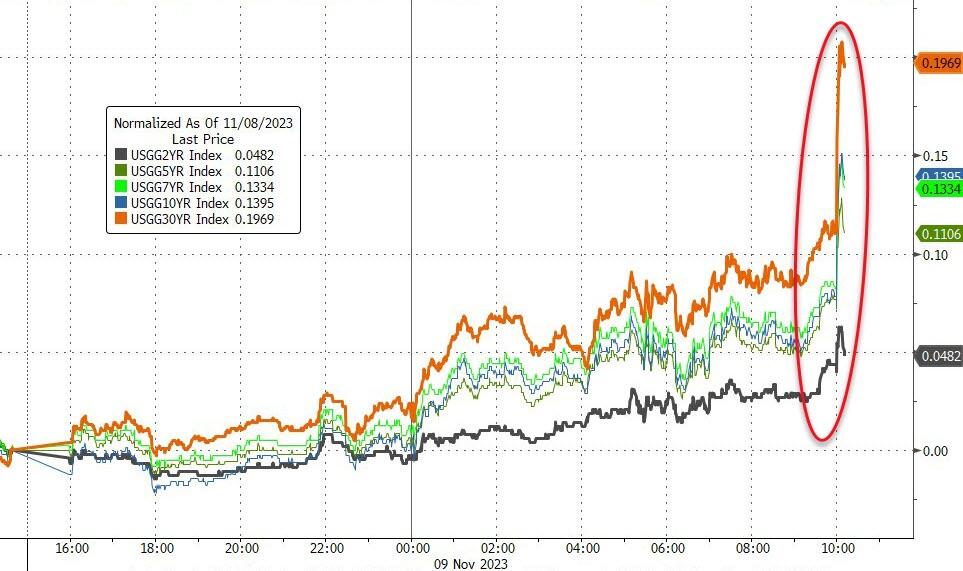
But the entire curve is higher in yields…
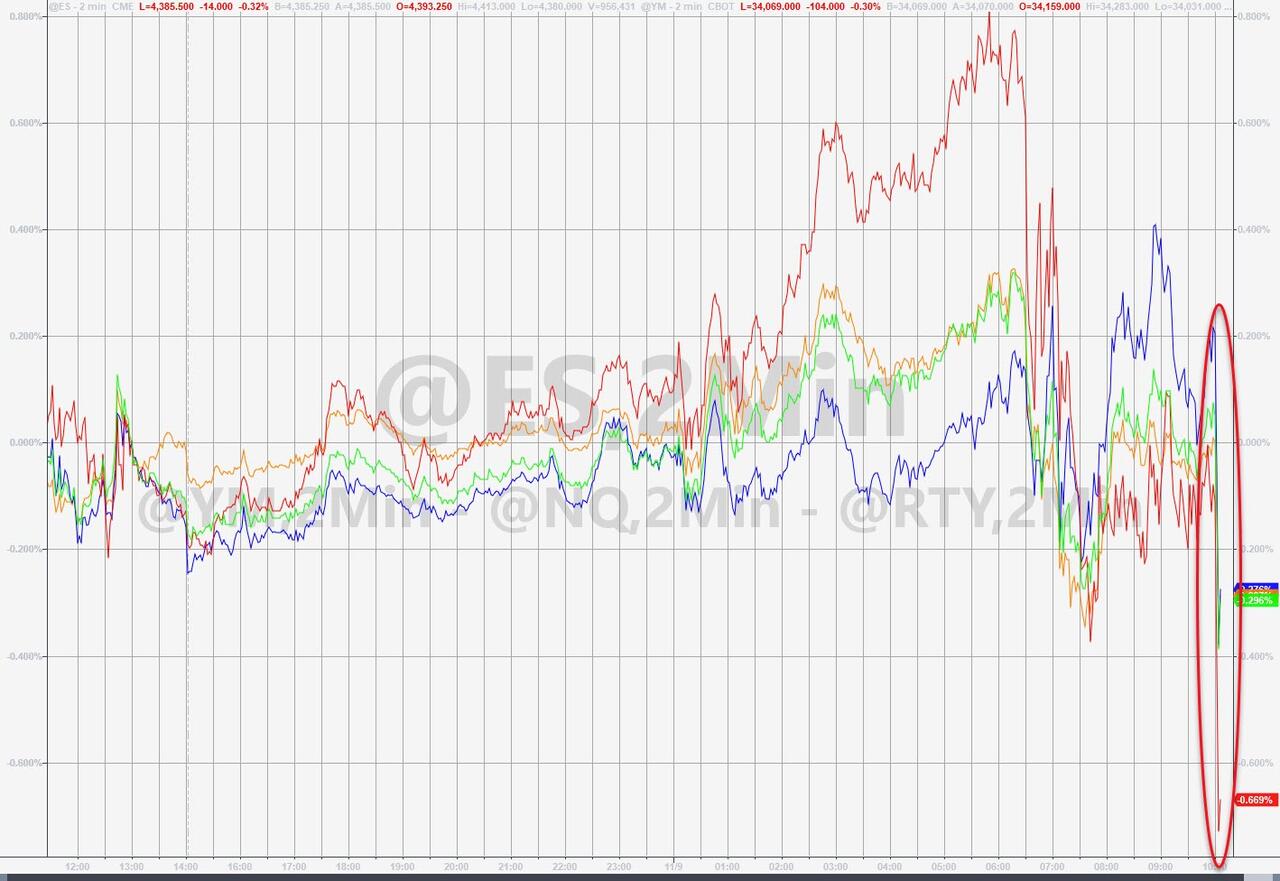
Stocks tanked…
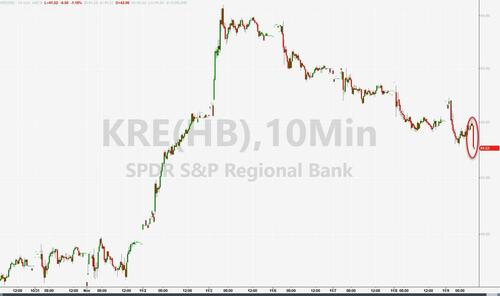
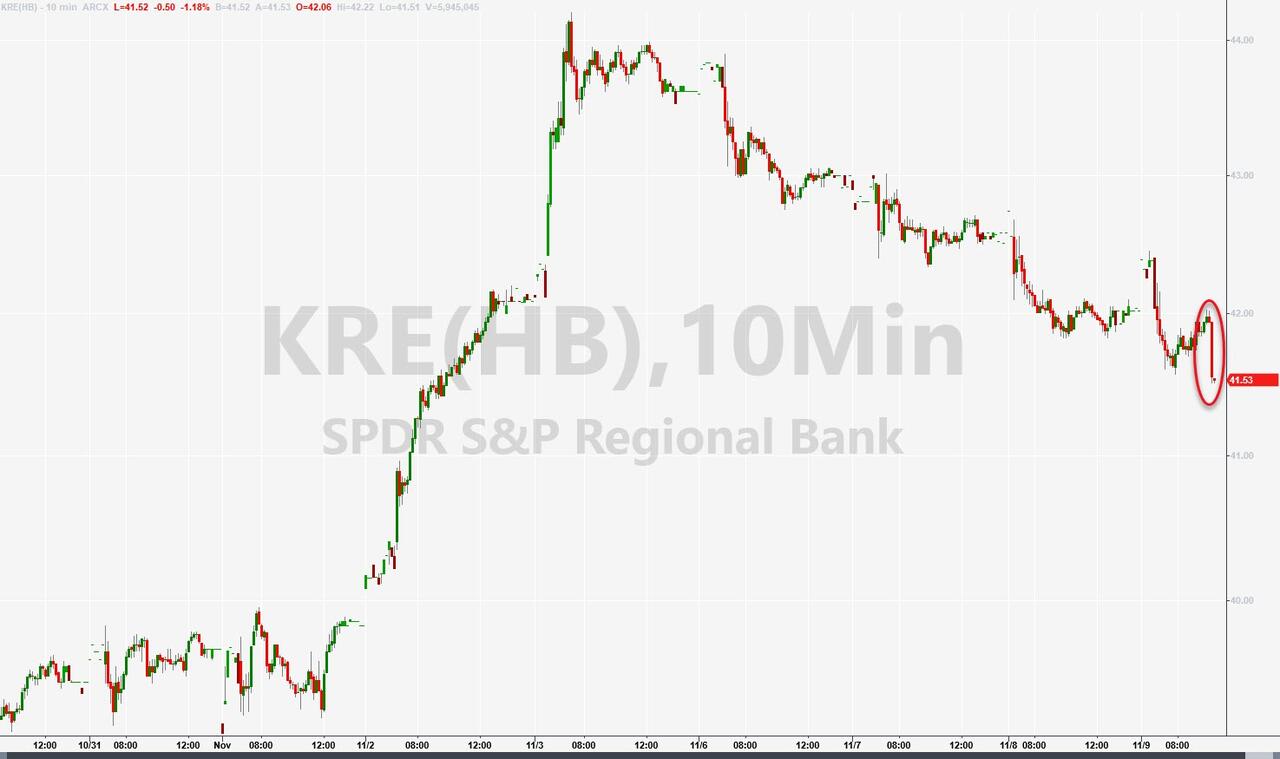
Regional bank stocks tumbled…
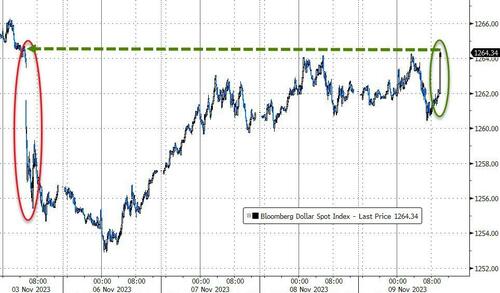
The dollar ripped back up to pre-payrolls levels…
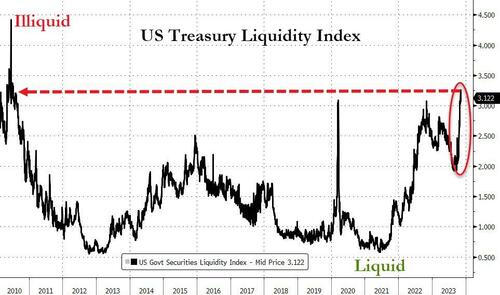
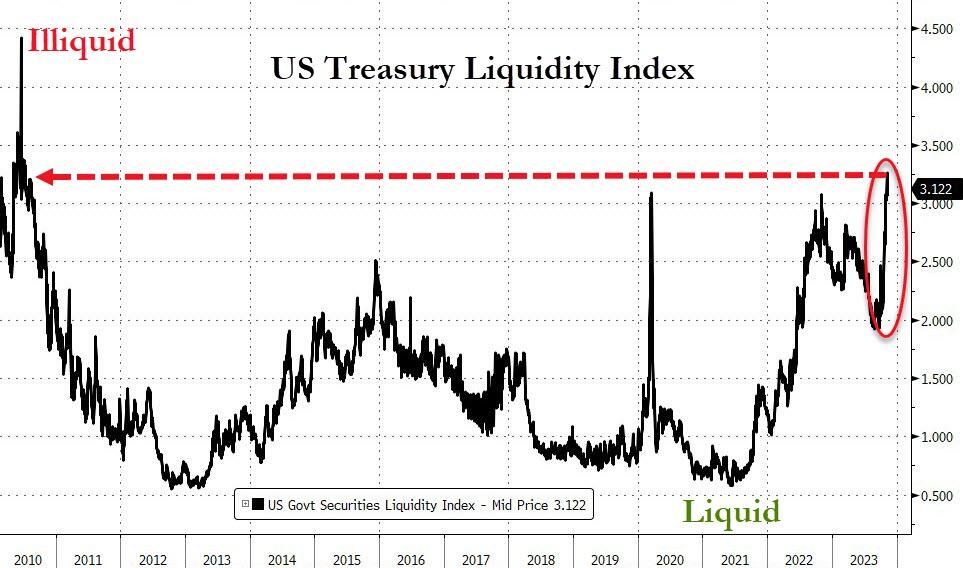
Finally, we note that this ugly auction comes as Treasury Liquidity is evaporating dramatically…
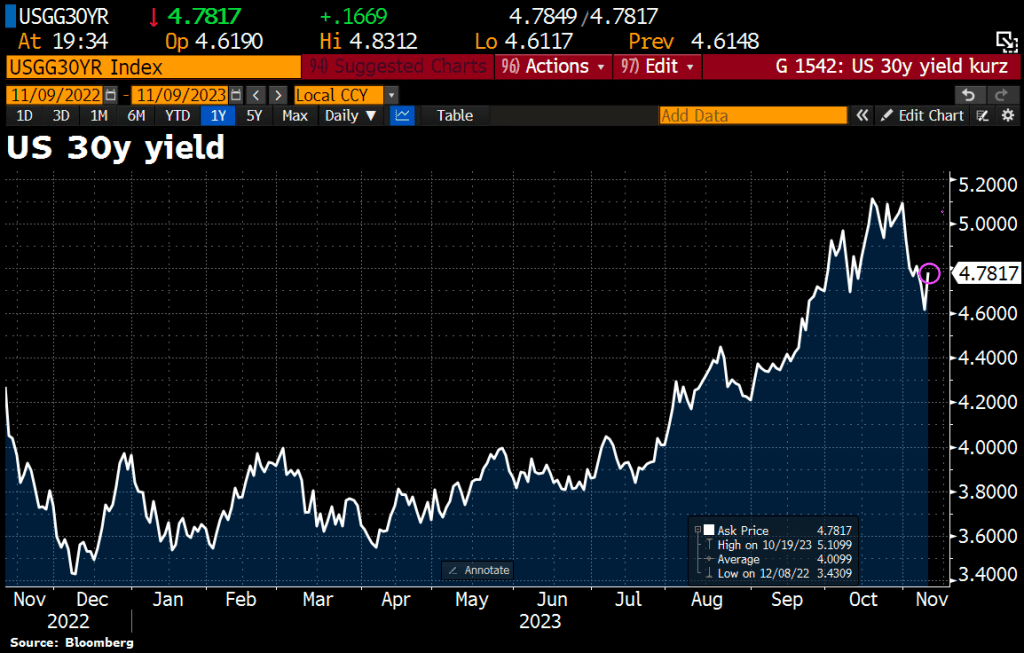
The Fed (and The Treasury) have a problem!! Particularly since the 30Y yield reversed course and is on the rise again.
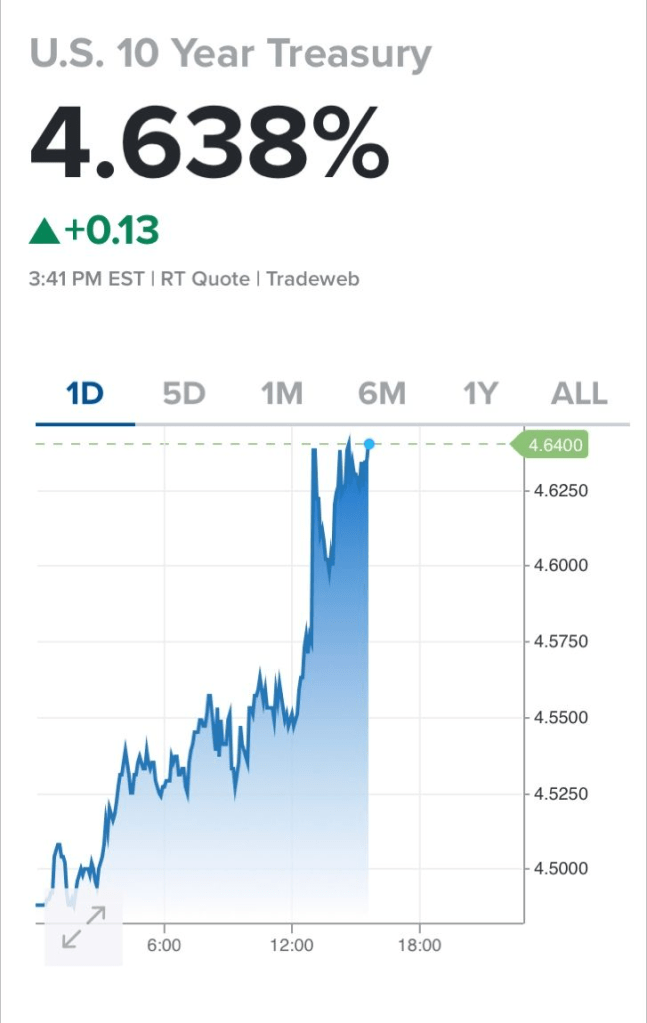
And at the 10 year tenor, the rate rose to 4.638%.
All together now!!
The Edmund Fitzgerald, symbolic of the US under Biden and Janet Yellen.
Call it “The Rich Men North Of Richmond” economy. Where the coastal elites drive the US economy off the cliff with insane spending and borrowing with much of the benefits flowing to big political donors, not the middle class. Think of Span Bankfraud Parboiled as an example.
President Biden loves to spend billions and go on endless vacations (he is in Rehobeth Beach Delaware yet again). He (illegally) forgave student debt, keeps spending billions on Ukraine and keeps spending on failed green energy nightmares.
Biden and his allies will tout the latest GDP numbers as an example of how marvelous Bidenomics is. BUT that GDP report was driven largely by consumer spending.
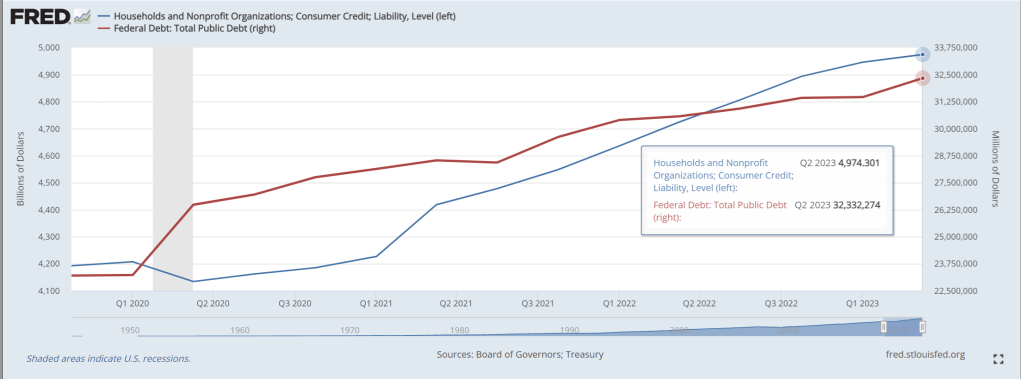
Since the Covid outbreak in 2020, Federal (public) debt is up 45%! Wow. And consumer debt is up 19% under Biden to cope with inflation (caused primarily by massive Federal spending).
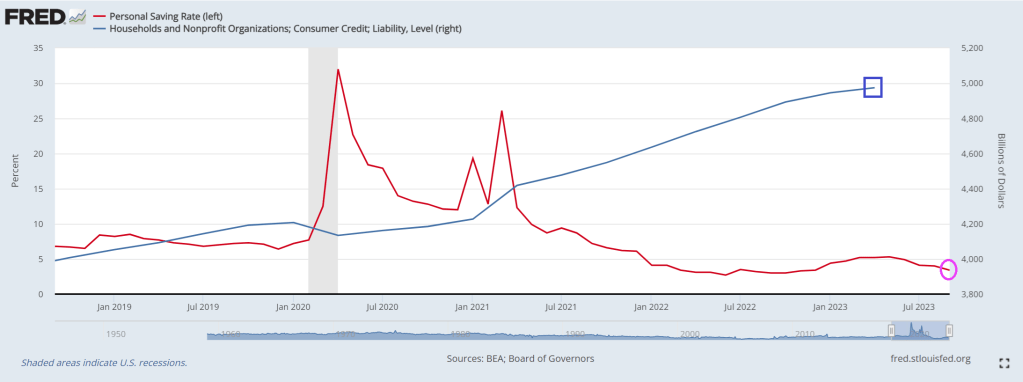
To fuel consumer spending, the personal savings rate has fallen to 3.4%. For point of reference, the personal savings rate in Februray 2020 was 7.7%, so the consumer is running out of gas thanks to inflation and spending.
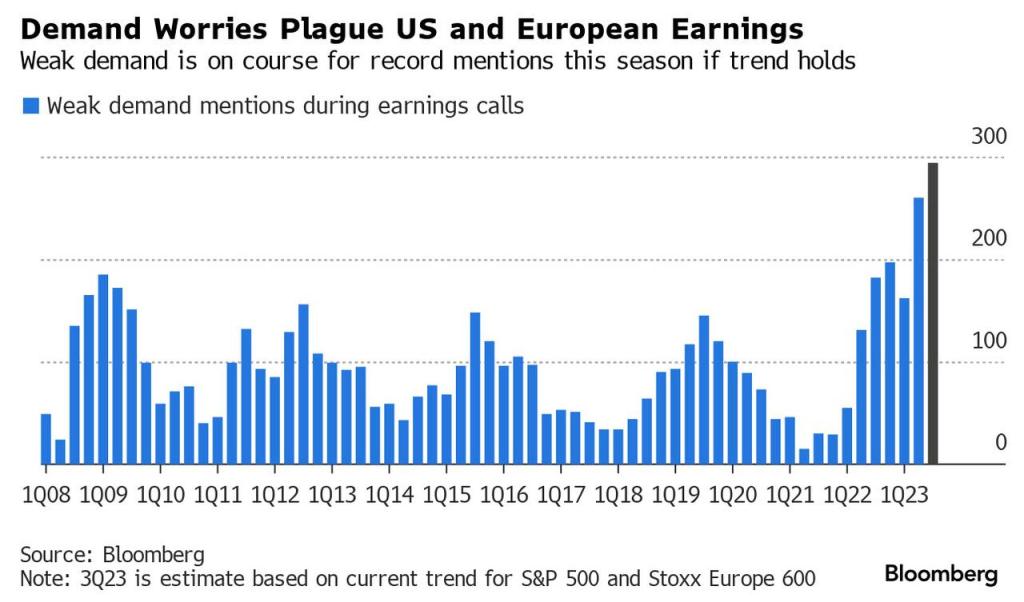
And with a debt-stressed consumer, earnings call revealed concern about continued demand.
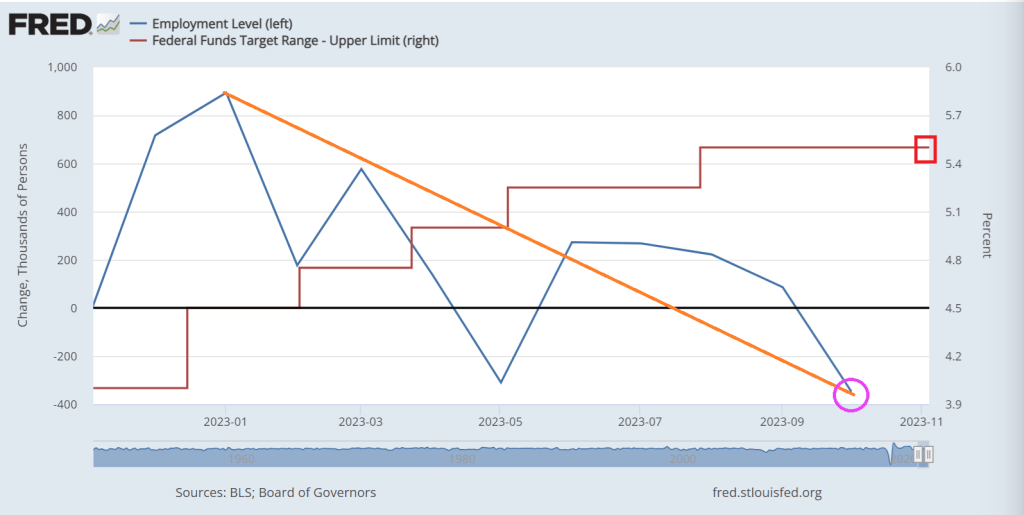
Note the trend in jobs added as The Fed tightened to fight inflation.
Ford EV sales are almost nonexistant. High prices, big losses per vehicle sold, a dearth of charging stations for travel.
At least Biden will say the pain he is causing actually “hurts so good.”
Here is California governor and greaseball Gavin “Gruesome” Newsom test driving a Chinese EV on his trip to China to undercut Biden’s dying reelection prospects.
Bidenomics is a windfall for the donor class (high rate of return on campaign contributions) while the middle class gets beaten to a pulp. Waiting for Biden to lean over and creepily whisper “It’s working!” Even though it is clearly not working, at least for the middle class.
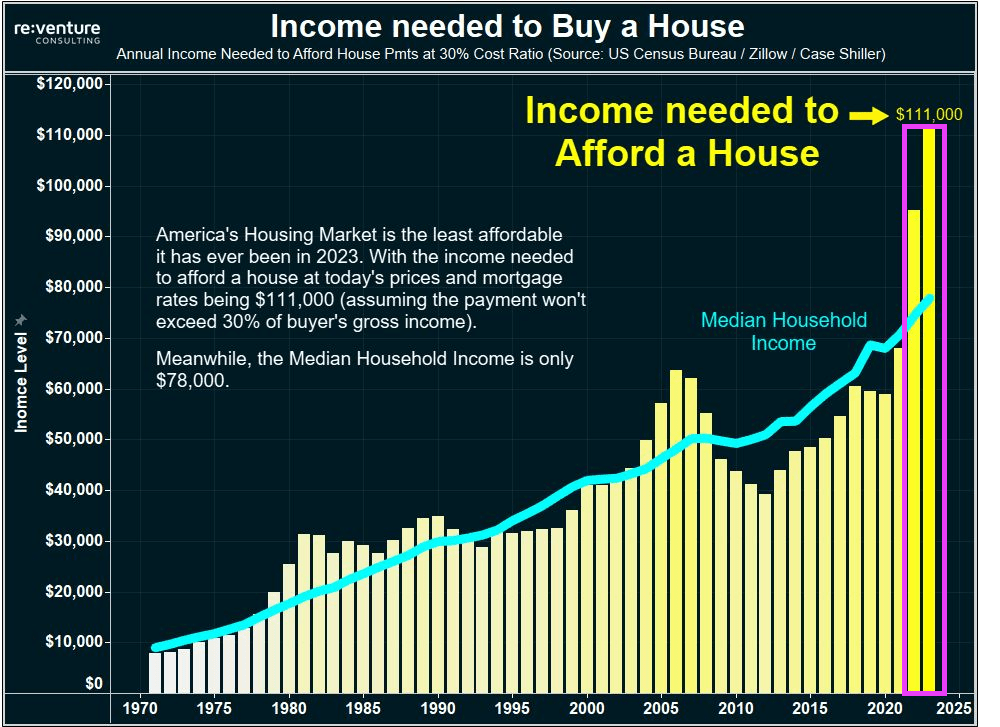
Evidence that Bidenomics is not working and destructive? Try the surging income needed to buy a house under Biden. Home prices are rising faster than median household income. As in $111,000 income needed to buy a house, while median household income is only $78,000. So, housing is simply unaffordable under Bidenomics. The Biden era is outlined in pink.
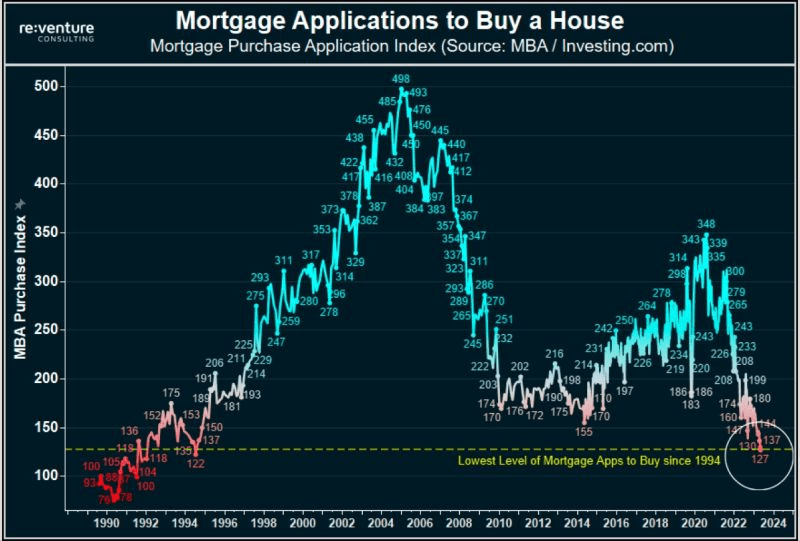
Mortgage purchase applications have collapsed to 1994 levels.
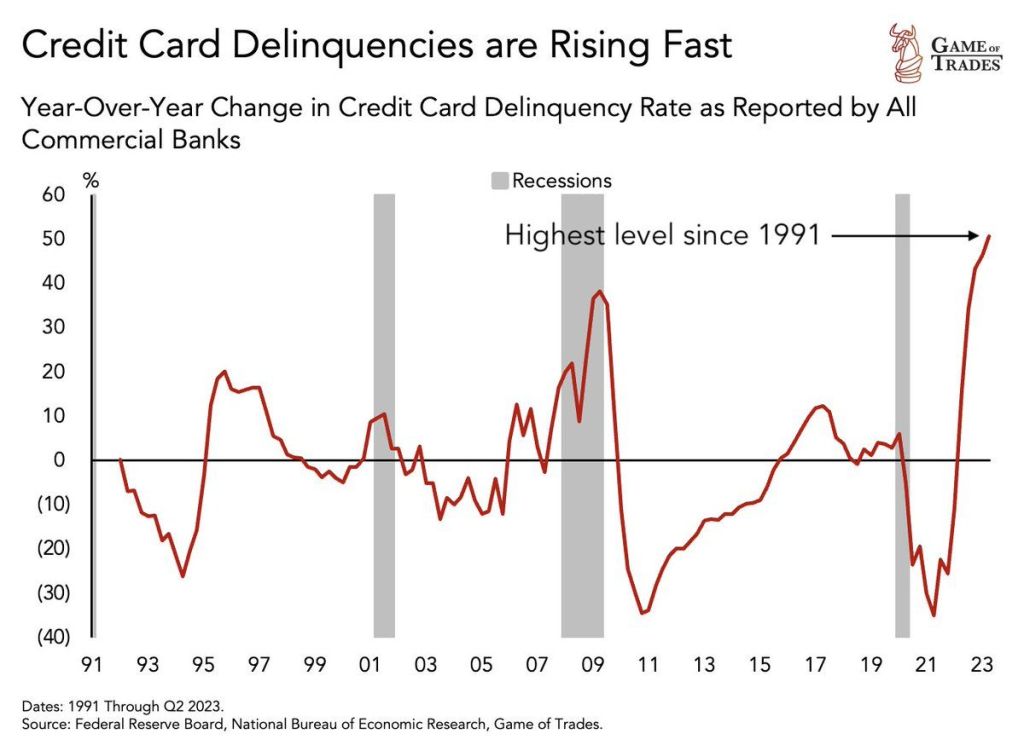
Meanwhile, stressed households are seeing credit card delinquencies at the highest level since 1991.
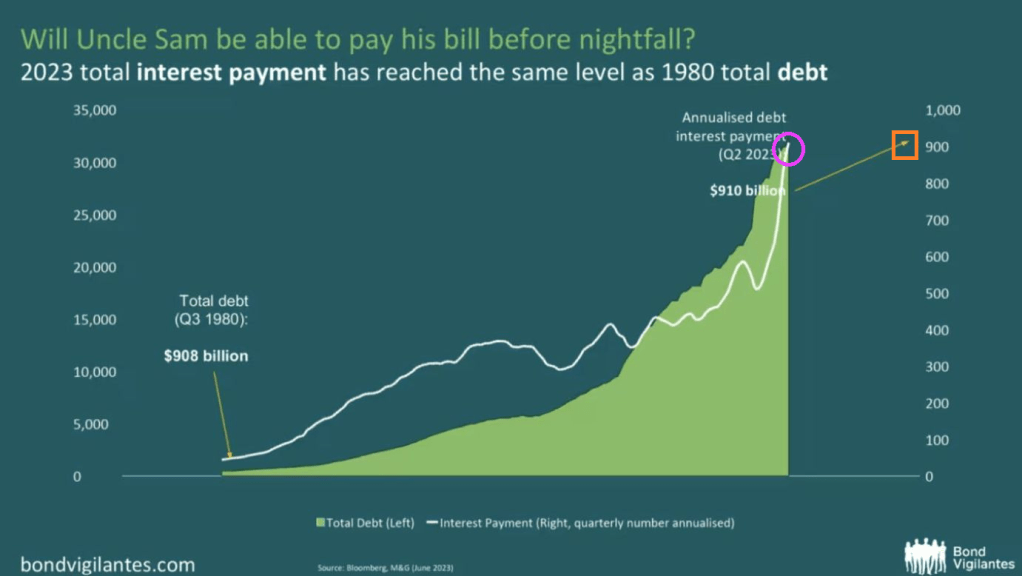
And thanks to Uncle Spam (given how Uncle Sam is destroying the middle class it is now Uncle Spam), 2023 interest payments are the same as the total debt from 1980! Spam, which the Federal government has devolved into, is very high in fat, calories and sodium and low in important nutrients, such as protein, vitamins and minerals.
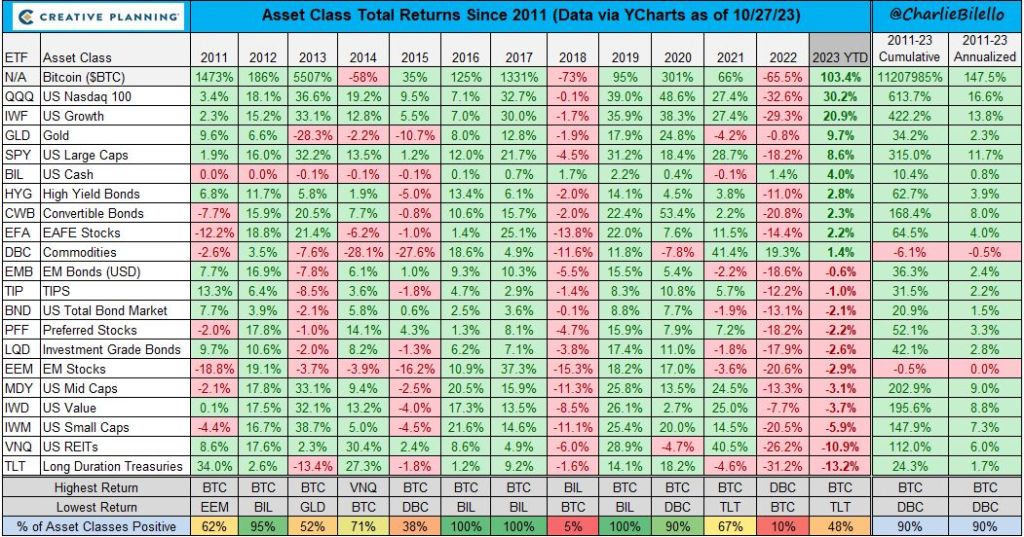
2022 was a bad year for investments under Bidenomics. 2023 year to date is showing huge gains for Bitcoin, the NASDAQ and gold. Bringing up the rear are long duration Treasuries and REITs (real estate investment trusts), both earning negative returns thus far of less than -10%.
Bidenomics strikes … again. No, not his inane ramblings about Hamas being “the other team” or that Hamas has to learn to shoot straight. But his policies freezing effects on the economy. Like housing.
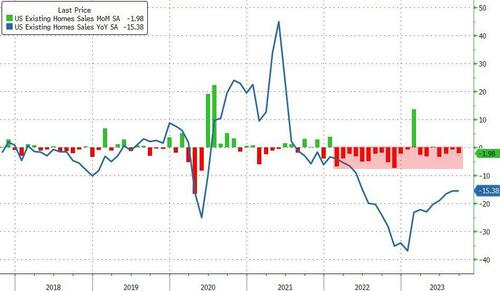
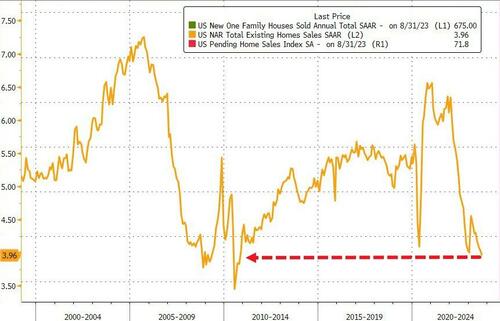
Existing-home sales faded in September, according to the National Association of REALTORS®. Among the four major U.S. regions, sales rose in the Northeast but receded in the Midwest, South and West. All four regions registered year-over-year sales declines.
Total existing-home sales – completed transactions that include single-family homes, townhomes, condominiums and co-ops – waned 2.0% from August to a seasonally adjusted annual rate of 3.96 million in September. Year-over-year, sales dropped 15.4% (down from 4.68 million in September 2022). … Total housing inventory registered at the end of September was 1.13 million units, up 2.7% from August but down 8.1% from one year ago (1.23 million). Unsold inventory sits at a 3.4-month supply at the current sales pace, up from 3.3 months in August and 3.2 months in September 2022.
The total existing home sales SAAR dropped back below 4mm for the first time since October 2010 (during the foreclosure crisis)…
Source: Bloomberg
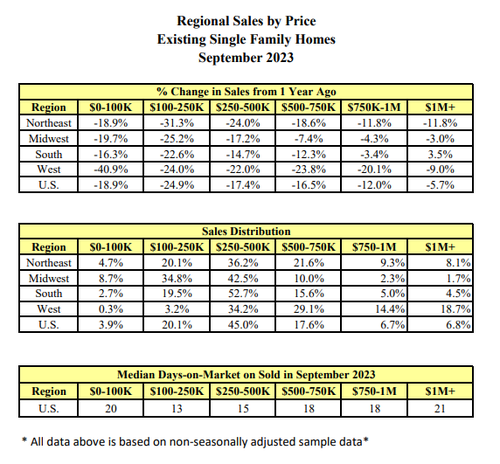
Sales fell in all regions except the Northeast in September… and in every price range…
Single-family home sales fell to an annualized 3.53 million pace, the lowest since 2010. Condominium and co-op sales also declined.
“As has been the case throughout this year, limited inventory and low housing affordability continue to hamper home sales,” said Lawrence Yun, NAR’s chief economist.
“The Federal Reserve simply cannot keep raising interest rates in light of softening inflation and weakening job gains.”
First-time buyers made up a historically low 27% of purchases, down from the prior month.
Cash sales represented 29% of total sales, matching the highest level in over a decade. Investors, who often purchase with cash and are therefore less sensitive to mortgage rates, made up 18% of the market.
“It would be very unusual to have higher cash compared to first time buyers,” Yun said on a call with reporters.
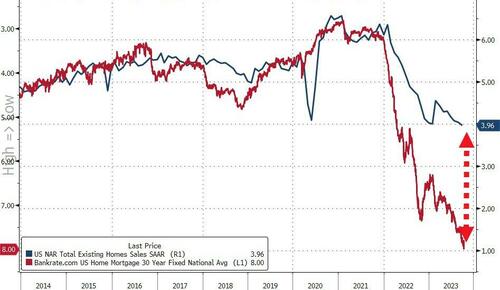
And, if mortgage rates (and thus affordability) are anything to go by, things are about to get real…
Source: Bloomberg
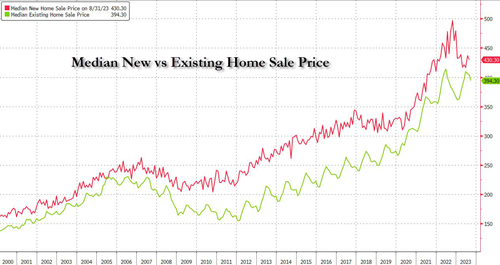
The median selling price rose 2.8% from a year earlier to $394,300, the highest September reading on record, pushing affordability even lower. But existing home prices are falling relative to new home prices (with the ratio near record lows)…
It looks like The House may elect a RINO as Speaker (Patrick McHenry, RINO-NC) to replace McCarthy. One RINO replacing another RINO … all so The House can continue its insane, inflation inducing spending.
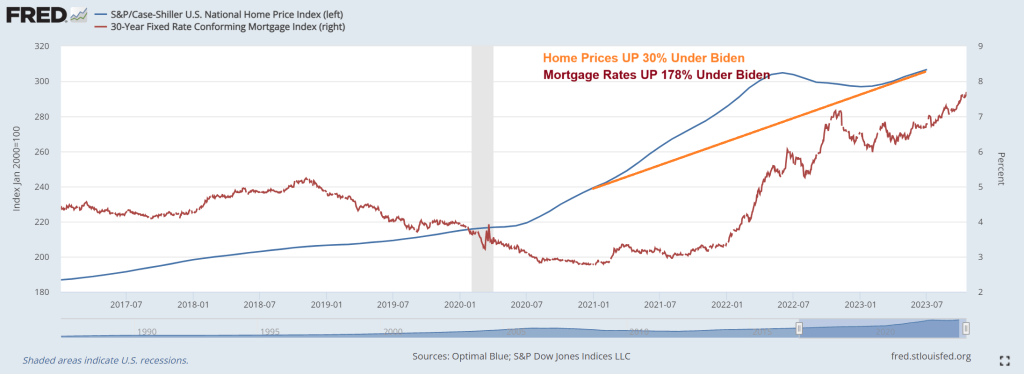
Under Bidenomics, home prices are up 30% while real weekly earnings growth has been negative for most of Biden’s Presidency. And mortgage rates are up 178% under Bidenomics.
It’s harder than ever for Americans to afford a home.
A homebuyer must earn $114,627 to afford the median-priced U.S. home, up 15% ($15,285) from a year ago and up more than 50% since the start of the pandemic. That’s the highest annual income necessary to afford a home on record.
This is based on a Redfin analysis that compares median monthly mortgage payments for homebuyers in August 2023 and August 2022. The income data in this analysis is adjusted for inflation. See the bottom of this report for more on methodology.
Housing costs are higher than ever because of the one-two punch of sky-high mortgage rates and rising home prices. The average rate on a 30-year fixed mortgage was 7.07% in August. Mortgage rates have climbed even higher since then, hitting 7.57% during the week ending October 12–their highest level in over two decades. But even though soaring mortgage rates have dampened demand, low inventory is causing home prices to increase. The typical U.S. home sold for about $420,000 in August, up 3% year over year and just about $12,000 shy of the all-time high hit in mid-2022.
The typical U.S. homebuyer’s monthly mortgage payment is $2,866, an all-time high. That’s up 20% from $2,395 a year earlier, and by that time payments had already increased substantially from the beginning of the pandemic, a time of ultra-low mortgage rates and yet-to-skyrocket home prices. In August 2020, for instance, the typical monthly payment was $1,581, based on that month’s average mortgage rate of 2.94% and median home price of $329,000. At that time, a homebuyer would have needed to earn $75,000 per year to afford the typical home.
The typical American household earns about $40,000 less than the income needed to buy a median-priced home. The median household income was roughly $75,000 in 2022, the most recent year for which annual income data is available. Hourly wages have risen in 2023, but not nearly as fast as the income necessary to afford a home is rising: The average U.S. hourly wage has increased by about 5% over the last year.
“In a homebuyer’s ideal world, rising mortgage rates would push demand and home prices down enough to make up for high interest payments. But that’s not what’s happening now: Although new listings are ticking up slightly, inventory is still near record lows as homeowners hang onto their low mortgage rates–and that’s propping up prices,” said Redfin Economics Research Lead Chen Zhao. “Buyers–particularly first-timers–who are committed to getting into a home now should think outside the box. Consider a condo or townhouse, which are less expensive than a single-family home, and/or consider moving to a more affordable part of the country, or a more affordable suburb.”
Affordability is less of a problem for all-cash and move-up buyers. The major increase in income necessary to afford a home hits first-time homebuyers hardest. Buyers who can afford to pay cash aren’t impacted by high mortgage rates, and they likely earn more than the income necessary to purchase a home, anyway. Buyers who are selling a home to buy another one are in a better boat than first-timers because they have likely built up equity in their current home, which takes a bit of the sting out of soaring monthly payments. The caveat to the caveat is those who bought at the height of the pandemic-era market with an ultra-low mortgage rate and need to sell now: Not only are they giving up a low rate, they also may have lost money on their home.
Metro-level highlights: Income needed to buy a home has risen in all major metros, with biggest uptick in Miami and smallest in Austin
August 2023, analysis includes 100 most populous U.S. metros for which data is available
Metros where necessary income has increased most: In both Miami and Newark, NJ, homebuyers must earn 33% more than a year ago to afford the typical home–the biggest percent increase of the major U.S. metros. Homebuyers in Miami need to earn $143,000 annually to afford the area’s typical monthly mortgage payment of $3,580, and Newark buyers need to earn roughly $160,000 to afford that area’s $3,989 payment.
Other metros where necessary income has increased by over 30%: The income necessary to afford a median-priced home has increased by over 30% in four other metros, all in the eastern half of the country: Bridgeport, CT ($183,000); Dayton, OH ($60,000); Rochester, NY ($66,000); and Hartford, CT ($95,000).
Buyers need to earn more in every major metro: Skyrocketing mortgage rates have caused the income necessary to buy a home to increase in every major metro, even the places where prices have declined over the last year.
Necessary income has increased least in pandemic homebuying hotspots: Austin, TX homebuyers must earn $126,000 to afford the median-priced home, 8% more than a year ago–the smallest increase of all the major U.S. metros. That’s despite Austin home prices falling 7% year over year in August after they skyrocketed during the pandemic, with remote workers flocking in. Boise, ID, another pandemic homebuying hotspot where demand has since dropped, experienced the next-smallest increase: up 9% to $127,000. Salt Lake City, Fort Worth, TX and Lakeland, FL come next, with year-over-year increases of about 13% each. Home prices are down from a year ago in all those metros.
Homebuyers must earn six figures to buy a home in half the major metros in the country: In 50 of the 100 metros in this analysis, buyers must earn at least $100,000 to afford the median-priced home in their area. Buyers must earn at least $50,000 everywhere in the country.
Bay Area buyers must earn $400,000: Buyers in the most expensive markets in the country–San Francisco and San Jose, CA–must earn more than $400,000 to afford the median-priced home in their area, both up nearly 25% year over year. The next five metros are all in California: Anaheim ($300,000), Oakland ($250,000), San Diego ($241,000), Los Angeles ($237,000) and Oxnard ($233,000).
Rust Belt buyers need the least income–but it’s still up from a year ago: Detroit homebuyers must earn about $52,000 to afford the area’s median-priced home, up 19% from a year ago. That’s the lowest income required to afford a home in the U.S. Next come three Ohio metros (Akron, Dayton and Cleveland) and Little Rock, AR, all of which require roughly $60,000 in annual income to buy a home.
Face it, the US economy and housing/mortgage markets are addicted to gov!


You must be logged in to post a comment.